The following protocol was developed to characterize long-bone healing callus harvested from euthanized mice. However, most of the steps can be applied to rats and also used for in vivo scanning of fractured bones. The protocol describes a particular µCT system and specific image processing, analysis, and visualization software (see Table of Materials), yet the methodology is generally applicable to other scanners and software. The protocol was approved by the Institutional Animal Care and Use Committee of The Pennsylvania State University College of Medicine. Mice used in this study were 16-week-old, male C57BL/6J mice (average weight 31.45 ± 3.2 g).
1. Tissue harvesting and preservation
NOTE: Use a suitable murine fracture model. For this study, the mid-diaphyseal open tibial fracture model was used according to the standard protocol described in12,13.
- At the end of the fracture model experiment, euthanize the mouse by administering an intraperitoneal injection of ketamine or xylazine (500 mg/kg or 50 mg/kg, respectively).
- Using scissors, harvest the fractured bone from the mid-femur to the tibiotalar joint without disturbing the fracture site. Remove the muscles surrounding the bone leaving only the soft tissue that is in direct contact with the bone to support the fracture site during the subsequent processing steps. Remove the intramedullary pin using micro-mosquito straight hemostatic forceps.
- Preserve the samples in formalin at 4 °C or in saline at -20 °C. The choice of preservation vehicle depends on the intended applications downstream to µCT. In this study, the samples were preserved in saline at -20 °C.
2. µCT scanning
- Sample preparation
- For simultaneous scanning of multiple samples, place up to six samples into a custom developed, 3D-printed scanning fixture (Figure 1 A,B) or similar. Simultaneous scanning reduces scanning time and cost. The customized fixture used in this study contains six slots to hold the long bone samples and a center hole for a hydroxyapatite (HA) phantom (Figure 1A,B; Table of Materials).
NOTE: The HA phantom will serve as a standard in step 4.2 (see below) to convert µCT units (typically Hounsfield) to HA density (mgHA/ccm). - Place the prepared fixture in a syringe or a conical tube that is similar to the diameter of the field of view (FOV; Figure 1C). In this study, a 20 mm syringe was used to match the 21.5 mm field of view.
- To prevent samples from drying out during the scanning process, fill the syringe or the canonical tube with the preservative used in step 1.3 (saline was used in this study).
- For simultaneous scanning of multiple samples, place up to six samples into a custom developed, 3D-printed scanning fixture (Figure 1 A,B) or similar. Simultaneous scanning reduces scanning time and cost. The customized fixture used in this study contains six slots to hold the long bone samples and a center hole for a hydroxyapatite (HA) phantom (Figure 1A,B; Table of Materials).
- Scanning
- Prior to scanning, confirm that the µCT machine is calibrated as follows: place an HA phantom at the centerline of the µCT FOV, scan the phantom, and measure the density of HA. Ensure that the measured density is consistent with the density provided by the manufacturer.
- Align the sample fixture centerline with the approximate centerline of the µCT FOV. This ensures that the samples are within the FOV, and their long axes have orientation approximately coinciding with the axial direction of the resulting images.
NOTE: This standardized orientation can later help make the analysis procedure less prone to variabilities such as in the amount of tissue considered within the volume of interest. - Set the scanning parameters of the µCT system (Table of Materials). The parameters used in this study are 10.5 µm (isotropic voxel size), 55 kVp (energy/intensity), 145 µA (current), and 300 ms (integration time). Determine the voxel size based on the approximate thickness of the mouse trabeculae (20-60 µm)8. Visually inspect the scan in different views to make sure it covers the whole volume of all callus samples.
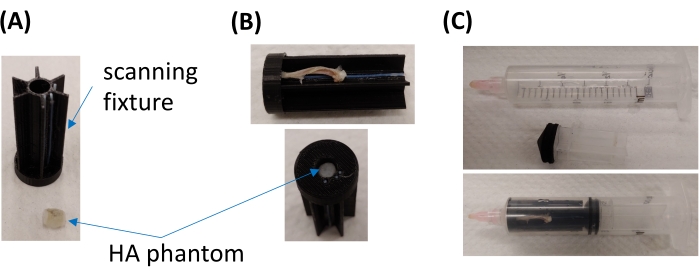
Figure 1: Structure of the customized scanning fixture. (A) Images of the scanning fixture (top), showing the six sample slots, and the HA phantom (bottom). (B) Images showing the long-bone sample (top) and the HA phantom (bottom) placed in the dedicated slots. (C) Images showing the scanning fixture placed in a 20 mm syringe. Please click here to view a larger version of this figure.
3. Image segmentation
NOTE: Raw images are automatically reconstructed to image sequence data.
- Image conversion: convert the reconstructed image sequence data to DICOM image sequences using an image processing software (see Table of Materials). Import DICOM image sequences into the software (see Table of Materials) for image processing, analysis, and visualization (Figure 2A).
- Image cropping: one sample at a time, crop each image stack and ensure that the whole sample is included in the cropped volume (Figure 2B). Save the cropped image as follows: click the File tab on the top left side of the screen, select Save Project, and then select Minimize Project Size from the options that appear on the screen. The file will be saved in the commercial software format.
- Image denoising: use a filtering method to reduce the noise level and to avoid blurs as follows.
- Click the File tab and choose the image to be processed using Open Data. The opened image will appear in the project view window in the top left corner of the screen.
- Right click to select Image Processing and then Filter Sandbox. Click Create.
- Perform the following in the Properties window (in the left bottom corner of the screen): choose Data as the preview type; select the filter type from the drop-down menu next to Filter; choose 3D for interpretation; select Separable from the drop-down menu next to kernel type; fill in the values to be used for standard deviation and kernel size factor in the available empty box next to each; select Same as input from the drop-down menu next to output; click Apply.
NOTE: Choice of the filter type (available options are bilateral, box, Gaussian, median, recursive exponential, delineate, anisotropic diffusion, non-local means, unsharp masking, and FFT filter) and parameters depends on the noise level and the voxel size of scanned images. For the Gaussian filter, 3 x 3 x 3 and 5 x 5 x 5 are commonly used values for the kernel size factor, and 0.5-2.0 is commonly used for standard deviation8. In this study, a Gaussian filter was applied, and 5 x 5 x 5 and 0.8 were used for kernel size factor and standard deviation, respectively.
- Image realignment
NOTE: This is an optional step. When misalignment of long bone samples relative to the coordinate axes of the imaging system occurs during the scanning process, a digital alignment method can be applied to correct the misalignment (Figure 2C).- Create a 3D rendered image of the sample as follows. In the project view window, select the filtered, cropped image (created in step 3.3). Right click to select Display and then Volume Rendering from the drop-down menu, then click Create. Visually check the 3D rendered image in the sagittal and frontal planes.
- Manually rotate the rendered volume to obtain a good alignment in the longitudinal axis. Apply transformation to the rotated images as follows: in the properties window, click the Transform Editor, then go to transform editor-manipulator and select Transformer from the drop-down menu. Now the sample can be rotated and realigned. Once the realignment process is done, click the Transform Editor again to lock the image.
- Resample the filtered image (created in step 3.3) to create new transverse (axial) plane image slices as follows: in the project view window, select the image from step 3.4.2. Right click to select Geometry Transform and then Resample Transformed Image from the drop-down menu and click Create. In the properties window, go to Data and perform the following: for interpolation, select Standard from the drop-down menu; for mode, choose Extended; for preserve, choose Voxel Size; for padding value, enter zero in the available blank box. Then click Apply.
- Defining the volume of interest (VOI)
- Go through the transverse image slices and identify the center plane of the fracture callus. Define the VOI based on the proximal and distal ends of the callus. In cases when the callus ends are difficult to define, define the VOI based on a standardized distance away from the callus center plane (Figure 2D).
NOTE: During healing phases that precede bone remodeling, defining the edges of the mineralized callus is easy because the trabecular structure of the newly formed woven bone is distinct from the cortical structure of the original bone. However, when the remodeling phase ensues, the newly formed bone acquires the cortical structure gradually; thus, defining the edges of the callus becomes increasingly challenging.
- Go through the transverse image slices and identify the center plane of the fracture callus. Define the VOI based on the proximal and distal ends of the callus. In cases when the callus ends are difficult to define, define the VOI based on a standardized distance away from the callus center plane (Figure 2D).
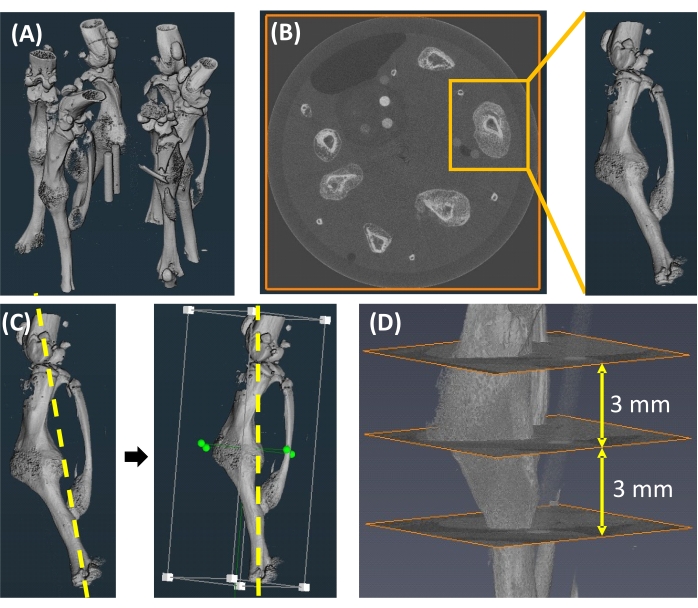
Figure 2: Image segmentation. (A) An image showing six samples within one scan. (B) Image cropping to isolate individual samples. (C) Digital alignment to correct a misaligned longitudinal axis (yellow dotted line). (D) Definition of the VOI and callus center plane. Please click here to view a larger version of this figure.
4. Image analysis
- Segmentation of the callus and cortical bone
- Contour the outer boundary of the callus semi-automatically using the segmentation lasso tool with auto trace and trace edges options (Figure 3A) as follows:
- Following reassembly of transformed images (step 3.4.3), click the Segmentation tab in the second tab row from the top of the screen. In the segmentation editor window, select a transformed image (created in step 3.4.3) from the drop-down menu next to image.
- In the MATERIALS window, double click Add; by doing so, two tabs named material3 and material4 will appear. Right click to rename material3 to callus and material4 to cortical bone.
- In the SELECTION window, click on the lasso icon; from the options that appear, select Freehand for the 2D mode, Inside for the 3D Mode, and both Auto trace and Trace edges for options. Use the lasso to mark the regions of interest.
- Repeat this contouring step with slices sampled across the VOI (Figure 3B). The contoured slices can be spaced apart (e.g., separated by 20 slices).
NOTE: In regions with complex callus structures, the user can consider decreasing the spacing between contoured slices to capture more fragments (Figure 3A,B). - Interpolate across the contoured callus outlines to create a complete callus label (Figure 3C,D) as follows: in the MATERIALS window, choose the Callus file (created in step 4.1.1.2.), click the Selection tab on the top of the screen, and select Interpolate from the drop-down menu. In the SELECTION window, click on the plus sign.
- Open the Cortical Bone file created in step 4.1.1.2. Segment the cortical bone, including the medullary cavity, as outlined for the callus in steps 4.1.1 and 4.1.2. (Figure 4A,B). Interpolate the contoured periosteal cortex to create a cortical bone label as outlined for the callus in step 4.1.3 (Figure 4C,D).
- Calculate the contoured volume and mean gray value of the callus as follows: click the Segmentation tab on the top row of the screen and select Material Statistics from the drop-down menu. This will generate a table that contains all the calculated values. The values of the cortical bone and the callus (after subtracting the cortical bone) are provided separately. Once the table is generated, click Export into Workspace to save the data.
- Contour the outer boundary of the callus semi-automatically using the segmentation lasso tool with auto trace and trace edges options (Figure 3A) as follows:
- Conversion of gray-scale units to bone mineral density
- Crop the 3D image of the 4.5 mm HA phantom (Figure 2B) from the whole image and click Segmentation. The resin of the HA phantom contains five small HA cylinders (Figure 1A). For the HA cylinder that has the highest density, define the first and the last slices by visual inspection.
- Draw two circles at the first and the last slices (avoiding edges) using the brush tool (Figure 5A) as follows: in the MATERIALS window, click Add four times. Right click to rename material3, material4, material5, and material6 to phantom1, phantom2, phantom3, and phantom4, respectively. Select Phantom1, click the brush icon in the SELECTION window and use the slider to adjust the brush size (circular tracing) based on the size of the phantom (the size of the circle should be smaller than that of the phantom).
- Apply interpolation between the two circles to create a volume for each HA cylinder (Figure 5B) as follows: in the MATERIALS window, select Phantom1, click the Selection tab on the top row of the screen, and select Interpolate from the drop-down menu. In the SELECTION window, click the Plus sign.
- Repeat the segmentation process with three of the remaining HA cylinders, starting from the second highest HA density and ending with the second lowest HA density (Figure 5B). The cylinder with the lowest HA density can be excluded because it is often difficult to segment.
- Use the generated 3D labels to calculate the mean gray values of the four analyzed HA cylinders. Using a spreadsheet (see Table of Materials) or similar, plot the mean gray values and the corresponding bone mineral density (BMD) values provided by the phantom manufacturer. Generate a correlation equation between BMD and the gray values using linear regression.
- Segmentation of the mineralized callus and calculation of BMD
- Based on the correlation equation generated in step 4.2.5 and the chosen threshold that differentiates mineralized and unmineralized callus, determine the corresponding gray value threshold. Accordingly, label the callus area with gray values greater than the threshold as mineralized callus and label the rest as unmineralized (Figure 6A,B). In this study, 250 mgHA/ccm was used as the threshold for mineralized callus14,15.
- Calculate the total callus and mineralized callus volumes. Based on these values, calculate the bone volume fraction (mineralized callus volume normalized to the total callus volume = BV/TV). Use the measured mean grey value for the total callus to calculate the BMD of callus using the correlation equation generated in 4.2.5.
NOTE: Based on the goal of the study and the software used for analysis, other parameters such as SMI (structure model index), trabecular thickness, and degree of anisotropy can be calculated.
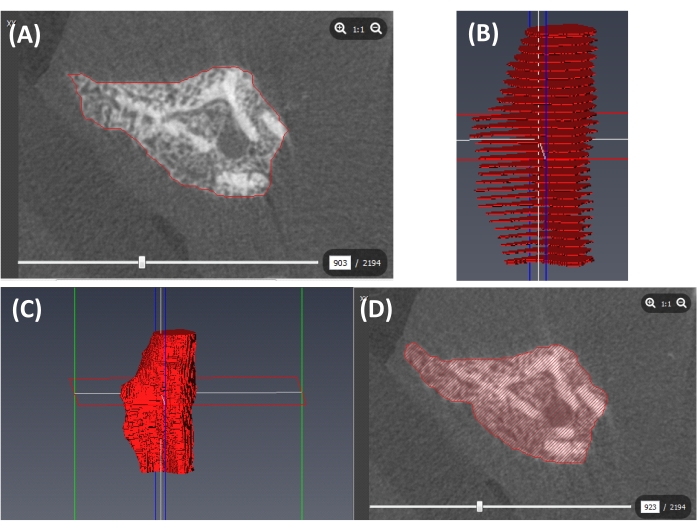
Figure 3: Segmentation of the callus outer boundary. (A) A contour of the outer boundary of the callus (red line). (B) Contours at slices sampled across the VOI (red slices). (C) A 3D callus label created by interpolation (red volume). (D) A cross-section of the callus label shown in C (including cortical bone). Please click here to view a larger version of this figure.
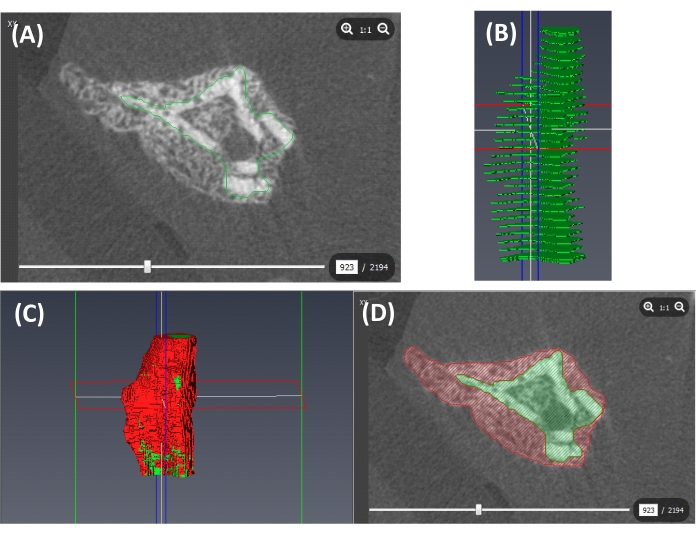
Figure 4: Segmentation of the cortical bone. (A) A contour of the periosteal surface of the cortex (green line). (B) Contours at slices sampled across the VOI (green slices). (C) A 3D label of the cortical bone (containing the medullary cavity; green) and the callus (red) created from interpolated labels of the periosteal cortex and the callus. (D) A cross-section of the callus (red) and the cortical bone (containing the intramedullary cavity; green). Please click here to view a larger version of this figure.
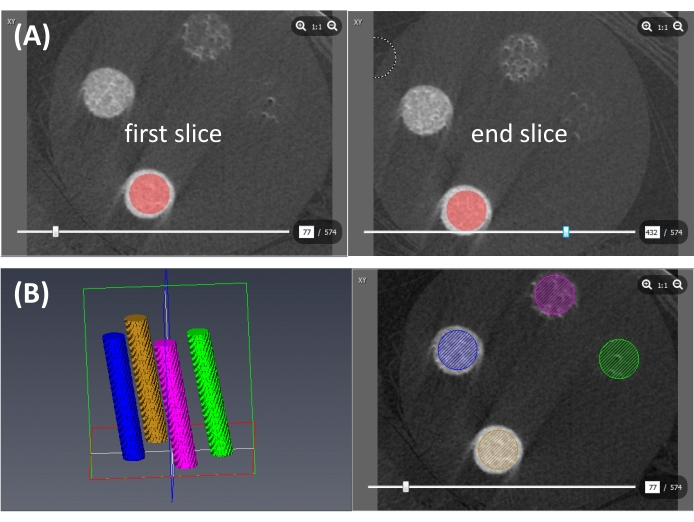
Figure 5: Conversion of gray-scale units to BMD. (A) Contours of the HA cylinder at the first and the last slices (red circles). (B) 3D interpolated HA cylinders (left) and cross-sections (right). Brown: highest HA density; blue: second highest HA density; violet: third highest HA density; green: fourth highest HA density. Please click here to view a larger version of this figure.
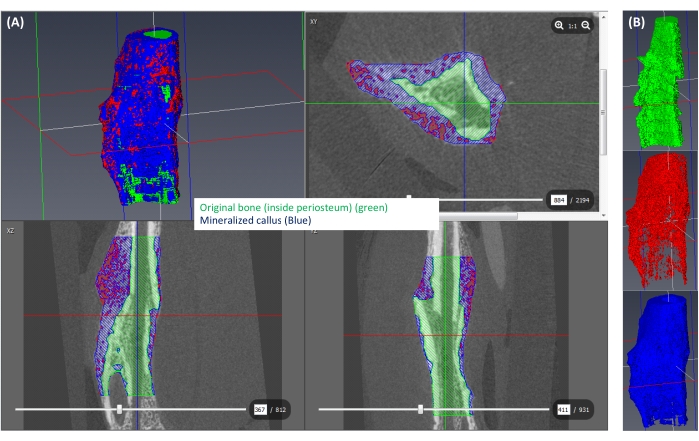
Figure 6: Segmentation of the mineralized callus. (A) The mineralized callus (≥250 mgHA/ccm) is shown in blue, the rest of the callus (<250 mgHA/ccm) is shown in red, and the space corresponding to the original bone is shown in green. (B) A 3D view of each isolated label. Please click here to view a larger version of this figure.
To monitor bone formation during fracture healing, a mid-diaphyseal open tibial fracture was induced in adult, male C75BL/6J mice. The fracture was stabilized using an intramedullary nail, an established model of secondary healing13. Callus tissues were harvested at days 14, 21, and 28 post-fracture12. These timepoints represent different phases of healing. Endochondral bone formation during secondary bone healing proceeds via initial formation of a fibro-cartilaginous (soft) callus, which mineralizes at later stages to reduce micromotion at the fracture gap, allowing the formation of new blood vessels across the fracture line13. Day 14 post-fracture in the murine fracture model used in this study represents the stage of mineralized soft callus. As healing proceeds from day 14 to day 21, the mineralized soft callus is completely replaced by newly formed woven bone, resulting in bony bridging of the fracture gap13. Between days 21 and 28, the callus undergoes resorption and remodeling to re-establish the characteristic structure of cortical bone12.
µCT images were acquired and analyzed at three timepoints using the protocol described above. A minimum of 10 samples were analyzed at each timepoint. For each sample, bone volume fraction and BMD were calculated. Bone volume fraction was calculated by dividing the volume of mineralized callus (BV) by the total callus volume (TV). Results demonstrated substantial formation of mineralized callus at day 14 (Figure 7A,B) and incremental increases in bone fraction volume and BMD as healing proceeded from day 14 to days 21 and 28 (Figure 7A,B), consistent with bony bridging of the fracture gap. As expected, the callus underwent resorption/remodeling between days 21 and 28 as evidenced by a decline in total callus volume (Figure 7A,B). Cortical bridging of the callus was more evident at day 28 than any preceding timepoint (Figure 7A). These results indicate that the provided µCT protocol allows monitoring of bone formation and callus structure during different phases of bone healing.
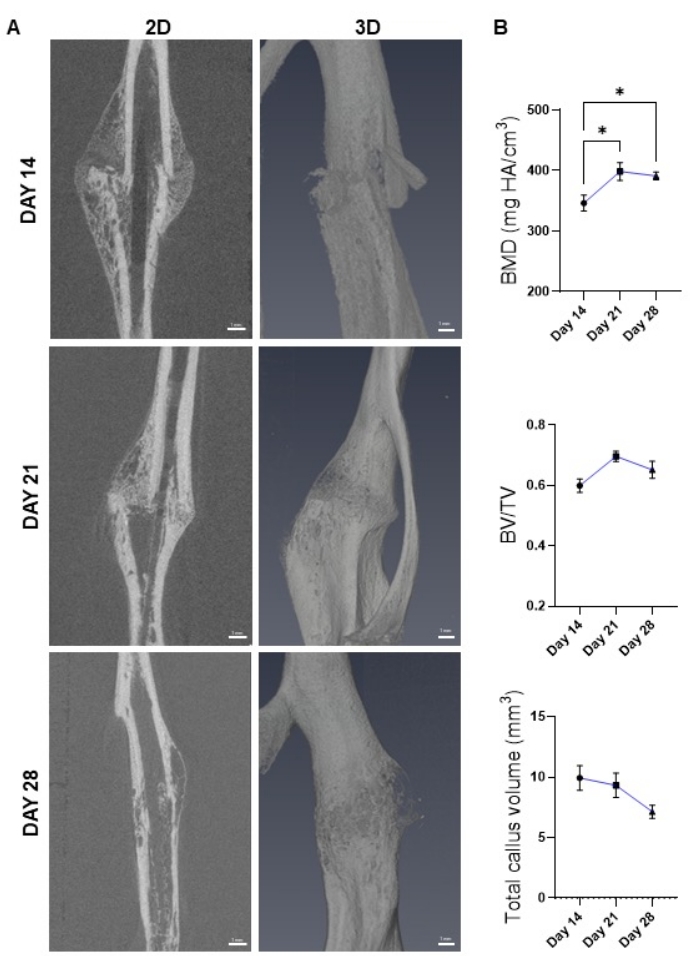
Figure 7: Monitoring bone healing using µCT. (A) 2D (sagittal, left panel) and 3D (right panel) images of the healing callus generated by µCT at the indicated post-fracture timepoints. (B) BMD, bone volume fraction (BV/TV), and total callus volume calculated from images shown in A. Results show healing progression through the late repair and remodeling phases. N = 10-12. The dots on the line plot represent average ± SEM. (*) p < 0.05 using one-way ANOVA followed by Tukey's post-hoc test. Please click here to view a larger version of this figure.
