Brain Tumor Stem Cell (BTSC) Migration Assay for Drug Treatment Studies: An In Vitro Live-cell Imaging Technique to Analyze the Effect of Drug Treatment on Migration of BTSCs

Published: April 30, 2023

Abstract

Source: Restall, I. et al. Live-Cell Imaging Assays to Study Glioblastoma Brain Tumor Stem Cell Migration and Invasion. J. Vis. Exp. (2018)

In this video, we perform brain tumor stem cell migration assay to analyze the effect of the drug of interest on the migration of live brain tumor stem cells using chemotaxis migration plate. Live-cell imaging facilitates the visualization and quantification of cell migration during the assay.

Protocol

1. Brain Tumor Stem Cell Migration Assay

  1. Seed 200,000 cells in a T25 flask in 8 mL of complete media 1–2 weeks before planning to perform a migration assay.
    NOTE: The time between plating and performing the assay will vary depending on the growth rate of the BTSC culture used.
    1. To test the effect of a drug treatment on migration, pretreat the cells with the appropriate vehicle, such as DMSO, and drug of interest by adding applicable volumes of the vehicle or drug stock directly into separate wells of media containing the cells.
  2. Prepare the chemotaxis migration plate (Figure 1A) by coating it with a thin layer of collagen.
    1. Calculate the number of wells of a 96-well chemotaxis plate that will need to be coated with collagen. Include at least three replicate wells for each condition.
    2. Dilute 5 mg/mL of stock of type I collagen to 0.2 mg/mL in pure acetic acid diluted to 0.14% in culture grade water.
    3. Pipette 0.2 mg/mL of collagen to both the membrane insert wells and the bottom reservoir wells that are being used.
      NOTE: The bottom reservoirs of the plate require 225 µL and the membrane insert wells require 75 µL of collagen for a proper coating.
    4. Place the migration plate in an incubator at 37 °C for 1 h. Aspirate the collagen solution from the wells without scratching the collagen coating.
    5. Wash the wells 2x with sterile 1x PBS. If the plate is not being used right away, aspirate the PBS and store it at 4 °C for up to 2 weeks. Prior to use, warm the chemotaxis migration plate to room temperature.
  3. Prepare the bottom reservoir of the chemotaxis migration plate.
    1. Pipette 225 µL of media (without growth factors), supplemented with 10% FBS as a chemoattractant, to the bottom reservoir wells of the chemotaxis migration plate.
    2. Gently place the membrane insert into the bottom reservoir at an angle to avoid creating bubbles.
  4. Plate the cells into the membrane insert of the chemotaxis migration plate.
    1. Resuspend dissociated BTSCs in media (without growth factors) at a cell density of 50,000 cells/mL. Add drugs to the media if assessing migration during different drug treatments. Alternately, seed equal numbers of pre-treated cells and control cells, while maintaining the final drug concentration when plating.
    2. Plate 50 µL of the BTSCs from step 1.4.1 into each well of the migration plate under the desired treatment conditions.
  5. Image the chemotaxis migration.
    1. Place the chemotaxis migration plate into the live-cell imaging system and set the automated imaging software to acquire microscopic images of the plate every 1–2 h for up to 72 h. Using commercial software (see Table of Materials), right-click on the timeline and set the scan interval to every 2 h for 24 h.
      NOTE: The time interval and total elapsed time will vary between BTSC cultures used; start with 2 h intervals for 72 h until experience has been gained with individual BTSC cultures. If an automated imaging system is unavailable, then images of the same field of view can be acquired manually with a microscope and a camera connected to the imaging software.
    2. Once the image acquisition is complete, obtain the images for the entire experiment and create a processing definition using the analysis software that differentiates cells from the background of the membrane and the migration pores (Figure 1B, red mask). Using commercial software (see Table of Materials), select a New Processing Definition and set the processing definition settings for BTSCs to a seed threshold of 52, a grow threshold of 85, adjustments of the size (pixels) by -1, and a minimum area of 200 μm2. Apply this processing definition to the bottom side of the membrane. Modify this analysis if it does not accurately distinguish cells from the background membrane.
    3. Collect data as the cell surface area on the bottom side of the membrane for each of the three replicate wells, which only counts the cells that have migrated through the pores. Graph the migration of the cells in μm2 (area of cells migrated) over time (Figure 1C).
      NOTE: Ensure that the relative number of cells plated and counted on the top surface of the membrane at the first time-point are similar (less than 20% variation across all wells) between all treatment conditions to avoid any effects of uneven plating. Data collection using the commercial software (see Table of Materials) can be executed by launching the processing definition created in step 1.5.2, clicking on Metrics, then on Graph/export, and then on Data export.

Representative Results

Figure 1
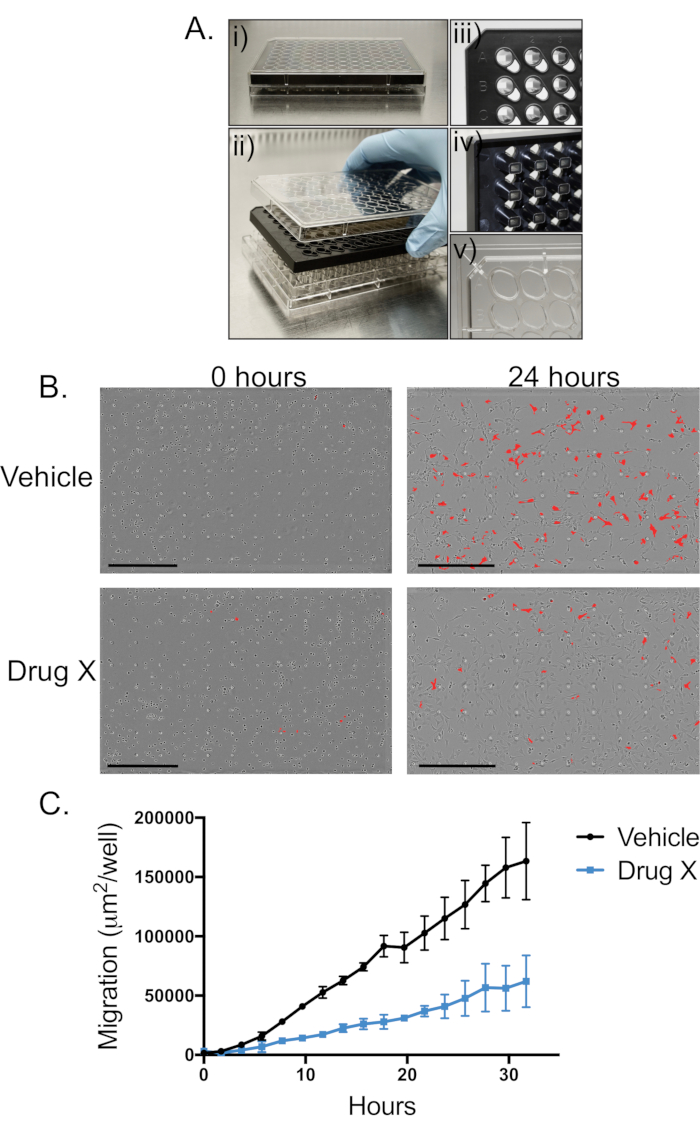
Figure 1: Live-cell imaging of a BTSC migration. (A) This is an example of a 96-well chemotaxis migration plate coated with a thin layer of type I collagen prior to performing the migration assay with BTSCs. The images show i) a plate with all three parts (lid, membrane insert, and reservoir) placed together, ii) all three parts separated, iii) a close-up image of the top view of the membrane insert, iv) a close-up image of the bottom view of the membrane insert, and v) a close-up image of the bottom reservoir. (B) These are representative images of a BTSC migration at the start (0 h) of the experiment and at 24 h. The image focus is on the top of the membrane insert where the cells were originally plated. Cells that have migrated to the bottom of the chemotaxis migration plate are highlighted in red. At 0 h, a few cells have migrated to the bottom side of the membrane. After 24 h, the number of migrated cells has increased dramatically. The comparison of the images at 24 h for cells treated with a vehicle vs. drug X demonstrates that the drug treatment decreases BTSC migration. The scale bars represent 600 µm. (C) This panel shows the quantification of a BTSC migration following pre-treatment with a vehicle or drug X. The graph shows that the drug treatment has a strong effect on the migration of BTSCs. The data points are the mean of three technical replicate wells, and the error bars represent standard deviation (SD).

Divulgations

The authors have nothing to disclose.

Materials

Matrigel matrix Corning 356230
96-well plates Eppendorf 30730119
T25 Nunc EasYFlask ThermoFisher 156367
Falcon 15 mL conical tube ThermoFisher 352096
Incucyte ClearView 96-Well Chemotaxis plate Essen Bioscience 4582
IncuCyte Zoom Live-Cell Analysis System Essen Bioscience 4545
IncuCyte Zoom Live-Cell Analysis Software Essen Bioscience 2016A Rev1
Phosphate buffered saline (PBS) Sigma D8537
Culture grade water Lonza BioWhittaker 17-724Q
Fetal bovine serum (FBS) Invitrogen 12483-020
Rat Collagen I Trevigen 3440-100-01
Accumax cell detachment solution Innovative Cell Technologies AM105

Tags

Play Video

Citer Cet Article
Brain Tumor Stem Cell (BTSC) Migration Assay for Drug Treatment Studies: An In Vitro Live-cell Imaging Technique to Analyze the Effect of Drug Treatment on Migration of BTSCs. J. Vis. Exp. (Pending Publication), e20678, doi: (2023).

View Video