1. Aggregate preparation for measurement of tissue surface tension.
For adherent cells, spheroids can be formed by using either the hanging drop method or by generating a coherent sheet of cells that can then be cut into 1 mm fragments.
Aggregate formation by the hanging drop method:
- Near-confluent adherent cell cultures should be grown to 90% confluence, whereupon monolayers should be rinsed twice with PBS. After draining well, add 2 mls (for 100 mm plates) of 0.05% trypsin-1 mM EDTA, and incubate at 37°C until cells detach. Stop trypsinization by adding 2 mls of complete medium and gently use a 5 ml pipette to triturate the mixture until cells are in suspension. Transfer cells to a 15 ml conical tube.
- Add 40 μl of a 10 mg/ml DNAse stock solution and incubate for 5 minutes at RT. Vortex briefly and centrifuge at 200 x g for 5 minutes.
- Discard supernatant and wash pellet with 1 ml complete tissue culture medium. Repeat, then resuspend cells in 2 mls of complete tissue culture medium.
- Count the cells using a hemacytometer, or automated cell counter and adjust concentration to 2.5 x 10⁶ cells/ml.
- Remove the lid from a 60 mm tissue culture dish and place 5 mls of PBS in the bottom of the dish. This will act as a hydration chamber.
- Invert the lid and use a 20 μl pipette to deposit 10 μl drops onto the bottom of the lid. Make sure that drops are placed sufficiently apart so as to not touch. It is possible to place at least 20 drops per dish.
- Invert the lid onto the PBS-filled bottom chamber and incubate at 37°C/5% CO2/95% humidity, monitor the drops daily and incubate until either cell sheets or aggregates have formed.
- Once sheets form, they can be transferred to round-bottom glass shaker flasks containing 3 mls of complete medium and incubated in a shaking water bath at 37°C and 5% CO2 until spheroids form.
Aggregate formation by the cell sheet method:
- Single cell suspensions are prepared as described above but concentration is adjusted to 1×10⁶ cells/ml.
- Transfer 3 ml of the cell suspension to 10 ml round-bottom flasks (Belco, Vineland, NJ).
- Incubate flasks in a gyratory water bath/shaker (New Brunswick Scientific, Edison, NJ) at 37°C, 5% CO2 for 4h at 120 rpm until cells recover from trypsinization.
- Transfer cells to a glass round-bottom centrifuge tube and centrifuge at 200 X g into a thin pellet. Incubate for another 24 h until a coherent sheet forms.
- Gently swirl the culture tube to dislodge the sheet and pour the contents of the culture tube into a small, sterile glass tissue culture dish.
- Use micro scalpels to cut the sheets into fragments of various sizes.
- Incubate fragments at 37°C on the gyratory waterbath shaker at 120 rpm under 5% CO2 for 2 to 3 days or until they become spherical.
2. Measurement of aggregate surface tension
- The tissue surface tensiometer. The apparatus is shown in Figs. 1 and 2. The compression cell (Fig. 3) is composed of two chambers. The outer chamber (OC) is connected to a 37°C circulating water pump, and serves to regulate the temperature of the inner chamber (IC). The chambers are constructed of milled Delrin and contain quartz windows for visualization of the aggregate. The lower assembly (LA) screws into the base of the inner chamber and is used to 1) position the aggregate in the inner chamber; 2) seal the bottom of the inner chamber; 3) elevate the aggregate to initiate compression; and (4) control the distance between the parallel plates and hence the compression of the aggregate. The central core (CC) of the assembly is adjustable. The tip of the central core (the pedestal) is composed of smooth Teflon and acts as the lower compression plate (LCP). The upper compression plate (UCP) is a Teflon cylinder 15mm long that hangs from the balance arm (B) by a flame-straightened nickel-chromium wire (NCW)*. During the course of an experiment, the cell aggregate (A) is positioned on the lower plate and raised until it contacts the upper plate. The upper plate is connected to the balance arm (B). Compression of the aggregate causes displacement of the balance arm. The balance is a Cahn/Ventron model 2000 recording electrobalance, which operates on the null balance principle. The fulcrum of the balance arm has an armature within a permanent magnetic field. When the balance is operating, it continuously modulates the current passing through the electromagnetic assembly, which in turn maintains the balance arm in the horizontal position. When an object is suspended from the balance arm, the voltage, which the balance applies to keep the arm in the horizontal position, is proportional to the object’s weigh. This voltage measures the external compressive force applied to the aggregate. The aggregate’s shape is monitored by visual observation through a 25 x Nikon SMZ10A stereoscope coupled to a computer equipped with a frame grabber. In order to minimize adhesion of cell aggregates to the compression plates, both the lower and upper compression plates were coated with poly (2-hydroxyethylmethacrylate) {poly(HEMA)}, a polymeric material to which cells do not adhere 16.
* The wire is flame-straightened by hanging a 15-inch length of wire from a retort stand and clamping a small binder clip to the end. A Bunsen burner is then run up and down the length of the wire until the wire glows red. The straightened wire can then be cut into the appropriate lengths. A small hook is formed by bending the wire approximately ¼ of an inch from the end using two razor blades. The other end is then inserted into the barrel of the lower compression plate. - Aggregate compression.
- The inner chamber is filled with pre-warmed CO2-independent tissue culture medium (Gibco/BRL, NY).
- Aggregates ranging in size from about 200-300 μ are positioned on the lower compression plate (Fig. 4A). Aggregates are loaded by aspirating an aggregate in tissue culture medium half-way up the tip of a Pasteur pipette fitted with a silicone bulb, transferring the pipette to the inner chamber, and positioning the tip of the pipette above the LCP. The aggregate is then gently expelled onto the LCP by gently squeezing the bulb. Alternatively, the aggregate is allowed to fall by gravity onto the LCP.
- The upper compression plate (UCP) is positioned above the aggregate and allowed to settle, establishing a pre-compression apparent UCP weight baseline.
- The LCP is then raised until the aggregate is compressed against the UCP (Fig. 4B). Adjusting the height of the inner core of the lower apparatus will control different degrees of compression. Compression is monitored by observation through a dissecting microscope equipped with a CCD video camera.
- Aggregate images are captured, digitized, and analyzed using ImageJ. Apparent UCP weight change is continuously recorded on a strip chart recorder, achievement of shape equilibrium being denoted by the leveling-off of the Cahn balance’s voltage output. Each aggregate is subjected to 2 different degrees of compression.
- Calculation of aggregate surface tension.
At shape equilibrium, the cohesivity of an aggregate of cells compressed between parallel plates to which it does not adhere can be obtained from the Young-Laplace equation (Fig. 5), where σ is cohesivity, F is the force acting to compress the aggregate, πr32 is the area of the surface of the aggregate upon which force F is exerted, and R2 and R3 are, respectively, the radius of the equator of the compressed aggregate and the radius of an arc defining its surface profile normal to the compressing plates and extending between them (Fig. 6). Measuring the compressive force and geometry at force and shape equilibrium and applying these measurements to the Young-Laplace equation generates numerical values of apparent tissue surface tension. Upon reaching equilibrium and calculation of σ1, aggregates are decompressed and allowed to approach a second equilibrium and σ2 is calculated as described above. - Confirmation of aggregate liquidity.
The calculated surface tension of a liquid aggregate, when subjected to two different compressions will remain constant. In such aggregates the ratio of σ2/σ1 will be equal to 1 and will be less than the ratio of the force applied at each successive compression (F2/F1). In contrast, the calculated surface tension of an elastic aggregate will obey Hooke’s law and increase proportionately to the applied force. For elastic aggregates the ratio of σ2/σ1 will not be equal to 1 but will instead approach the ratio of F2/F1. The surface tension of liquid aggregates will also be independent of aggregate size 2,17. Only measurements in which surface tension is independent of the applied force and size are used to calculate average σ for each cell line.
3. Representative results:
Below is a table of typical TST results for aggregates of rat prostate fibroblasts (RPF) and rat prostate smooth muscle cells (RPSMC). As can be seen in Fig. 7 aggregates of RPF cells have a surface tension of 22.8 ± 1.1 dynes/cm. Moreover, the mean surface tension values measured after compression 1 and after compression 2 were statistically identical when compared by a paired t-test. We also compared the ratios of σ2/σ1 and F2/F1 to ensure that these aggregates did not obey Hooke’s law, as they would if they behaved as elastic solids. As demonstrated in Table 1, the ratio of σ2/σ1 does indeed approach 1.0. Moreover, the ratio of F2/F1 was significantly greater than σ2/σ1 (paired t-test, P < 0.05), further confirming that these aggregates do not obey Hooke’s law and in fact behave as liquids. In contrast RPSMCs obeyed Hooke’s law. As is evident in Table 1, the ratio of σ2/σ1 is significantly greater than 1 and was not statistically different than that of F2/F1. To further demonstrate liquid-like behavior, we explored the relationship between surface tension (σ) and aggregate volume. As can be seen in Fig. 8, volume is independent of sigma for RPF cells (red regression line, r2 = 0.002), whereas there appears to be some dependence of sigma on volume for RPSMCs (blue regression line, r2 = 0.146). These data further confirm that RPF aggregates behave in a liquid-like manner, whereas those of RPSMCs appear to behave more as elastic solids. Only those mesurements obtained from aggregates behaving as liquids would be used to calculate surface tension.
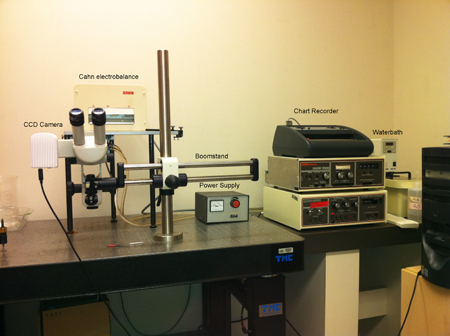
Figure 1. Overview of the tissue surface tensiometer.
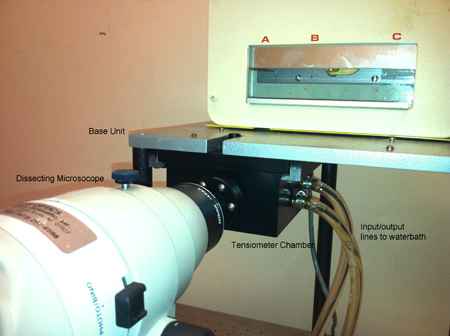
Figure 2. A more detailed view of the tensiometer chamber (right panel).
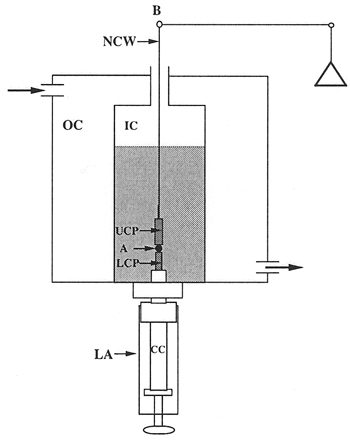
Figure 3. Schematic view of the tensiometer chamber.
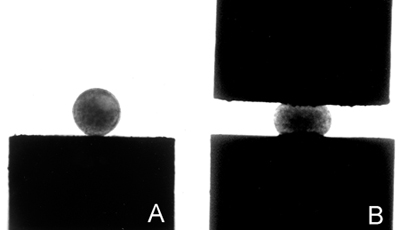
Figure 4. Images of uncompressed (A) and compressed (B) aggregates.
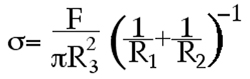
Figure 5. The Laplace Equation.
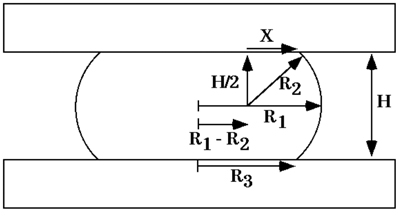
Figure 6. Diagram of a liquid droplet compressed between two parallel plates to which it adheres poorly, at shape equilibrium. R1 and R2 are the two primary radii of curvature, at the droplet’s equator and in a plane through its axis of symmetry, respectively. R3 is the radius of the droplet’s circular area of contact with either compression plate. H is the distance between upper and lower compression plates. X is one side of a right-angled triangle with hypotenuse R2 extending to a point of contact between the droplet’s surface and either compression plate.
| σ1(dynes/cm ± SEM) | σ2(dynes/cm ± SEM) | Pσ1 vs σ2 | σ1,2(dynes/cm ± SEM) | σ2/σ1 | F2/F1 | Pσ2/σ1 and F2F1 | |
| RPF | 22.6 ± 1.7 | 22.9 ± 1.4 | > 0.05* | 22.8 ± 1.1 | 1.04 ± 0.04 | 1.47 ± 0.06 | < 0.05 |
| RPSMC | 15.0 ± 2.8 | 23.0 ± 3.2 | 0.039 | NA | 1.9 ± 0.3 | 1.6 ± 0.1 | 0.16* |
Figure 7. TST measurements and confirmation of aggregate liquidity for aggregates of rat prostate fibroblasts and smooth muscle cells.
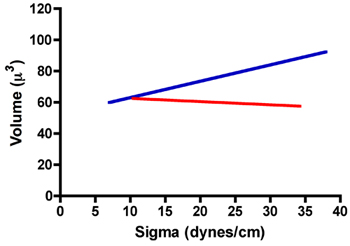
Figure 8. Relationship between sigma and volume for aggregates of RPF (red line) and RPSMCs (blue line).
