1. Heart removal and Langendorff perfusion
Sheep weighing 35-40 Kg are anesthetized using 4-6 mg/Kg propofol and 60-100 mg/Kg of sodium pentobarbital. Hearts are removed via thoracotomy and connected to a Langendorff-perfusion system with circulating oxygenated (95% O2, 5% CO2) Tyrode’s solution at a constant flow rate of 240-270 ml/min, pH 7.4 and 35.5-37.5 °C. The Tyrode’s composition (in mM) is: NaCl 130, KCl 4.0, MgCl2 1, CaCl2 1.8, NaHCO3 24, NaH2PO4 1.2, Glucose 5.6, and Albumin 0.04 g /L. Blebbistatin 10 μM (Enzo Life Science International, INC. Plymouth Meeting, PA, USA) is used to reduce the contractile force.
2. Stretch-induced atrial fibrillation in the Langendorff-perfused sheep heart
The isolated, coronary perfused heart undergoes an atrial trans-septal puncture to enable equalized intracavitary pressure in both atria. All vein orifices are then sealed, except the inferior vena cava, which is cannulated and connected to a digital sensor (Biopac Systems transducer-TSD104A; Biopac Systems, Inc., Goleta, CA, USA) and to an outflow cannula whose open-ended height above the atria controls the intra-atrial pressure. The pressure is then increased to 12 cm H2O, which leads to a ~30% increase in atrial volume relative to the volume at 6 cm H2O. The pressure is maintained stable throughout the experiment. Prior to sealing the veins tetrapolar electrode catheters (Torq, Medtronic Inc./Minneapolis/MN/USA) are placed in each of the pulmonary veins to record bipolar signals from the two distal electrodes (sampling rate, 1.0 kHz) using a Biopac Systems amplifier (DA100C; Biopac Systems, Inc., Goleta, CA, USA). Two additional custum-made bipolar electrodes are placed on the roof of left atrial appendage (LAA) and the top of right atrial appendage.
3. Optical mapping set up
- Epicardial mapping of the left atrial appendage. A bolus injection of 5 to 10 ml Di-4-ANEPPS (10 mg/mL) (Sigma-Aldrich, St. Louis, MO, USA) and a loading period of 10 min are needed to obtained voltage-sensitive fluorescence upon laser excitation (532 nm) of the epicardial surface. The emitted fluorescence is then transmitted through a 600 nm long pass filter and projected onto LittleJoe CCD video camera (80×80 pixels, SciMeasure Analytical Systems, Inc. Decatur, GA, USA) and acquired at a rate of 800 frames per second (See schematic representation on Figure 1A). Five-second movies are obtained at 2 min intervals during AF. The area of the mapped epicardial surface is ~14 cm2.
- Endocardial optical mapping of the PLA of the intact heart. A second LittleJoe CCD camera (80×80 pixels) is synchronized with the epicardial camera. A 10 mm diameter dual-channel rigid borescope (Everest VIT, Inc. Flanders, NJ, USA) with a 90-degree field of view is introduced through the anterior wall of the left ventricle, across the mitral valve and focused on the endocardial surface of the PLA. The optically mapped area on the PLA is ~4 cm2, which allows visualizing the four pulmonary veins and the atrial septo-pulmonary bundle (Figure 1A, B). The borescope is c-mounted to the CCD camera through a custom-made eyepiece adapter. Laser 532 nm light is then delivered to the excitation channel of the borescope through a liquid light-guide (0.2 in core).
4. Atrial fibrillation protocol
Under continuous atrial stretch AF is induced via burst pacing (12 Hz, 5 ms pulses, 2x diastolic threshold) by a pacing electrode located on top of the LAA. AF is allowed to continue for 50 minutes and 5-sec optical movies are acquired at two min intervals. Bipolar recordings are collected continuously. Acquisition of the optical movies triggers simultaneous acquisition of 5-sec segments of the bipolar recordings.
5. Frequency analysis
Frequency analysis allows identification of regions with high activation rate during AF, along with frequency gradients between left and right atrium. Dominant frequency (DF) maps are obtained from each optical movie after applying a fast Fourier transform algorithm (FFT) to the time-series fluorescence signal recorded at each pixel.7 FFT is also applied to the 5 second bipolar signals (High-pass filtered at 3 Hz and low-pass filtered at 35 Hz) synchronized with the optical movies.
6. Atrial fibrillation dynamics
- Generation of phase maps. Analysis of AF dynamics takes advantage of phase movies generated via Hilbert transformation.14 Briefly, the instantaneous phase of the action potential recorded at each pixel is determined by transforming the original time-series signals such that every spectral component is shifted by its corresponding quarter cycle.15 Afterwards, the instantaneous phase of the signal is obtained from the inverse tangent of the ratio of the transformed signal to the original signal. The phase angle, with values between -π and π radians is represented as a continuous color scheme to construct a phase map, in which the continuous spatial phase change reflects the process of excitation, repolarization and recovery.14
- Characterization of activation patterns. Various classes of activation patterns can be identified using phase movies (Figure 2), including the following:
- A rotor is identified by the presence of all phases converging on a singularity point lasting more than one rotation (Figure 2A).
- A breakthrough is defined as a wavefront appearing in the field of view and propagating outward (Figure 2B) in a target-like pattern.
- Spatiotemporally organized periodic waves are defined as a minimum of four sequential periodic waves emerging from the same location in the field of view, with similar direction and inter-wave interval (Figure 2C).
Further quantification allows spatial correlation of highest frequency domains with the most common pattern of activation obtained from that particular region. The latter highlights the crucial role of mapping the endocardial surface of the PLA, since it commonly represents the region where the highest frequency domains are located during acute AF.
7. Representative Results:
Dominant frequency (DF) gradients from PLA to LAA and RAA are present during acute stretch-induced AF. The highest DF region is localized either at or near one of the pulmonary veins or somewhere in the PLA.11 A representative AF episode is shown in Figure 3, in which the highest DF is localized on the PLA (Right inferior pulmonary vein). The results support the presence of high frequency sources in the PLA driving AF consistent with the left to right DF gradients observed during ablative procedures in paroxysmal human AF.16
Quantification of patterns of activation using phase map movies shows that the highest number of rotors is found at the PLA and the junction between the PLA and the LAA.8 Occasionally it is possible to identify long-lasting rotors whose center of rotation (Singularity point) localizes with the highest frequency domain.10 Since atrial tissue represents a three-dimensional structure, identifying rotors on the mapped endocardial surface of the PLA suggests that the center of rotation of those rotors (filament) is eventually perpendicular to the surface of the mapping area. Figure 4 shows such a rotor recorded from the endocardium of the PLA with simultaneous fibrillatory conduction toward the LAA, which also correlates with a frequency gradient between the PLA and the LAA (9 and 6.4 Hz respectively). The number of rotors is consistently higher at the PLA than the LAA, which suggests an essential role of reentry on the PLA to maintain the arrhythmia in this model.
Overall, the results support the theory that stable and fast rotors in the left atrium may drive acute stretch-induced AF and emanating waves undergo complex, spatially distributed conduction block patterns as they head toward the right atrium, manifesting as fibrillatory conduction and progressively decreasing dominant frequency.
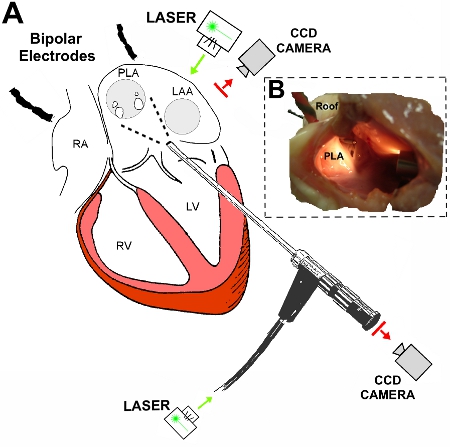
Figure 1. Diagrammatic representation of the experimental set up. A: A rigid borescope is introduced through the anterior wall of the left ventricle and the mitral valve orifice and focused on the endocardial surface of the posterior left atrium (PLA). A CCD camera is coupled to the borescope and laser illumination is provided through a laser liquid guide connected to the inferior part of the borescope. Epicardial mapping is performed on the LAA. Bipolar electrodes are placed on right atrium and roof of the left atrium. Additional bipolar signals are obtained from the pulmonary veins. B: Lateral view of the left atrium following opening the lateral wall for illustration purposes. The tip of the borescope illuminates the endocardial surface of the PLA. A bipolar electrode is located on the roof of the left atrium. LAA: left atrial appendage. LV: left ventricle. RA: right atrium. RV: right ventricle.
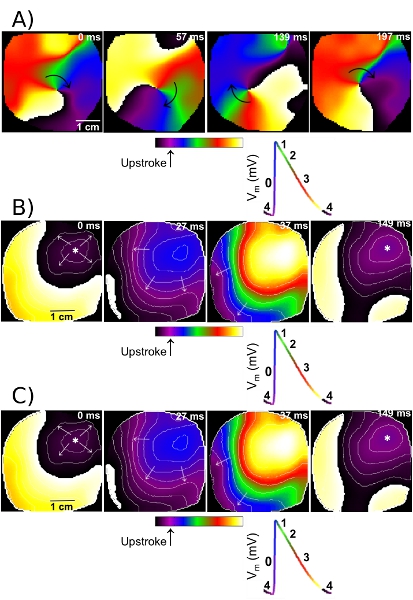
Figure 2.Different patterns of activation identified after the generation of phase movies. A: Sequential snap shots of the left atrial appendage (LAA) show the pivoting of a rotor around its center of rotation (Singularity point). From left to right, one full rotation is completed. B: A sample breakthrough activation pattern on the LAA. The wave appears on the upper right corner of the field of view and propagates outward. C: Four spatiotemporally organized periodic waves (At 0, 182, 352 and 512 ms, respectively) coming from the PLA region toward the LAA. Isochrones are plotted at 10 ms intervals. Bottom, key for the different phases of the action potential is color-coded.
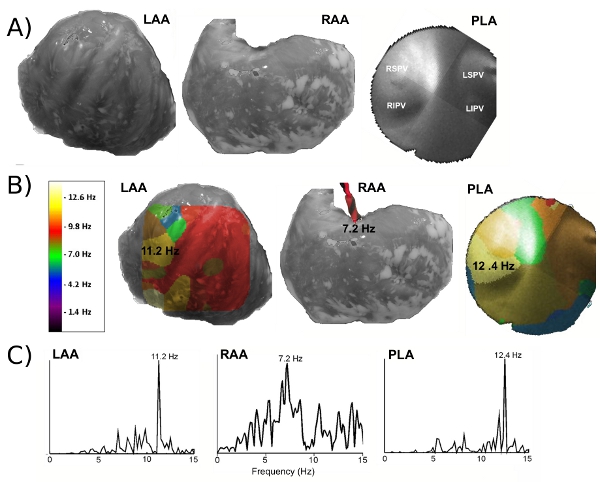
Figure 3. Identification of the regions with the highest frequency activity during acute stretch-induced AF in a Langendorff-perfused isolated sheep heart. A: Anatomical view of the left atrial appendage (LAA), right atrial appendage (RAA) and posterior left atrium (PLA). PLA image is an endoscopic view of the mapped region with the four pulmonary veins (PVs). B: DF maps obtained by optical mapping on the LAA and PLA. Frequency value in the RAA was obtained from bipolar electrograms. The highest frequency region is located in the PLA. C: Representative power spectra, in which the maximum DF corresponds to 12.4 Hz at the PLA region of the right PVs. LSPV: left superior pulmonary vein. LIPV: left inferior pulmonary vein. RSPV: right superior pulmonary vein. RIPV: right inferior pulmonary vein. Reproduced from reference 11 (David Filgueiras Rama & José Jalife. Mechanisms Underlying Atrial Fibrillation. in Basic Science for Clinical Electrophysiologist, Vol. 3 (ed. Charles Antzelevitch) 141-156 (SAUNDERS, 2011).
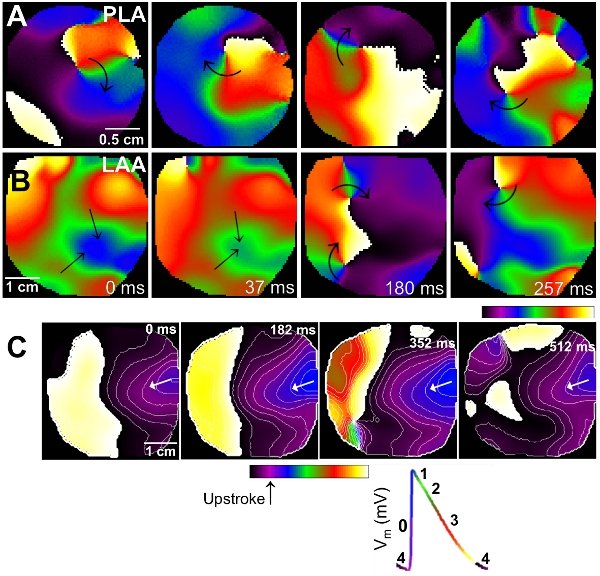
Figure 4. Simultaneousphase maps (A, B) and dominant frequency maps (C) from posterior left atrium (PLA) and left atrial appendage (LAA). A: Sequential snap shots from the PLA showing a rotor and the drifting of its singularity point. B: Simultaneous phase snap shots from the LAA. Patterns of activation show propagation waves compatible with fibrillatory conduction. Singularity points are also present in correlation with wavebreaks in the fibrillatory conduction region. (See also video 4) C: Simultaneous dominant frequency maps from the PLA and the LAA. The fastest region is located at the PLA (9 Hz), which correlates with the presence of a rotor in the phase map analysis. The highest frequency at the LAA is 6 Hz, which correlates with fibrillatory conduction. On the right side of panel C, single pixel optical activations from PLA and LAA are shown.
