Here we present techniques for imaging local IP3-mediated Ca2+ events using fluorescence microscopy in intact mammalian cells loaded with Ca2+ indicators together with an algorithm that automates identification and analysis of these events.
Cytosolic Ca2+ ions regulate numerous aspects of cellular activity in almost all cell types, controlling processes as wide-ranging as gene transcription, electrical excitability and cell proliferation. The diversity and specificity of Ca2+ signaling derives from mechanisms by which Ca2+ signals are generated to act over different time and spatial scales, ranging from cell-wide oscillations and waves occurring over the periods of minutes to local transient Ca2+ microdomains (Ca2+ puffs) lasting milliseconds. Recent advances in electron multiplied CCD (EMCCD) cameras now allow for imaging of local Ca2+ signals with a 128 x 128 pixel spatial resolution at rates of >500 frames sec-1 (fps). This approach is highly parallel and enables the simultaneous monitoring of hundreds of channels or puff sites in a single experiment. However, the vast amounts of data generated (ca. 1 Gb per min) render visual identification and analysis of local Ca2+ events impracticable. Here we describe and demonstrate the procedures for the acquisition, detection, and analysis of local IP3-mediated Ca2+ signals in intact mammalian cells loaded with Ca2+ indicators using both wide-field epi-fluorescence (WF) and total internal reflection fluorescence (TIRF) microscopy. Furthermore, we describe an algorithm developed within the open-source software environment Python that automates the identification and analysis of these local Ca2+ signals. The algorithm localizes sites of Ca2+ release with sub-pixel resolution; allows user review of data; and outputs time sequences of fluorescence ratio signals together with amplitude and kinetic data in an Excel-compatible table.
Calcium ions (Ca2+) ubiquitously regulate a diverse range of biological processes, including gene expression, secretion and long-lasting changes in synaptic plasticity1. One way through which Ca2+ can act in such a diverse manner is through the different spatial and temporal patterns of Ca2+ signals a cell can generate. For example global elevations in cytosolic [Ca2+] trigger contraction in smooth muscle tissue2 whereas smaller, localized transient elevations (local Ca2+ microdomains) stimulate gene expression essential for learning and memory3.
Free cytosolic [Ca2+] is maintained at ~100 nM at rest, but can rapidly rise to several micro-molar following the influx of Ca2+ into the cytosol through Ca2+-permeable ion channels located in the plasma membrane and by the liberation of Ca2+ from intracellular stores. Our lab focuses on the inositol 1,4,5-trisphosphate receptor (IP3R), which forms a Ca2+ release channel located in the endoplasmic reticulum (ER) membrane. Upon binding of both IP3 and Ca2+ to the cytosolic activating sites of the receptor, the IP3R channel opens to liberate Ca2+ sequestered within the ER lumen. The release of Ca2+ may remain spatially restricted to a small cluster of IP3Rs to generate a local cytosolic microdomain of Ca2+ (Ca2+ puff4) or, depending on the proximity of neighboring clusters of IP3Rs, may propagate throughout a cell by recruiting multiple puff sites through a process of Ca2+-induced Ca2+-release (CICR)5,6.
The introduction of fluorescent small molecule Ca2+ indicator dyes developed by Roger Tsien7, coupled with advanced microscopy imaging techniques, has greatly facilitated our understanding of Ca2+ signaling. Recent advances in cameras used for microscopy now allow for imaging transient local Ca2+ events such as puffs with unprecedented spatial and temporal resolution. Currently available EMCCD cameras enable imaging with 128 x 128 pixels at >500 frames sec-1 (fps) and the new generation of complementary metal-oxide semiconductor (CMOS) cameras provide higher pixel resolution, and even faster speed at the expense of slightly higher noise levels. In conjunction with total internal reflection (TIRF) microscopy it is now possible to image single Ca2+ channel events8,9. This approach allows for the imaging of hundreds of channels/events simultaneously, while generating large data sets (ca. 1Gb per min) that render manual processing, visual identification and analysis impracticable and place an onus on the development of automated algorithms.
Here, we present procedures and protocols for imaging local Ca2+ signals in intact mammalian cells using fluorescent Ca2+ indicators. We further demonstrate an algorithm developed in the open-source environment Python that automates identification and analysis of local Ca2+ events imaged by both TIRF and conventional wide field epi-fluorescence (WF) microscopy. Although we describe these approaches in the context of IP3-generated Ca2+ signals, they are readily amenable to study local changes in cytosolic [Ca2+] emanating from a variety of Ca2+-permeable ion channels located in either the surface membrane or intracellular organelles8-10.
We present detailed procedures for imaging local Ca2+ events in human neuroblastoma SH-SY5Y cells. These procedures can be adapted to image intracellular Ca2+ signals in many cell types8-10.
1. Preparation of Cells
2. Preparation of Solutions and Reagents
3. Loading Cells with Membrane-permeant Cal-520, ci-IP3 and EGTA
4. Ca2+ Image Acquisition
5. Automated Ca2+ Image Analysis
NOTE: It is possible to view, process and analyze captured data using many commercial software packages. However, we have developed an algorithm to rapidly automate identification and analysis of local Ca2+ signals. A detailed description of the spatial and temporal filters used in this algorithm, generation of the ΔF/F0 and identification/analysis routines can be found in11. This algorithm has been developed to run on the open-source software platform Python, and can be obtained, together with sample experimental data and detailed user instructions, by e-mailing the corresponding author (ismith@uci.edu).
Figure 1A shows a WF image of resting Cal-520 fluorescence in human neuroblastoma SH-SY5Y cells also loaded with ci-IP3. Exposure of these cells to a 100 msec UV flash to photo-release i-IP3 elicited transient Ca2+ puffs at discrete sites (noted by the white circles in Figure 1A). Fluorescence traces measured at these sites showed a rapid rising phase owing to transient openings of IP3Rs, followed by a much slower falling phase (Figure 1B and 1C) as Ca2+ slowly diffused away from the release site. Red highlighted events in Figure 1B are Ca2+ signals that were determined by the algorithm to have originated from the selected site. Non-highlighted events represent contaminating Ca2+ signals diffusing from closely adjacent sites.
To achieve higher-resolution imaging of local Ca2+ signals, cells may be further loaded with the slow Ca2+ buffer EGTA. This chelates Ca2+ ions diffusing between puff sites and thus prevents the generation of global Ca2+ waves that would obfuscate the study of local Ca2+ puffs generated by individual clusters of IP3Rs. Furthermore, EGTA accelerates the collapse of the local Ca2+ microdomain but, owing to its slow binding kinetics, minimally perturbs local free Ca2+ and its binding to the fast Ca2+ indicator within a cluster. The net effect of EGTA is to ‘sharpen’ fluorescence records of puffs in space and time, without appreciably diminishing their amplitude. A further improvement in resolution arises by using TIRF to limit excitation of the Cal-520 fluorophores to the narrow (<100 nm) evanescent wave created by TIRF. The sum of both of these approaches is a technique that effectively monitors instantaneous Ca2+ release flux (Ca2+ current) rather than a leaky integral of Ca2+ after it is released through the IP3Rs and slowly diffuses away from the release site and is ultimately sequestered 9. Figure 1D shows the TIRF ‘footprint’ of an SH-SY5Y cell when Cal-520 fluorophores were only excited within a narrow distance into the cell from the coverglass/aqueous solution interface. Rapid binding of Ca2+ to the fast indicator Cal-520 dye within the attoliter cytosolic volumes created by TIRF illumination, in conjunction with EGTA to ‘mop’ up diffusive Ca2+, yields fluorescence signals that are sharpened in both time and space (Figure 1E and 1F).
The analysis of image stacks captured in this manner is greatly facilitated through a custom written algorithm developed in our lab running on the open-source software platform Python11. Figure 2A shows the opening dialog window in which the user enters parameters to be used for identification and subsequent analysis of image stacks. Following this, the user is prompted to select a black level to be subtracted from the entire image stack after which the identification and analysis algorithm runs. Figure 2C-F show, respectively, the subcellular sites of local Ca2+ release; activity at selected sites; individual events on an expanded timescale; and spatial profiles of representative events (see Figure 2 legend for details). Upon user review of identified sites, analyzed data for all events (see Table 1) can be exported by selecting the ‘Save to Excel’ function.
Figure 3 presents data illustrating both the improvement in resolution achieved by TIRF imaging in EGTA-loaded cells as compared to WF imaging in unloaded cells, and the power of the algorithm in identifying and analyzing local Ca2+ signals. Figure 3A shows a representative local event imaged by WF in a cell loaded only with Cal-520 and ci-IP3. For comparison, Figure 3B shows an analogous event but now imaged by TIRF microscopy in a cell further loaded with EGTA. Superimposed traces in Figure 3C and 3D, illustrate corresponding temporal (C) and spatial (D) profiles of events recorded by WF fluorescence without EGTA (black) and by TIRF microscopy with EGTA loading (red). Figure 3E plots mean measurements of puff amplitudes, decay times, and spatial width under these two conditions, determined using the algorithm to analyze approximately 44 (WF) and 88 (TIRF) events.
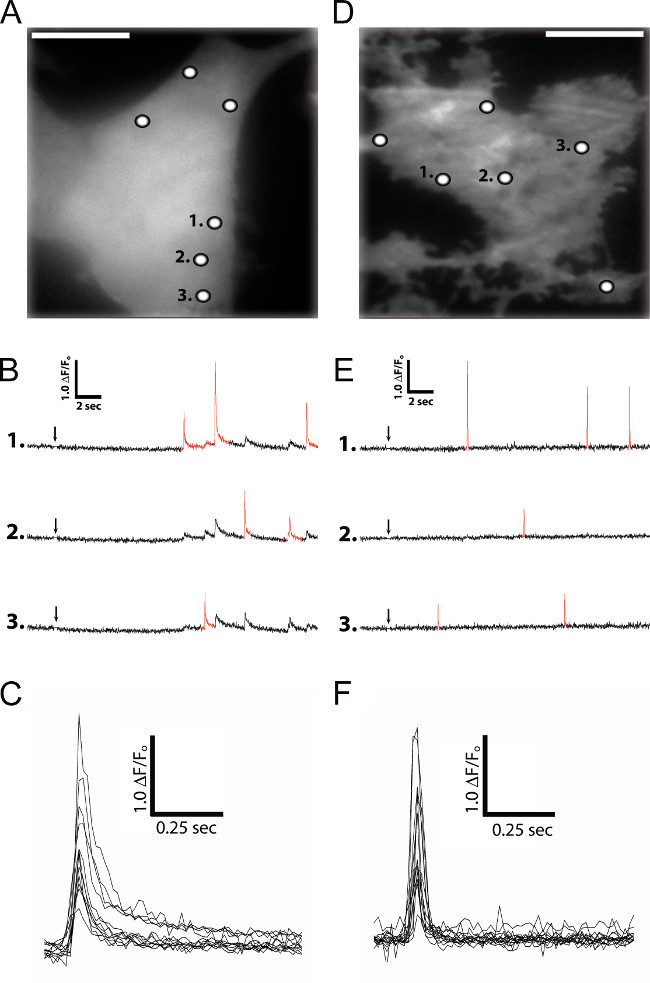
Figure 1: IP3-evoked local Ca2+ signals in SH-SY5Y cells loaded with Cal-520 and ci-IP3 imaged by wide-field (A through C) and TIRF (D through F) microscopy. (A) Monochrome image of resting Cal-520 fluorescence on which puff site locations are denoted by white circles; scale bar = 10 µm. (B) Traces illustrate puffs evoked at three different sites, numbered as in (A). Red highlighted events are puffs identified to have originated from that particular site. Arrow indicates time of UV flash. (C) Superimposed traces of representative Ca2+ puffs like those in (B), aligned and shown on an expanded scale. (D) Monochrome TIRF ‘footprint’ image of resting Cal-520 fluorescence in SH-SY5Y cells loaded with ci-IP3 and EGTA. White circles denote puff site origins. (E) Traces illustrate puffs evoked at three different sites numbered as in (D). (F) Superimposed traces of representative Ca2+ puffs like those in (E), aligned and shown on an expanded scale.
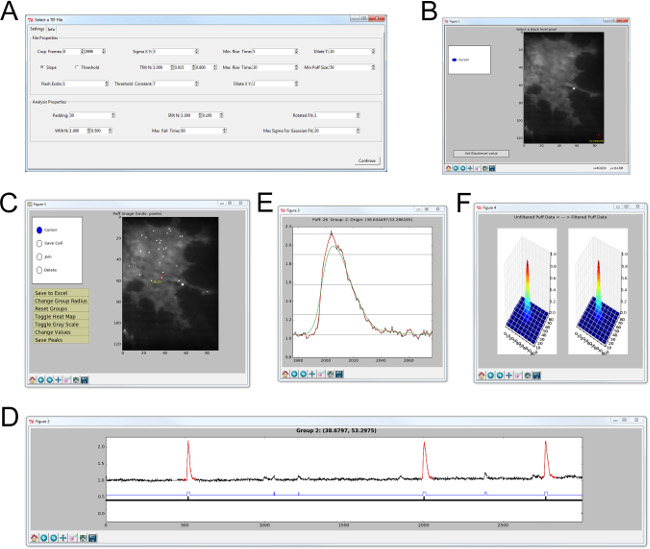
Figure 2: User interface of custom code designed to automatically identify and analyze local Ca2+ signals in SH-SY5Y cells imaged by TIRF microscopy. (A) Opening dialog box where identification and analysis parameters are entered. (B) The user selects a region of the image that contains no cells to define the black level that is subtracted from the all frames in the image stack. (C–F) Screenshots of the final/identification analysis windows. (C) Image of resting Cal-520 fluorescence on which are superimposed locations where Ca2+ transients were identified (white squares). The user can cycle between sites by moving the mouse over the image or pressing the cursor keys. (D) Window showing fluorescence ratio (ΔF/F0) trace at the selected event. Red-highlighted events are identified as having arisen at the site selected. The lower blue bar indicates events that exceed the threshold for detection at that site; events not highlighted red have been localized to an adjacent site. Clicking on the blue bar takes the user to that event site. Clicking on a red event with the mouse opens up two further windows showing the temporal evolution of the event on an expanded timescale (E) and spatial profiles (F) of the event averaged over its time course (left) together with the spatial profile of the fitted Gaussian (right). Please click here to view a larger version of this figure.
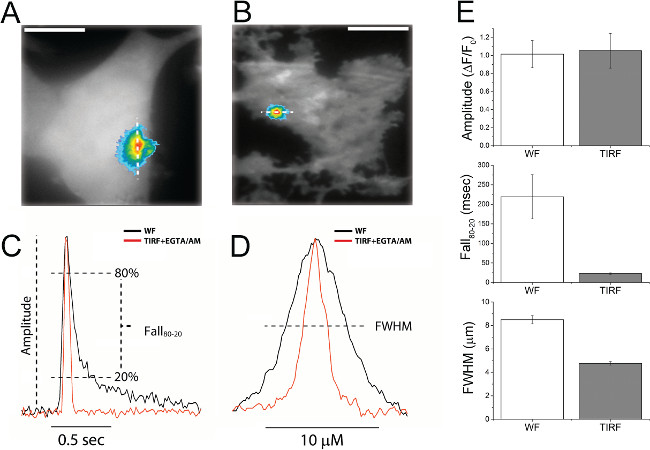
Figure 3: Improvement in temporal and spatial fidelity of puff imaging achieved by use of TIRF microscopy in conjunction with intracellular loading of EGTA. (A) snapshot image of a puff captured at time of peak amplitude, superimposed on a background image of resting fluorescence to show the cell outline. The image was obtained by WF microscopy of a cell not loaded with EGTA. The puff image is pseudocolored, with higher Ca2+ levels denoted by increasingly ‘warm’ colors. (B) Corresponding image of a puff imaged by TIRF microscopy in a cell loaded with EGTA. (C) Traces, WF (black) or TIRF + EGTA (red), show the corresponding change in Cal-520 fluorescence over time for the Ca2+ puffs shown in (A) and (B) above. Traces are normalized to the same peak amplitude and aligned to their peak time to facilitate comparison of their kinetics. Annotations illustrate measurements of Ca2+ event parameters (amplitude and fall time) quantified in (E). (D) Traces, WF (black) or TIRF+EGTA (red), show the fluorescence intensity of a line scan through the Ca2+ puffs shown in (A) and (B). Line scans are normalized to their peak amplitudes, and centered. The annotation shows measurement of full width at half maximal amplitude (FWHM), as quantified in (E). (E) Bar graphs showing mean peak amplitudes (top), fall times from 80% to 20% of peak amplitude (middle), and spatial width (FWHM) of puffs imaged by WF microscopy in cells without EGTA (open bars) and by TIRF microscopy in EGTA-loaded cells (grey bars). Data are presented as mean ± SEM with an n of at least 37 puffs for WF and 79 for TIRF. Please click here to view a larger version of this figure.
A. | Group # | Event site identity number |
B. | GroupX: | Mean sub-pixel x location of all events at a particular site |
C. | GroupY: | Mean sub-pixel y location of all events at a particular site |
D. | No. Events: | No. of events occurring at a site over the course of the experiment. |
E. | Max Amp: | Maximum amplitude of an event at that particular site (ΔF/F0) |
F. | X: | Sub-pixel x localization of event |
G. | Y: | Sub-pixel y localization of event |
H. | T_peak: | Time at which the event reaches peak amplitude (in frame number) |
I. | Amplitude: | Amplitude of all events originating from each site (ΔF/F0) |
J. | Sigmax: | X SD of Gaussian profile fitted to time course of event (in pixels) |
K. | Sigmay: | Y SD of Gaussian profile fitted to time course of event (in pixels) |
L. | Angle: | Angle of the long axis of the resulting elliptical function of Gaussian fitted to time course of event |
M. | R20: | Time to rise to 20% of max amplitude (in frames) |
N. | R50: | Time to rise to 50% of max amplitude (in frames) |
O. | R80: | Time to rise to 80% of max amplitude (in frames) |
P. | R100: | Time to rise to 100% of max amplitude (in frames) |
Q. | F80: | Time to Fall to 80% of max amplitude (in frames) |
R. | F50: | Time to Fall to 50% of max amplitude (in frames) |
S. | F20: | Time to Fall to 20% of max amplitude (in frames) |
T. | F0: | Time to return to pre-event baseline (in frames) |
Table 1: Output data from algorithm.
We describe here protocols for imaging local Ca2+ events in cultured mammalian cells using fluorescent Ca2+ indicators. Furthermore, we describe an algorithm with an intuitive user interface that automates identification and analysis of acquired data. The procedure described here utilize the fluorescent Ca2+ indicator Cal-520, but many other Ca2+ sensitive dyes such as Fluo-3, Fluo-4, Fluo-8 and Oregon Green BAPTA-1 perform sufficiently well to image Ca2+ microdomains. Care does need to be taken to ensure that the high affinity versions (Kd of ~200-400 nM) of these indicators are used to image local Ca2+ microdomains, and the optimal loading conditions of these indicators need to be determined empirically for each cell type under investigation. By their nature Ca2+ indicators bind Ca2+ and thus act as Ca2+ buffers; higher loading concentrations of indicators have the potential to interfere with Ca2+ signals being recorded and/or may be sequestered into intracellular organelles, although the loading conditions described here are a good starting point. Overall, imaging the activity of local Ca2+ events is minimally invasive, maintaining the native architecture of a cell and cytosolic factors that may regulate the channels that underlie Ca2+ microdomains.
The protocol we describe here for high-resolution imaging of local Ca2+ signals using TIRF microscopy has the obvious limitation in that it restricts measurements to events that arise from Ca2+ channels lying within the evanescent field. However, it is not restricted only to channels in the plasma membrane, and we demonstrate its applicability to channels such as the IP3R in intracellular organelles that have been found to be preferentially located close to the plasma membrane12 but would otherwise be inaccessible to electrophysiological recording of their activity in the native cellular environment. Confocal imaging would enable imaging of signals generated deeper into the cell, but has disadvantages as compared to TIRF imaging in that the thickness of the optical section is wider (~800 nm vs 100-200 nm) and is limited in temporal resolution by the need to scan the confocal spot(s). Because imaging is done in an epi-fluorescence mode using an inverted microscope, optical recordings of local and single-channel Ca2+ signals could readily be combined with simultaneous electrophysiological patch-clamp recording.
By expressing fluorescence Ca2+ signals as a ratio of resting fluorescence (ΔF/F0) it is possible to obtain a good relative measure of signal amplitudes. However, we caution that calibration of local, transient fluorescence changes in terms of absolute Ca2+ concentrations is not appropriate. The gradients of free [Ca2+] and Ca2+-bound indicator around a Ca2+ release channel or cluster of channels is narrower than can be resolved by optical microscopy and will thus be blurred by the point spread function of the microscope. Moreover, local [Ca2+] in the close vicinity of the channel pore will change on a microsecond timescale as the channel opens and closes. Thus, the fluorescence signals provide only a blurred (in space and time) representation of the true Ca2+ nanodomain underlying local Ca2+ signals13.
The algorithm described here greatly facilitates the analysis of local Ca2+ signals from camera based imaging. By automating identification and analysis not only is user bias eliminated, but gigabytes of image stacks can be processed within minutes in a highly parallel fashion, yielding both temporal and spatial data from multiple events from a single-cell simultaneously.
Although data in this manuscript are presented in the context of IP3-mediated Ca2+ signals, the approaches described can be readily extended to imaging local changes in cytosolic [Ca2+] emanating from numerous types of ligand-, second-messenger- and voltage-gated Ca2+-permeable ion channels. The high-throughput nature of the algorithm for automating identification and analysis of local Ca2+ events should also prove to be highly useful for imaging Ca2+ channelopathies in disease states via single-cell models such as Alzheimer’s disease and autism spectrum disorder.
The authors have nothing to disclose.
This work was supported by National Institutes of Health grants GM 100201 to I.F.S, and GM 048071 and GM 065830 to I.P.
Name | Company | Catalogue No. |
Human Neuroblastoma SH-SY5Y cells | ATCC | CRL-2266 |
Cal-520/AM | AAT Bioquest Inc. | 21130 |
ci-IP3 (D-23-O-Isopropylidene-6-O-(2-nitro-4.5-dimethoxy)benzyl-myo-Inositol 145-trisphosphate-Hexakis(propionoxymethyl) | SiChem | cag-iso-2-145-10 |
DMSO/20% pluronic F127 | Invitrogen | P-3000MP |
EGTA/AM | Invitrogen | E-1219 |
35 mm glass-bottom imaging dishes | MatTek | P35-1.5-14-C |