Tracking Drug-induced Changes in Receptor Post-internalization Trafficking by Colocalizational Analysis
Summary
Receptor trafficking modulates signaling and cell responsiveness to ligands and is, itself, responsive to cell conditions, including ligand-induced signaling. Here, we describe a powerful and flexible technique for quantitatively assessing drug-induced receptor trafficking using immunolabeling and colocalizational analysis.
Abstract
The intracellular trafficking of receptors is a collection of complex and highly controlled processes. Receptor trafficking modulates signaling and overall cell responsiveness to ligands and is, itself, influenced by intra- and extracellular conditions, including ligand-induced signaling. Optimized for use with monolayer-plated cultured cells, but extendable to free-floating tissue slices, this protocol uses immunolabelling and colocalizational analysis to track changes in intracellular receptor trafficking following both chronic/prolonged and acute interventions, including exogenous drug treatment. After drug treatment, cells are double-immunolabelled for the receptor and for markers for the intracellular compartments of interest. Sequential confocal microscopy is then used to capture two-channel photomicrographs of individual cells, which are subjected to computerized colocalizational analysis to yield quantitative colocalization scores. These scores are normalized to permit pooling of independent replicates prior to statistical analysis. Representative photomicrographs may also be processed to generate illustrative figures. Here, we describe a powerful and flexible technique for quantitatively assessing induced receptor trafficking.
Introduction
Receptors, especially G protein coupled receptors (GPCRs), are routinely trafficked intracellularly, to and from the cell surface1. These complexly orchestrated and tightly controlled processes dictate cells’ available receptor complements and regulate receptor temporal activity, desensitization, and resensitization2–4. Importantly, these processes are responsive to cellular environments including drug-induced receptor activity or inactivity. That is, the actions of ligands at receptors can alter intracellular trafficking of those receptors, thereby altering cell responsiveness. In this manner, external ligands exert yet more effects upon cell function, even beyond classical messenger-to-effector cascades5,6.
Examining such changes in induced receptor trafficking is difficult. All available techniques involve limitations. Biotin protection assays have been used to monitor surface receptors populations. These receptors are biotinylated and a timecourse of immunoprecipitations is performed to quantify the reduction in biotinylated receptors over time. This technique essentially monitors the gradual degradation of an initial, labeled, population of receptors7, and is very useful in constructing time courses of this process. Unfortunately, this assay is unable to monitor any process other than degradation of the original pool of receptors, such as internalization, recycling, or new receptors. Also, the addition of an antibody in the 150kDa range to a receptor in the 50kDa range can alter the receptor’s trafficking8,9, and this technique may be difficult to use with low expression-level receptors.
Other procedures use various methods to identify intracellular trafficking compartments (e.g., endosomes, etc.) and assess their colocalization with the receptors of interest. This includes the use of heterologous systems expressing fluorescent-protein-tagged chimeric constructs of the receptors and compartment markers (e.g., Rab-family GTPases). This potentially enables the use of live-cell imaging, removing issues related to fixation and permeabilization. While powerful, such a strategy suffers from the same limitations of heterologous systems in general: tag and expression level effects on trafficking behavior and incompatibility with more physiologically representative cell types. More popularly, dyes are used to easily label intracellular compartments (e.g., lysosomes, ostensibly)10. Dyes, however, can lack specificity (all acidic organelles in the case of dyes for lysosomes) and do not assess trafficking through other compartments. Still, these techniques allow considerable control over the system and experimental conditions and may benefit from the colocalization analysis methods presented here, below.
The method we present here refines the tracking of receptor trafficking by colocalization. Using immunocytochemistry (ICC) to label appropriate markers, it is possible to identify multiple distinct intracellular compartments. This also allows the use of physiologically-relevant primary cell cultures in place of heterologous systems. This ICC protocol involves fixing the cells of interest prior to labeling; this permits labeling at a specific timepoint following drug treatment(s). This produces a ‘snapshot’ of global receptor-compartment associations at that timepoint. With multiple timepoints, a timecourse of trafficking changes can also be constructed.
Briefly, cells are drug-treated, labeled for the receptor and intracellular compartment of interest, confocally imaged, and the photomicrographs are analyzed to mathematically quantify colocalization of the receptor and compartment11. In our use, we examined the colocalization of a receptor with Rab5, Rab11, and Lysosomal-associated membrane protein 1 (LAMP1). These markers identify early endosomes, recycling endosomes, and lysosomes, respectively. These colocalization measures act as proxies for the overarching processes of internalization, recycling, and degradation12.
As with all techniques, some limitations should be considered. Due to the need to image every individual neuron analyzed, this technique can become quite labor-intensive depending on the number of conditions and timepoints involved. All immunolabeling must also contend with the effects on cellular ultrastructure, protein localization, and epitope accessibility caused by fixation and permeabilization13.
Though originally optimized for use with primary cultures of primary sensory neurons, this method is broadly compatible with other monolayer-plated culture models.
The use of a mathematically quantified measure of colocalization is, notably, far more methodologically rigorous than previous techniques used to assess receptor trafficking changes, which have often relied on vague, subjective measures such as visually-inspected multi-channel overlays14.
This technique is particularly useful for its broad compatibility with in vivo interventions (prior to primary culture generation), in vitro interventions (during culture growth), and various labeling targets15. As such, it may be adapted to many different research questions.
Protocol
Note: This protocol is broadly compatible with various monolayer-plated cell/tissue culture models, drug treatment regimens, and labelling targets. Thus in actual use, many specific parameters will vary based on experimental design. Here, references to these user-defined parameters are generic. Example conditions, as used to obtain the representative results, are included in italics.
1. Solutions
- Prepare washing buffer by mixing 0.1M Tris-Buffered Hypertonic (300 mM) Saline and 0.05% Polysorbate 20; pH 7.4 at RT.
- Prepare blocking buffer. To 0.05 M Tris-Buffered Hypertonic (300 mM) Saline add 0.05% Polysorbate 20, 3% Bovine Serum Albumin (BSA) and 0.1% cold fish skin gelatin and adjust the pH to 7.4 at RT.
- Prepare antibody diluent by adding 0.05% Polysorbate 20, 1% BSA, 0.1% cold fish skin gelatin to 0.05 M Tris-Buffered Hypertonic (300 mM) Saline and adjust the pH to 7.4 at 4 oC.
Note: The pH of Tris buffers is temperature-dependent. That is, a change in temperature will change the pH of the solution. For consistency, these buffers should always be pH-adjusted at the temperature at which they will be used.
2. Cell Culture
Note: Appropriate cell culture protocols will vary based on cell type(s) used. These procedures must be separately optimized. Detailed cell culture methodologies are readily available, including16. A similar procedure was used to obtain the representative results, with the notable differences:
- Culture dorsal root ganglia neurons from adult animals as described 12. Use adult-neuron growth medium to culture the cells. Reduce the glial cell density by preplating, rather than glutamate. This results in a mixed neuron-glial culture grown on 12-round glass coverslips with at least 30-60 neurons per plate and accompanying glial cells grown to approximately 40% confluency. It should be noted that neurons in a primary culture will not replicate and will be pushed off of the plate by co-cultured glia if the glia are allowed to grow excessively. In order to avoid affecting the neurons, physical reduction of glial numbers is preferable to chemical/pharmacological methods.
Note: For the purposes of this protocol, we assume that the cells of interest are grown to their experimentally-desired state and monolayer-plated. We find that plating on 12-round glass coverslips in 24 well plates to be most convenient. All volumes and procedures described are appropriate for one coverslip in one well of a 24 well plate.
3. Drug Treatment of Cultured Cells
Note: Multiple sequential, or overlapping, drug treatments are possible. The drugs, doses/concentrations, and durations of exposure used will depend on the specific experiment.
- Remove the original growth medium16 and replace it with medium containing the drug(s) of interest at the chosen concentration(s). In this case, use 10 µM of Morphine solubilized in saline or use saline as control.
Note: It is important that each independent replicate (generally a single 24-well plate culture) contain the same common control condition. This will permit normalization of data across replicates, which corrects for inter-trial variability. - Incubate the cells in the original growth conditions16 for 48 hr.
- For subsequent drug treatments, repeat steps 3.1 and 3.2 with Deltorphin 1 µM, SNC80 1 µM, or vehicle and incubate for 60 min12. Solubilize deltorphin II in water and solubilize SNC80 at 10 mM in 40 µM HCl and sonicate, diluted to 1 mM in water.
Note: This protocol assumes the drug(s) have been solubilized such that they may be dissolved at the desired concentration(s) in the chosen growth medium. Appropriate procedures for such solubilization will vary depending on the drug in question and must be separately optimized. - Wash the cells gently, three times, with ~ 1 ml of washing buffer per wash. Perform each wash by gently aspirating the liquid from the well, then promptly, and gently, refilling the well with fresh solution, as desired (in this case with washing buffer).
4. Fixation and Immunocytochemistry
Note:The specific labeling targets will vary by experiment. In our use, we labeled delta opioid receptors (DOR) and Rab5, Rab 11, and LAMP1, as discussed. The specific antibodies used will depend on the specific experiment. Optimum labeling conditions are dependent on the specific antibody(ies) used. A much fuller discussion of this topic is below.
- Fix the cells by immersion in ~ 300 µl 4% paraformaldehyde in 0.1 M phosphate buffered saline for 10 min at 37 ºC.
Note: It is important that the 4% paraformaldehyde be freshly prepared due to the autofluorescence caused by the use of previously-frozen paraformaldehyde. - Wash the cells gently, 3 times, with ~ 1 ml of washing buffer per wash, as described in 3.3.
- Incubate the cells in 300 µl blocking buffer for 2 hr at RT.
- Incubate the cells with primary antibodies in 300 µl of antibody diluent for 48 hr at 4 ºC. In our use, primary antibodies against DOR (rabbit anti-DOR) and one of: Rab5 (mouse anti-Rab5), Rab 11 (mouse anti-Rab11), and LAMP1 (goat anti-LAMP1).
- Wash the cells gently, three times, with ~ 1 ml of washing buffer per wash, as described in 3.3.
- Incubate the cells with secondary antibodies conjugated to different fluorophores (see discussion below) in 300 µl of antibody diluent for 1 hr at RT. In this, and all subsequent steps, protect the cells from light. To obtain the representative results, use green-emitting fluorophore-conjugated anti-rabbit and either a red-emitting fluorophore-conjugated anti-mouse or red-emitting fluorophore-conjugated anti-goat.
- Wash the cells gently, 3 times, with ~ 1 ml of washing buffer per wash, as described in 3.3.
- Remove the 12-round coverslips from 24 well plates by leaving ~ 1 ml of washing buffer in each well, holding the plate at ~ 45º, and lever the coverslip off of the well floor using fine forceps. The coverslip will come to rest against the well wall, from where it can easily be removed using the forceps.
- Mount the coverslips, cell-side-down, on microscope slides with anti-fading mounting medium.
5. Microscope Settings
- Using a high magnification objective (100X), first locate a representative cell to be imaged using epifluorescence.
- Configure the image capture settings to record 8-bit uncompressed TIFF images of each labeled channel (for detection of each fluorophore used e.g., 488 nm and 594 nm), to image each channel sequentially (either by line or frame), and to average 4 to 6 scans for the final image. Optimal image resolution will be microscope-specific, but 1024 x 1024 typically yields good results.
- Switch to the confocal imaging path and focus to a z-plane through the center of the cell.
- Optimize pinhole (typically 1 Airy unit), laser power, and photomultiplier tube voltage (gain) and offset for each channel. Save/record these settings. Use the same microscope settings for imaging all the cells labelled for any given target pair in the same replicate.
Note: This process will usually result in sufficient photobleaching that this cell should not be imaged for analysis.
6. Imaging
- Using a high magnification objective (e.g., 100X), first locate a cell to be imaged using epifluorescence.
- Switch to the confocal imaging path and focus to a z-plane through the center of the cell. If available, use software zoom/crop to restrict the scan area to the cell of interest.
- Capture images for each labelled channel using the settings previously established. Repeat steps 6.1 to 6.3 to image 15 or more cells per condition per replicate to ensure a sufficient sample.
7. Colocalization Analysis
- Open the pair of images (e.g., ‘green’ and ‘red’) of a cell in ImageJ. Use the Image > Color > Merge Channels… command to generate an RGB image.
- Draw a selection around the cell of interest. Use the ImageJ plugin “PSC Colocalization” (11; available from https://www.cpib.ac.uk/tools-resources/software/psc-colocalization-plugin/) to quantify colocalization of the targets in the selected cell.
- Record the desired colocalization measure (typically Pearson’s r 17). Repeat steps 7.1 to 7.3 for each imaged cell.
8. Data Normalization
- Calculate the mean of the recorded colocalization values of the common control conditions of each replicate of each labeling condition.
Note: For example, the mean of the colocalization values of neurons in the “48-hr vehicle, 60-min vehicle” drug condition in each of 3 independent replicates in each of 3 labeling conditions (receptor and each of 3 compartments). - Multiply the means by (-1) to yield the offset for each replicate in each labeling condition. Add the offset for each replicate in each labelling condition to each colocalization value in that replicate.
Note: This will normalize the data such that the mean colocalization measure for the common control condition is 0 in each replicate of each labeling condition. - Pool the data from all replicates of each labeling condition.
Note: Changes in colocalization can now be analyzed across replicates. Statistical analysis will depend upon experimental design but will typically involve analysis-of-variance (ANOVA) followed by appropriate post-hoc tests (e.g., Tukey). For statistical resources, see e.g., 18.
Representative Results
Using this technique, it is possible to quantify changes in receptor post-internalization trafficking following both chronic/prolonged and acute drug treatments. After drug treatments, fixation, and labeling, high-resolution two-channel photomicrographs are captured of each cell of interest. Representative images may be combined with false-color colocalization to generate illustrative figures (Figure 1). Subsequent colocalizational analysis, as described, yield quantitative scores of target-target colocalization (e.g., receptor-compartment marker). These data may then be used to compare changes in, in this case, receptor trafficking induced by the drug treatment(s) (Figure 2).
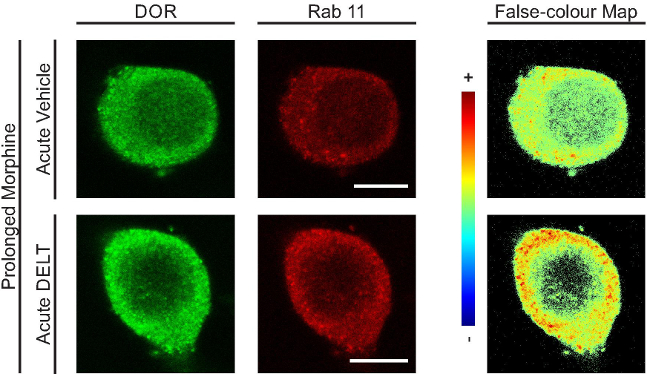
Figure 1. Representative photomicrographs of receptor and compartment-marker labelling with false-color colocalization maps. Primary cultures of dorsal root ganglia sensory neurons were exposed to prolonged (48 hr) and acute (1 hr) drug treatments (left axis labels). Only one prolonged condition is shown as representative results. The cells were then immunolabeled for delta opioid receptors (DOR) and a marker of recycling endosomes (Rab 11) with distinct primary-secondary (fluorophore conjugated) antibody pairs (top axis labels). The cells were imaged by two-channel sequential confocal microscopy (left column, center column). Representative images show the two labelled targets in two neurons. One neuron was treated with prolonged morphine followed by acute vehicle (top). The other neuron was treated with prolonged morphine followed by acute deltorphin II (DELT, a DOR agonist; bottom). In addition to subsequent quantitative colocalizational analysis, these representative images were processed to generate false-color colocalization maps (right column). Scale bars show 10 µm. Adapted from 12 under the provisions of CC BY-NC 3.0. Please click here to view a larger version of this figure.
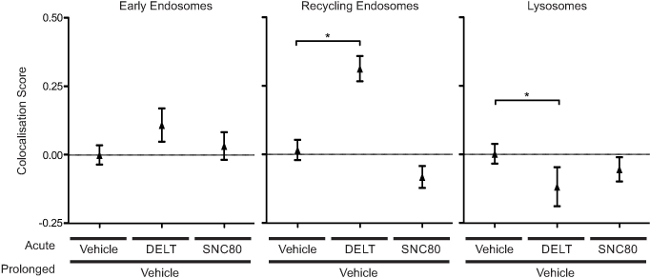
Figure 2. Quantitative colocalization scores can be used to compare changes in receptor post-internalization trafficking. Primary cultures of dorsal root ganglia sensory neurons were exposed to prolonged (48 hr) and acute (1 hr) drug treatments (x-axis labels). Only one prolonged condition is shown as representative results. The cells were then immunolabelled for DOR and markers of early endosomes, recycling endosomes, and lysosomes. After imaging colocalization scores were determined, normalized, and pooled across 3 – 4 independent replicates. Data were then analyzed by two-way analysis of variance (ANOVA) with Tukey’s HSD post-hoc. Data are presented as mean +/- 95% confidence interval. * denotes p < 0.05. As is evident, this technique allowed the identification of changes in DOR post-internalization trafficking induced by acute treatment with deltorphin II, but not SNC80 (two different DOR agonists). Adapted from 12 under the provisions of CC BY-NC 3.0. Please click here to view a larger version of this figure.
Discussion
We have optimized this protocol for the analysis of primary cultures of adult dorsal root ganglion neurons (primary sensory neurons). It can also be used, with little or no modification, for monolayer-plated cultured cells broadly. The colocalizational analysis is also possible in tissue slices and other such preparations11, however the drug treatment and tissue fixation/preparation components would not be appropriate.
Of interest, the ICC methods presented here can also be used, with appropriate fixation and tissue preparation, to perform double-labeled immunohistochemistry in tissue slices, irrespective of subsequent analysis (e.g., 19).
This protocol is broadly compatible with different labeling targets. Each coverslip of plated cells will be double-labeled. Typically, this will be for the receptor of interest and a marker of one of the compartments of interest. There will typically be multiple labeling conditions in order to examine receptor colocalization with multiple different compartments.
Antibodies are inherently variable. Appropriate labeling protocols will vary between different antibodies. This includes appropriate antibody concentrations, buffer recipes, and timepoints. It should also be noted that different lots of the same antibody are best considered to be different antibodies. As such, labeling methods and antibody specificity should be validated, and if necessary optimized, for each combination of antibody and target tissue. The methods used here are a useful starting point. When validating labeling, it is important to perform appropriate controls: this includes samples processed without the addition of secondary antibodies (to control for autofluorescence) and without primary antibodies (to control for non-specific secondary labeling).
There are many factors which influence the design of labeling methods. Some considerations of note affecting the methods presented here include the use of Tris buffers, hypertonic saline, Polysorbate, BSA, and cold fish skin gelatin. Phosphate buffers can cause higher non-specific labeling and may interact with some lesser-used antibody conjugates. However, Tris buffers are, as noted, temperature sensitive. Hypertonic salt concentrations reduce non-specific labelling by disrupting ionic interactions. It is possible to further increase salt concentrations beyond what is specified in this protocol, if desired. Polysorbate 20 is used as a relatively gentle surfactant/detergent. This is preferred over Triton X-100, which has been reported to significantly disrupt, or even dissolve, membranes and thereby distort subcellular structure. The inclusion of low-concentration Polysorbate 20 in all buffers is useful in reducing non-specific labelling, as it improves the thoroughness of washes. BSA is a commonly used blocking agent intended to occupy non-specific protein binding sites in the target tissue. Some have reported that BSA may aggregate and lead to non-specific punctate labelling. If this issue arises, it is possible to replace BSA with non-fat dry milk or additional cold fish skin gelatin. Cold fish skin gelatin is a non-mammalian protein source also intended to occupy non-specific protein binding sites while presenting low reactivity to antibodies directed against mammalian proteins20.
Though not specified in this protocol, it is typical to add, to the blocking buffer, normal serum from the species in which the secondary antibody was raised. Typical concentrations are 1 – 3%. As discussed below, care in species selection must be exercised to avoid cross-reactivities.
When detecting two or more fluorescently-labeled targets, the choice of appropriate fluorophore combinations is particularly important. It is essential to have good spectral separation in order to avoid crosstalk. Further, the choice of fluorophores will depend on the configuration of the microscope to be used (available filters, laser lines, etc.). Fluorophore-conjugated antibody suppliers will offer advice on the best combinations of their products (e.g., 21). We find 488 nm- and 594 nm-excited fluorophores to be best pair for double-labeling and colocalizational analysis.
Secondary antibodies are typically species-reactive. That is, they will label any antibodies produced by the target species. Double-labeling ICC therefore requires that care be taken in choosing the host species of the primary and secondary antibodies in order to avoid cross-reactivity. For example, if the primaries are raised in rabbit and goat, it would not be appropriate to use a goat-raised secondary. If antibody availability does not allow for such species separation, there are protocols available to accomplish labelling with multiple same-host primary antibodies (e.g., 22), though substantially more optimization and validation should be expected.
As this method quantifies colocalization in photomicrographs, it is fundamentally necessary that all microscopy be consistent, of high quality, and accurately representative of the samples imaged. This includes both the hardware used (optics quality, etc.) and the particular procedures and parameters chosen. There are excellent resources available for guidance on appropriate microscopy23,24, including microscopy specifically for colocalizational analysis11,17,25.
Though of considerable methodological superiority to visual overlay methods, quantitative measures of colocalization do not as nicely lend themselves to the generation of illustrative figures for publication. Such illustrative figures are often helpful for readers and their absence may be criticized by reviewers. We have found that the inclusion of false-color ‘heatmaps’ visualizing colocalization to be helpful in constructing figures. The ImageJ plugin “Colocalization Colormap” (available from https://sites.google.com/site/colocalizationcolormap/) is useful in generating these images. It is important to note, however, that these images would be strictly illustrative in the context of the technique described here.
Divulgations
The authors have nothing to disclose.
Acknowledgements
This work was supported by a grant from CIHR (MOP394808) and a Canada Research Chair to C.M.C. E.W.O. was the recipient of a Post-Graduate Scholarship from NSERC.
Materials
| Trizma Base | Sigma Aldrich | T1503-500G | |
| Sodium Chloride | Sigma Aldrich | S9888-500G | |
| Tween 20 | Fisher Scientific | BP337-500 | |
| Hydrochloric Acid | Sigma Aldrich | 258148 | |
| Albumin from Bovine Serum | Sigma Aldrich | A7906-100G | |
| Gelatin from cold water fish skin | Sigma Aldrich | G7041-100G | |
| Corning Costar Cell Culture Plates: 24-well | Fisher Scientific | 720084 | |
| 12 circle Microscope Cover Glass | Fisher Scientific | 1254580 | |
| Aqua/Poly-Mount | Polysciences | 18606-20 | |
| Sodium Phosphate Monobasic | Sigma Aldrich | S9638-500G | |
| Sodium Phosphate Dibasic | Sigma Aldrich | S9763-500G | |
| Paraformaldehyde | Polysciences | 00380-1 | |
| Dumont #5 Forceps – Standard/Dumoxel | Fine Science Tools | 11251-30 | |
| Rabbit anti-DOR antibody | MyBioSource | MBS316175 | Used at 1:1500 |
| Mouse anti-Rab5 antibody | Sigma Aldrich | R7904 | Used at 1:750 |
| Mouse anti-Rab11 antibody | Millipore | 05-853 | Used at 1:500 |
| Goat anti-LAMP1 antibody | Santa Cruz | SC8098 | Used at 1:750 |
| Donkey anti-rabbit Alexa 488 conjugated antibody | Life Technologies | A-21206 | Used at 1:200 to 1:2000 |
| Goat anti-mouse Alexa 594 conjugated antibody | Life Technologies | A-11005 | Used at 1:200 to 1:2000 |
| Donkey anti-goat Alexa 594 conjugated antibody | Life Technologies | A-11058 | Used at 1:200 to 1:2000 |
References
- Drake, M. T., Shenoy, S. K., Lefkowitz, R. J. Trafficking of G protein-coupled receptors. Circ. Res. 99 (6), 570-582 (2006).
- Hanyaloglu, A. C., von Zastrow, M. Regulation of GPCRs by endocytic membrane trafficking and its potential implications. Annu. Rev. Pharmacol. Toxicol. 48, 537-568 (2008).
- Hislop, J. N., von Zastrow, M. Role of ubiquitination in endocytic trafficking of G-protein-coupled receptors. Traffic. 12 (2), 137-148 (2011).
- Nagi, K., Piñeyro, G. Regulation of opioid receptor signalling: implications for the development of analgesic tolerance. Mol. Brain. 4 (1), 25 (2011).
- Whistler, J. L., Enquist, J., et al. Modulation of postendocytic sorting of G protein-coupled receptors. Science. 297 (5581), 615-620 (2002).
- Von Zastrow, M. Regulation of opioid receptors by endocytic membrane traffic: mechanisms and translational implications. Drug Alcohol Depend. 108 (3), 166-171 (2010).
- Milan-Lobo, L., Whistler, J. L. Heteromerization of the µ- and δ-opioid receptors produces ligand-biased antagonism and alters µ-receptor trafficking. J. Pharmacol. Exp. Ther. 337 (3), 868-875 (2011).
- Wang, H. -. B., Guan, J. -. S., Bao, L., Zhang, X. Distinct subcellular distribution of delta-opioid receptor fused with various tags in PC12 cells. Neurochem. Res. 33 (10), 2028-2034 (2008).
- Scherrer, G., Tryoen-Tóth, P., et al. Knockin mice expressing fluorescent delta-opioid receptors uncover G protein-coupled receptor dynamics in vivo. Proc. Natl. Acad. Sci. 103 (25), 9691-9696 (2006).
- He, S. -. Q., Zhang, Z. -. N., et al. Facilitation of µ-opioid receptor activity by preventing δ-opioid receptor-mediated codegradation. Neuron. 69 (1), 120-131 (2011).
- French, A. P., Mills, S., Swarup, R., Bennett, M. J., Pridmore, T. P. Colocalization of fluorescent markers in confocal microscope images of plant cells. Nat. Protoc. 3 (4), 619-628 (2008).
- Ong, E. W., Xue, L., Olmstead, M. C., Cahill, C. M. Prolonged morphine treatment alters δ opioid receptor post-internalization trafficking. Br. J. Pharmacol. 172 (2), 615-629 (2014).
- Schnell, U., Dijk, F., Sjollema, K. a. Immunolabeling artifacts and the need for live-cell imaging. Nature Methods. 9 (2), 152-158 (2012).
- Rozenfeld, R., Gupta, A., Devi, L. A. Cell surface targeting of mu-delta opioid receptor heterodimers by RTP4. Proc. Natl. Acad. Sci. 105 (41), 16045-16050 (2008).
- Gupta, A., Mulder, J., et al. Increased abundance of opioid receptor heteromers after chronic morphine administration. Sci. Signal. 3 (131), ra54 (2010).
- Seibenhener, M. L., Wooten, M. W. Isolation and culture of hippocampal neurons from prenatal mice. J. Vis. Exp. (65), 1-7 (2012).
- Bolte, S., Cordelières, F. P. A guided tour into subcellular colocalization analysis in light microscopy. J. Microsc. 224 (Pt 3), 213-232 (2006).
- Field, A., Miles, J., Field, Z. . Discovering Statistics Using R. , (2012).
- Mattioli, T. -. A. M., Milne, B., Cahill, C. M. Ultra-low dose naltrexone attenuates chronic morphine-induced gliosis in rats. Mol. Pain. 6, 22 (2010).
- Vogt, R. F., Phillips, D. L., Henderson, L. O., Whitfield, W., Spierto, F. W. Quantitative differences among various proteins as blocking agents for ELISA microtiter plates. J. Immunol. Methods. 101 (1), 43-50 (1987).
- Johnson, I., Spence, M. . The Molecular Probes Handbook. , (2010).
- Morris, T. J., Stanley, E. F. A simple method for immunocytochemical staining with multiple rabbit polyclonal antibodies. J. Neurosci. Methods. 127 (2), 149-155 (2003).
- Pawley, J. . Handbook of Biological Confocal Microscopy. , (2006).
- North, A. J. Seeing is believing? A beginners’ guide to practical pitfalls in image acquisition. J. Cell Biol. 172 (1), 9-18 (2006).
- Zinchuk, V., Zinchuk, O., Okada, T. Quantitative colocalization analysis of multicolor confocal immunofluorescence microscopy images: pushing pixels to explore biological phenomena. Acta Histochem. Cytochem. 40 (4), 101-111 (2007).
