Photoactivated Localization Microscopy with Bimolecular Fluorescence Complementation (BiFC-PALM)
Summary
Protein-protein interactions are visualized in cells with nanometer spatial resolution by combining bimolecular fluorescence complementation (BiFC) with photoactivated localization microscopy (PALM). Described here is the use of BiFC-PALM for imaging Ras-Raf interactions in U2OS cells for visualizing the nanoscale clustering and diffusion of individual Ras-Raf complexes.
Abstract
Protein-protein interactions (PPIs) are key molecular events to biology. However, it remains a challenge to visualize PPIs with sufficient resolution and sensitivity in cells because the resolution of conventional light microscopy is diffraction-limited to ~250 nm. By combining bimolecular fluorescence complementation (BiFC) with photoactivated localization microscopy (PALM), PPIs can be visualized in cells with single molecule sensitivity and nanometer spatial resolution. BiFC is a commonly used technique for visualizing PPIs with fluorescence contrast, which involves splitting of a fluorescent protein into two non-fluorescent fragments. PALM is a recent superresolution microscopy technique for imaging biological samples at the nanometer and single molecule scales, which uses phototransformable fluorescent probes such as photoactivatable fluorescent proteins (PA-FPs). BiFC-PALM was demonstrated by splitting PAmCherry1, a PA-FP compatible with PALM, for its monomeric nature, good single molecule brightness, high contrast ratio, and utility for stoichiometry measurements. When split between amino acids 159 and 160, PAmCherry1 can be made into a BiFC probe that reconstitutes efficiently at 37 °C with high specificity to PPIs and low non-specific reconstitution. Ras-Raf interaction is used as an example to show how BiFC-PALM helps to probe interactions at the nanometer scale and with single molecule resolution. Their diffusion can also be tracked in live cells using single molecule tracking (smt-) PALM. In this protocol, factors to consider when designing the fusion proteins for BiFC-PALM are discussed, sample preparation, image acquisition, and data analysis steps are explained, and a few exemplary results are showcased. Providing high spatial resolution, specificity, and sensitivity, BiFC-PALM is a useful tool for studying PPIs in intact biological samples.
Introduction
Protein-protein interactions (PPIs) are fundamental to biology1 and are tightly regulated via spatiotemporal mechanisms across many time and length scales. Studies on cell signaling on the cell membrane, for example, have revealed dynamic, nanoscale spatial compartments that facilitate specific PPIs and cellular processes2. Hence, the ability to probe PPIs in biological systems with sufficient spatial and temporal resolutions, high specificity, and high sensitivity is key to achieving a mechanistic understanding of biology.
Bimolecular fluorescence complementation (BiFC) is one of the few existing tools for visualizing PPIs in a cell with subcellular resolution and live-cell compatibility3–5. The technique is relatively straightforward and involves splitting of a fluorescence protein into two non-fluorescent fragments; when genetically tagged to two interacting proteins and brought into proximity, the fragments can reconstitute to form a complete fluorescent protein, yielding fluorescent signal. When properly designed, BiFC probes should not spontaneously reconstitute in the absence of PPIs. As such, the fluorescence signal in a BiFC assay will only arise in the presence of PPIs, which enables direct visualization of PPIs with high specificity. Additional benefits of using fluorescence as the readout are high sensitivity, subcellular resolution, and compatibility with high throughput and high content screening assays, among others. For these benefits, a number of BiFC probes based on different parent fluorescent proteins have been developed. As in all other detection techniques based on conventional light microscopy, however, the spatial resolution of BiFC is limited to ~250 nm by the diffraction of light. This makes it a challenge to study the regulation of PPIs at the nanoscale, which, as alluded earlier and exemplified by lipid rafts6 and Ras nanoclusters7, is a critical length scale to understanding many cellular processes such as signaling.
BiFC has been combined with photoactivated localization microscopy (PALM)8,9 to overcome this limit in spatial resolution for imaging PPIs10. PALM is a recent superresolution microscopy technique that circumvents the diffraction limit in fluorescence imaging through stochastic activation and subdiffractive localization of single fluorescent molecules. In each activation cycle, a fluorescent molecule emits a few hundred to a few thousand photons and gives rise to a single molecule image on the detector. While the image is diffraction-limited (~250 nm in width), its centroid can be determined with much higher precision, typically on the order of 10-50 nm depending on the number of photons detected. By activating and localizing each fluorescent molecule in the sample, a high resolution image can be reconstructed. Performed on living cells, single molecule tracking (smt-) PALM further permits acquisition of thousands of protein diffusion trajectories from a single cell11. Importantly, PALM uses specialized fluorescent probes such as photoactivatable fluorescent proteins (PA-FPs) to achieve stochastic activation. Since both BiFC and PALM use fluorescent proteins, they were combined by splitting PAmCherry1, a commonly used PA-FP for PALM, into two fragments between amino acids 159 and 160.
The BiFC system based on split PAmCherry1 shows low background signal from spontaneous reconstitution of the two fragments. When genetically tagged to a pair of interacting proteins, the two fragments (RN = residues 1-159; RC = Met + residues 160-236) reconstituted efficiently to form complete PAmCherry1 proteins even at 37 °C and without incubating at lower temperatures, which is not the case for other BiFC pairs12 such as the parent mCherry13. Furthermore, the reconstituted PAmCherry1 protein retained the photophysical properties of the parent PAmCherry1, such as high contrast ratio, medium photon yield, and fast photoactivation, among others, which are critical for accurate single molecule localization and high-resolution PALM imaging.
In this protocol, the use of BiFC-PALM for imaging Ras-Raf interactions in U2OS cells by using split PAmCherry1 (Figure 1A) is described. The first step is to design the constructs for expressing fusion proteins between PAmCherry1 fragments (i.e., RN and RC) and the proteins of interest. In theory, for each pair of candidate proteins (A and B), there are eight pairs of fusion proteins to be tested: RN-A/RC-B; RN-A/B-RC; RC-A/RN-B; RC-A/B-RN; A-RN/RC-B; A-RN/B-RC; A-RC/RN-B; and A-RC/B-RN. This process can often be simplified by taking into account the structural or biochemical properties of the candidate proteins. In the case of Ras, the protein is post-translationally modified at the C-terminal CAAX box (C=Cys; A=aliphatic; X=any), after which the AAX motif is cleaved off. Hence, RN or RC can only be fused to the N-terminus of Ras; this reduces the number of fusion protein pairs to four (Figure 1B). For Raf, the Ras-binding domain (RBD; residues 51-131) is used and can be tagged on either end. These four fusion configurations were generated: RN-KRas/RC-Raf RBD; RN-KRas/Raf RBD-RC; RC-KRas/RN-Raf RBD; and RC-KRas/Raf RBD-RN.
Additionally, the linker between the fragments and the proteins of interest will need to be considered. A flexible linker of about ten amino acids is often used as it provides sufficient freedom for complementation to occur. One such linker is (GGGGS)x2, although there are many others that have been successfully applied, including random sequences generated from a multiple cloning site (MCS)14. The length of the linkers may need to be optimized depending on the size of the proteins of interest and their orientations when interacting.
The PAmCherry1 fragments are contained in a small cloning backbone with flanking MCSs (see Materials List). Genes of interest can be inserted via the restriction sites or with a ligation-independent method. After cloning and sequence verification, the expression cassette is transferred to an expression vector using a recombinase reaction, a cloning process with high fidelity and high efficiency.
Next, the resulting expression constructs are transfected into the target cell line or, if a stable cell line is desired, packaged into lentivirus for infecting the target cell line. Transient transfection allows for quick validation of the BiFC configurations, but potential problems must be noted. Transfection using chemicals often stresses the cells, resulting in high autofluorescence; while the use of total internal reflection fluorescence (TIRF) microscopy can mitigate this background signal by limiting the illumination volume, TIRF ideal when the PPIs take place on the cell membrane. Additionally, transient transfections often lead to high levels of protein expression, far exceeding those of the endogenous proteins, which may cause artifacts in detecting the PPIs. Hence, it is recommended that stable cell lines be established after an appropriate BiFC configuration has been determined through initial testing. Stable cell lines also have the potential for tunable expression via doxycycline induction15.
After infection, cells are selected with antibiotics, typically puromycin and neomycin, one for each construct. The subsequent steps for sample preparation, image acquisition, and data analysis will be described in detail in the protocols.
With this approach, the formation of nanoscale clusters in BiFC-PALM images of Ras-Raf RBD are routinely observed (Figure 2A). Consistently, smt-PALM trajectories of Ras-Raf RBD show a heterogeneous distribution in the diffusion states (Figure 2B-D). These results suggest that Ras-Raf complexes exist in multiple states on the cell membrane, presumably as monomers and clusters, with potential biological implications. This work demonstrates the power of BiFC-PALM in selective imaging of PPIs in cells with nanometer spatial resolution and single molecule sensitivity, which would be difficult to obtain with conventional BiFC, fluorescence co-localization, or fluorescence resonance energy transfer (FRET).
When designing BiFC experiments and interpreting the results, it is important to keep in mind that the BiFC process is irreversible in most cases, including split PAmCherry1. Once the two fragments combine and form a complete PAmCherry1 protein, the linkage between the two fragments, and thus the PPI becomes permanent. This limits the use of BiFC and BiFC-PALM for monitoring the dynamics of the PPIs (i.e., binding kinetics and not the diffusion dynamics of the protein complex once it is formed) and at times could even lead to mislocalization of the PPI complexes.
An additional factor to consider when designing BiFC-PALM experiments is the delay in chromophore maturation that is inherent in fluorescent proteins. Once two proteins interact and the FP fragments come together, they typically refold on the order of seconds (half-time of 60 sec for EYFP3). However, subsequent chromophore maturation and fluorescent signal develop on the order of minutes. While fluorescence may be detectable within 10 min after reconstitution of split-Venus, a fast-folding YFP variant, the half-time for maturation in general is often around 60 min16. Split-PAmCherry1 was observed to have similar rates. Hence, BiFC and BiFC-PALM are currently poor choices for monitoring real-time PPI kinetics; other methods, such as FRET and a recently developed dimerization dependent fluorescent protein17, may be more suited for this purpose.
Protocol
1. Cloning
- Determine the configurations to clone and choose a linker. Tag proteins with the fragments on the N- or C-terminus as described below so they do not disrupt their proper localization. Use a flexible linker such as (GGGGS)x2.
- Genetically tag the proteins of interest to the PAmCherry1 fragments. As one option, use the cloning plasmids listed in the Materials List containing the fragments RN (PAmCherry1 residues 1-159) and RC (Met plus PAmCherry1 residues 160-236) with flanking MCS sequences.
- Linearize the plasmids containing the fragments RN and RC with inverse PCR (or restriction digest) at the point of insertion. Primers for inverse PCR are listed in Table 1. Below is an example PCR protocol used in the author’s lab (see Materials List for the exact materials used in this protocol).
- Mix the PCR reaction together, brought up to a final volume of 50 µl with water: to a thin-walled PCR tube, add the water, 25 µl of 2x master mix, 0.5 µl each of the forward and reverse primers (20 µM diluted stock, 0.2 µM final concentration), and 1 ng of template. Use the following cycling conditions: 98 °C for 30 sec, 30 cycles of 98 °C for 7 sec and 68 °C for 2 min, and a final extension at 72 °C for 10 min.
- PCR the genes of interest for insertion to the linearized plasmids containing RN and RC fragments. Perform the PCR as in step 1.2.1 with the extension time at 68 °C. Use primers with overhangs that contain a flexible linker sequence, such as GGAGGTGGAGGTAGTGGTGGAGGTGGAAGT for (GGGGS)x2, and 15 base pair homology to the ends of the linearized RN and RC plasmids for recombination.
Note: The primer overhangs for the proteins of interest are presented in Table 2 if using the primers in Table 1 to linearize the plasmid backbone. - Digest the PCR reaction with Dpn1 to eliminate the PCR template. Add 0.5 µl of Dpn1 (20 U/µl) directly to the 50 µl of PCR reaction. Incubate at 37 °C for 1 hr and heat inactivate at 80 °C for 20 min. If background template persists in later steps, increase the enzyme amount or lengthen the digestion time.
- Purify the PCR products via a spin column as described by the manufacturer.
- Perform a ligation-independent reaction to combine a linearized plasmid containing an RN or RC fragment with the gene of interest. Measure the concentration of the purified PCR products: combine 50 ng of linearized plasmid and 50 ng of the gene of interest with 1 µl of enzyme premix and bring the total volume to 5 µl with deionized water. Incubate at 50 °C for 15 min, place on ice, and add 20 µl of TE buffer.
- Transform recombinant plasmids into competent bacteria18.
- Select 2-4+ (as desired) colonies for O/N culture. Add 5 ml of LB broth and 5 µl of kanamycin (50 mg/ml stock) into a 14 ml polypropylene round-bottom tube, and add the selected bacteria colony with a sterilized inoculating loop. Incubate at 37 °C O/N while shaking at 225 rpm.
- Freeze 1 ml of O/N culture for glycerol stock19 and miniprep the remainder as described by the manufacturer.
- Perform sequencing to determine a good clone. If using the cloning plasmids in the Materials List, use M13 forward and reverse primers (in separate reactions) as necessary to obtain the complete sequence of the fusion construct. Compare with the expected sequence using an alignment tool such as BLAST from the National Center for Biotechnology Information (NCBI) – http://blast.ncbi.nlm.nih.gov/BlastAlign.cgi.
- Transfer the sequence-verified constructs to an expression plasmid via a recombinase reaction.
- Add 75 ng of the destination plasmid — such as pcDNA for transient transfections or pLenti for lentiviral packaging20 — and 50 ng of the recombinant cloning plasmid to 1 µl of enzyme premix and bring up the total volume to 5 µl with deionized water. Incubate at 25 °C for 1 hr, then add 5 µl of TE buffer.
Note: For lentiviral packaging and stable cell line generation, use a different destination plasmid for each construct, for example, one with puromycin resistance and the other neomycin. This allows for double selection of transduced cells. Also consider the promoter for each, such as the constitutive cytomegalovirus (CMV) promoter for high expression levels, or CMV with the TetO operator for tunable doxycycline-regulated expression. - Transform 5 µl into competent bacteria and miniprep the plasmids as in steps 1.2.6 to 1.2.8, but using the appropriate antibiotic (typically ampicillin).
- Add 75 ng of the destination plasmid — such as pcDNA for transient transfections or pLenti for lentiviral packaging20 — and 50 ng of the recombinant cloning plasmid to 1 µl of enzyme premix and bring up the total volume to 5 µl with deionized water. Incubate at 25 °C for 1 hr, then add 5 µl of TE buffer.
- Linearize the plasmids containing the fragments RN and RC with inverse PCR (or restriction digest) at the point of insertion. Primers for inverse PCR are listed in Table 1. Below is an example PCR protocol used in the author’s lab (see Materials List for the exact materials used in this protocol).
- Determine the optimal BiFC configuration.
- Co-transfect expression plasmids into U2OS cells (or cell of choice).
- Add 350 µl of phenol red-free and antibiotic-free DMEM supplemented with 10% FBS into each well of an 8-well #1.5 glass bottom chamber slide. Plate about 7.5 x 10⁴ cells per well so cells are about 70%-90% confluent the next day.
- The day after plating, co-transfect expression plasmids with different configurations in each well using the preferred reagent and as described by the manufacturer.
- For each well, add 125 ng of each expression plasmid into 50 µl of serum-free reduced media in a 0.6 ml tube and pipette up and down to mix. Add 1 µl of the transfection reagent down the center of the tube and directly into the media. Agitate gently to mix and let the reaction sit for 30 min.
- Reduce the media in each well of the chamber slide by about half. Add the transfection mixture dropwise to the wells and shake gently to mix. Incubate cells at 37 °C and 5% CO2 for 24-48 hr. Change the media the day after transfection.
- Image cells on a fluorescence microscope as in Protocol 2 beginning with step 2.1.4.
Note: The sample may be imaged on a standard fluorescence microscope if the expression levels are high and the camera is sensitive enough for the relatively low photon output of PAmCherry1. Reconstituted PAmCherry1 molecules can be activated with an ultra violet filter set (405 nm) prior to imaging with a green excitation (561 nm) filter set.
- Co-transfect expression plasmids into U2OS cells (or cell of choice).
- Where applicable, create a negative control by, for example, introducing a point mutation into one of the proteins of interest that disrupts the interaction. Perform a site-directed mutagenesis21 on the cloning plasmid of the protein to be mutated and of the chosen configuration.
- Generate a stable cell line by packaging the constructs into viral particles and infect U2OS cells (or cell line of choice). Consider an inducible (tetracycline) expression system15 so expression can be induced prior to imaging if prolonged irreversibility of BiFC is an issue, or if tunable expression is desired.
CAUTION: Working with viruses is classified as Biosafety Level 2. While recent generations of viral packaging systems have greatly reduced the likelihood of producing replication-competent viruses, some risks are still present. References can be found at http://www.cdc.gov/biosafety/publications/.- Repeat step 1.2.10 using a lenti- or retroviral destination vector20. Increase the O/N culture to 100 ml for a midiprep and greater purity of the plasmids.
- On Day 1: Plate about 2 x 10⁶ 293T/17 cells into a 10 cm dish for each construct to be packaged.
- On Day 2: Prepare a transfection reaction using a transfection reagent of choice and as described by the manufacturer.
- Prepare a premix of packaging plasmids with final concentrations of 250 ng/µl for packaging plasmids 1 and 2, and 100 ng/µl for packaging plasmid 3 in sterile water. Add 10 µl of the packing plasmid premix and 2.5 µg of the target plasmid to 1 ml of serum-free reduced media in a 5 ml polypropylene round-bottom tube and pipette up and down to mix. Add 20 µl of transfection reagent down the center of the tube and directly into the media.
- Agitate gently to mix and incubate at RT for 30 min. Remove about half the media from the cells and add the transfection mixture in a dropwise manner. Shake gently to mix and incubate at 37 °C and 5% CO2. Incubate 10 ml of media per plate in a tube with the cap loosened for temperature and CO2 equilibration.
- On Day 3: Gently change the media with the pre-incubated media and return the cells to the incubator. Incubate another tube of media with the cap loosened.
Note: Syncytia, or the formation of large multi-nucleated cells, can be a sign that the packaging is going well. However, cells are in a fragile state and can be easily detached. When changing media, tilt the pipettor so that it is horizontal and add the media dropwise into one edge of the plate. - On Day 4: Harvest the virus by removing the media with a syringe and filtering through a 0.45 µm pore size filter into a clean 50 ml tube. Gently replace the media with the pre-incubated media.
- On Day 5: Harvest again as done previously in step 1.5.3.3 and combine common filtrate into the same 50 ml tube. Add 6 ml of virus concentrator to each tube and mix. Store at 4 °C for at least 24 hr until the virus precipitates.
Note: Depending on the health of the cells, virus can be harvested a third time. - Concentrate the virus by centrifuging at 1,500 x g for 15 min at 4 °C. Aspirate the supernatant and resuspend the pellet in 250 µl of media. Virus can be used immediately for infection or stored in 50 µl aliquots at -80 °C for up to one year.
- Plate about 3 x 10⁵ U2OS (or target) cells per well into a 6-well plate (2 ml of DMEM with 10% FBS per well) for infection, so cells are about 50% confluent at the time of infection.
- The following day, remove about half the media so about 1 ml remains. Coinfect with 50 µl of concentrated virus for each construct. Add 1 µl of polybrene (8 mg/ml) to each well. Incubate at 37 °C and 5% CO2. Change media the next day and incubate for one more day before antibiotic selection.
Note: The amount of virus to add can vary depending on the desired rate of infection. Viruses can be titrated using qRT-PCR. - Add antibiotics to select for infected cells. Separate wells with uninfected cells that have not seen virus are required as canaries to test the efficacy of the selection. Incubate for 2-7 days, or until selection is complete.
Note: Effective concentrations should be titrated initially, but they are typically 1.0 µg/ml for puromycin and 1.0 mg/ml for neomycin. - Expand the cells into a larger 10 cm dish and proceed to Protocol 2.
- Prepare a premix of packaging plasmids with final concentrations of 250 ng/µl for packaging plasmids 1 and 2, and 100 ng/µl for packaging plasmid 3 in sterile water. Add 10 µl of the packing plasmid premix and 2.5 µg of the target plasmid to 1 ml of serum-free reduced media in a 5 ml polypropylene round-bottom tube and pipette up and down to mix. Add 20 µl of transfection reagent down the center of the tube and directly into the media.
2. Imaging Fixed Cells
- Prepare a sample for imaging
- Clean an 8-well #1.5 glass-bottom chamber slide by adding 250 µl of 1 M NaOH for at least 1 hr and wash thoroughly with PBS.
Note: Untreated chamber slides typically result in high background signal. Additionally, cells may be sensitive to residual NaOH and failure to thoroughly clean the glass surface (as many as 10x washes) may make cell adhesion difficult. If necessary, incubate the cleaned chamber slide with PBS O/N after washing. For sensitive cell lines, plating at a higher density (e.g., at 50%-60% initial confluency) may help. - Plate about 5.5 x 10⁴ of the U2OS stable expression cells per well in 350 µl of phenol red-free DMEM with 10% FBS so that cells are healthy and not over confluent when imaging.
- Perform necessary treatments for the experiment, such as adding tetracycline to induce protein expression.
- Fix the cells immediately before imaging.
- Prior to fixation, prepare fresh paraformaldehyde (PFA) solution — 3.7% PFA in 1x PHEM with 0.1% glutaraldehyde (GA). For 10 ml PFA solution, weigh 0.37 g of PFA and transfer to a 1.5 ml microcentrifuge tube. Add 1 ml of distilled water and 30 µl of 1 M NaOH and vortex. Heat at 70 °C and vortex every 1-2 min until PFA is completely dissolved.
- Transfer dissolved PFA to a 15 ml conical tube and add 3.8 ml distilled water, 5 ml 2x PHEM buffer, 20 µl of 25% glutaraldehyde, and vortex to mix. Stock, 2x PHEM buffer is 120 mM PIPES, 50 mM HEPES, 20 mM EGTA, and 16 mM MgSO4, with pH adjusted to 7.0 with 10 M KOH. This fixative solution can be stored at 4 °C for several days.
CAUTION: PFA and GA are both hazardous. Prepare the solution in a fume hood and wear proper protective equipment when handling both chemicals. Avoid inhalation or direct skin contact. - Remove the growth medium. Wash quickly with 500 µl of PBS and add 250 µl of the PFA fixative per well. Incubate the cells for 20 min at RT.
- Remove the PFA fixative from the sample and add 350 µl of PBS or imaging buffer (100 mM Tris with 30 mM NaCl and 20 mM MgCl2, pH 8.5) per well.
- Vortex 100 nm gold particles to break up aggregates and add 35 µl per well (10x final dilution) for tracking stage drift during imaging.
- Clean an 8-well #1.5 glass-bottom chamber slide by adding 250 µl of 1 M NaOH for at least 1 hr and wash thoroughly with PBS.
- Acquire images
- Turn on the microscope. Power on the 405 and 561 nm lasers, but keep the shutters (internal or external) closed at this point. Turn on the EMCCD camera and allow it to cool down. Ensure the 561 nm filters are in place.
- Open the acquisition software and set the exposure time to 100 msec and the EMCCD gain to 300 (range 1 – 1,000).
- Add immersion oil to the objective and secure the sample to the microscope stage.
- With either bright field or the 561 nm laser on (~1 kW/cm2), bring the sample into focus.
- For imaging Ras and other membrane proteins, use a 60X apochromat TIRF objective with 1.49 numerical aperture and bring the microscope into TIRF configuration. Adjust the excitation laser so that it is off-centered when hitting the back aperture of the TIRF objective; this causes the laser to deflect upon reaching the sample. Keep adjusting the laser until the critical angle is reached and the laser is being reflected back. Search for a cell to image with several gold particles in view. Set a region of interest that encloses the cell (or a region within the cell) and the gold particles.
Note: TIRF decreases the penetration depth of the excitation laser and reduces the out of focus background signal. Additionally, drift correction is likely to be more accurate when more gold particles are in view. - If available, engage the autofocus system to correct for sample drift in the z-direction. Otherwise, adjust the focus manually throughout the acquisition if the image goes out of focus.
- Begin acquisition with the 405 nm laser off and the 561 nm laser on (~1 kW/cm2) in case sufficient activation is occurring already (typically if expression levels are high). Otherwise, turn on the 405 nm laser at the lowest factory power setting (0.02 mW or 0.01 W/cm2) and increase gradually (0.1 mW at a time) as necessary until there are several tens of molecules per frame or so that single molecules are well separated.
- As data acquisition continues, gradually increase 405 nm laser power to keep the spot density roughly constant.
Note: At lower 405 nm excitation power, some PAmCherry1 can already be activated. As these molecules photobleach, the population of remaining photoactivatable PAmCherry1 molecules decreases, requiring a higher photon flux to maintain the same density of molecules emitting fluorescence in each frame. - Continue image acquisition until high 405 nm power (2.5 – 10 W/cm2) does not activate more activation events.
Note: The total acquisition time depends on the expression level and efficiency of the complementation.
- Process the images
Note: There are many open source software options for image processing. Examples are ThunderSTORM (https://code.google.com/p/thunder-storm/) and QuickPALM (https://code.google.com/p/quickpalm/). The typical data processing procedures are briefly illustrated here using a custom Matlab package called wfiread for processing PALM data as an example. However, future revisions may not exactly follow what is described here. For image processing with other software, please refer to the user documentations.- Download the image processing software (Supplemental Code File) or the latest version at http://www.ohsu.edu/nan. Open Matlab and load the wfiread software (which is already put in the default path).
- View the raw image sequence and determine the region of interest. Select the area of the stack to be processed by left clicking and dragging a box around the desired area. If the region of interest was not reduced during acquisition (to about 256×256 pixels), select a smaller area to lessen the compute time. To deselect an area and processes the entire frame, right click anywhere in the image.
- Enter the range of frames to be processed.
- Select a gold particle (one that is isolated and uniform in shape) by left clicking on the image and dragging a small box around it. Under Particle Tracking, click the Track button. A graph will appear that shows the position of the selected gold particle across the stack of images, depicting the extent of the drift.
- Repeat this process to track as many gold particles as possible and determine the ones that track together (the particles will be color coded). Ideally the overall drift is on the order of one pixel at most.
- Individually select the gold particles that tracked together one at a time and click the Add Marker button under Particle Tracking. A green cross will appear signifying that it has been added as a marker and will be used to correct for drift.
- Adjust the Sigma Range, Smoothing Range and Threshold as necessary by changing the values slightly. Click the Find Particle button to test the settings. The particles that will be processed will be boxed and those that are not will be left out. The PAmCherry1 molecules, particles that are relatively round and bright, should be selected.
- Start processing the images by clicking the Make Coord File button and save the file.
Note: The program will go through each frame within the defined frame range, find all fluorescent spots, and perform Gaussian fitting to find the centroid coordinates. A .cor file will be generated storing all coordinates and other fitting parameters of the processed single molecule images.
- Post-process the images and render the PALM image
Note: Other software may directly render the image after coordinate extraction.- In Matlab, launch the ‘palm’ package and load the .cor file just created.
- Before rendering the PALM image using the coordinates, sort the individual coordinates (each from a ‘localization event’). The optimal sorting values may vary depending on the setup and fluorophore.
- For PAmCherry1, use the following values: Combining Frame – 8; Combining Distance (nm) – 100; Minimum RMS – 4; Minimum Fit Goodness – 0.25; and Max. Eccentricity – 1.4. See the Discussion section for additional explanation of these parameters.
- Click the Sort button to generate a new set of coordinates ready for rendering high resolution images.
- Enter values for proper rendering of the final image such as the raw pixel size (nm), the desired feature size (nm) in the rendered image, and the pixel size for the rendered image.
Note: The raw pixel size must be determined for each setup. The rendered feature size can be set arbitrarily, but is typically set at a value slightly higher than the average localization precision. For PAmCherry1, the average localization precision is around 18 nm, so a feature size of 20 – 30 nm is appropriate. Of note, the localization precision was calculated by taking the standard deviation of the localizations of the same molecule across multiple frames22 and not by dividing the diffraction limit with the square root of detected number of photons. As for the pixel size of the rendered image, 10 nm is a good starting point; setting this value too low will result in unnecessarily large image files for unmagnified views. - Click the Render button to generate the PALM image. Use the +/- magnifying icons in the tool bar of the figure window to zoom in and out.
- Optional: Perform cluster analysis of the reconstructed PALM image using either Ripley’s K test or other mechanisms such as simulation-aided DBSCAN (SAD)23. Note: In the custom palm package, both Ripley’s K and SAD analysis are already built in; for coordinates generated from other software, the same analyses may be performed with additional custom scripts.
3. Single Molecule Tracking in Live Cells
- Treat the tissue culture surface and plate the cells as described in Protocol 2. Since the temperature and/or CO2 controlled stage may require a certain culture dish, ensure sure that the coverglass has the appropriate thickness (0.17 mm) for the microscopy setup.
- Transfect cells if doing a transient expression and perform any treatments needed for the experiment, such as tetracycline to induce expression, and incubate as necessary. This is also the same as described in Protocol 2.
- Place the culture dish on an on-stage incubator. Let the dish settle on the stage for a few minutes until the temperature and CO2 concentration stabilize every time after mounting the culture dish or moving to a new region of interest. Block lasers at this step. If CO2 control is not available, change to a CO2 independent media right before imaging, such as Leibovitz’s L-15.
Note: Phenol-red-free medium is recommended for depressing background fluorescence.
- Acquire images as in Protocol 2. However, set an appropriate exposure time (typically 25-50 msec for PAmCherry1).
Note: The molecule density must be lower than for fixed cells so that trajectories can be recorded without overlapping with each other. The specified few tens of molecules is typical for a 256×256 pixel acquisition at a pixel size of about 160 nm. The 561 nm laser power density was set to 0.8 kW/cm2 to maintain a good signal-to-noise ratio while decreasing the phototoxicity to cells and increasing the average trajectory length. - Process the images.
- Extract coordinates of single molecules with the wfiread package as described in Protocol 2, or with another package.
- Reconstruct single particle trajectories using various single particle tracking (SPT) packages based on different algorithms found elsewhere24. Note: Alternatively, this step may be accomplished using home built Matlab package (possibly available in future revisions at http://www.ohsu.edu/nan.
- Optional: After reconstruction, use an SPT package24 to calculate displacement and diffusion constants from the trajectories. Additionally, use variational Bayes single-particle tracking (vbSPT)25 to determine diffusion states of the target proteins. vbSPT Matlab package and documentation can be found at its official Sourceforge site: http://vbspt.sourceforge.net/.
Representative Results
The BiFC-PALM example shown is KRas G12D mutant interacting with the Ras binding domain (RBD) of CRaf (Figure 1A). As discussed, the RN or RC fragments were not tagged to the C-terminus of Ras because it would disrupt the membrane localization and hence the biological activity of Ras. This reduced the possible combinations from eight to four (Figure 1B). Each of these four combinations was introduced into U2OS cells using lentiviral infection. The cells were fixed as detailed in the protocol, and the BiFC signals were evaluated using a PALM setup. Cells with positive BiFC signals were identified by the abrupt increase in fluorescence when the 405 nm laser was turned on; the 561 nm laser was on throughout the imaging experiment. This abrupt change in fluorescence is due to the photoactivation of BiFC-reconstituted PAmCherry1 upon illumination with the 405 nm laser. Multiple regions in the sample were evaluated using this approach, and the BiFC signal intensity was calculated by averaging the increase in pixel intensities before and after a high-powered pulse from the 405 nm laser.
As seen in Figure 1C, out of the four possible configurations, two configurations (namely RN-Ras/RC-Raf RBD and RN-Ras/Raf RBD-RC) had strong BiFC signals. Another configuration (RC-Ras/Raf RBD-RN) had weak signal, and one had no signal. For all subsequent experiments, the RN-Ras/Raf RBD-RC configuration (upper right in Figure 1C) was used. As a negative control, a point mutation (R89L) in the Ras binding domain of Raf was introduced and the BiFC efficiency using the same configuration was tested. This mutation was known to disrupt Raf binding to Ras; consistently, the mutation greatly reduced the BiFC signal (Figure 1D).
Since PAmCherry1 molecules generated through BiFC showed similar photoactivation properties to the original PAmCherry110, this allows for PALM imaging of BiFC samples using the same experimental settings as with the parent PAmCherry1. An example PALM image of cells with strong BiFC signal after infection with RN-Ras and Raf RBD-RC is shown in Figure 2A.
When zoomed in (Figure 2A bottom left and insets, with magnified areas boxed), individual molecules and their nanoscale spatial distribution can be clearly seen. Of note, each dot in these PALM images represents one putative Ras-Raf RBD complex tagged with a PAmCherry1 molecule. For comparison, the right side of Figure 2B was simulated low resolution images of the same fields of view, where the clusters became completely obscure. The observation of Ras-Raf RBD clusters is consistent with previous observations on the clustering behavior of Ras and Raf.
With live cells expressing BiFC reconstituted PAmCherry1, smt-PALM was performed to acquire diffusion trajectories of individual Ras-Raf RBD complexes, similarly to previously described10. Under continuous illumination with 561 nm and 405 nm lasers, individual PAmCherry1 molecules stochastically switch on and last a few frames before entering dark states (in part due to photobleaching). In this period of time, the molecules exhibited at least two different diffusion behaviors: an immobile state (Figure 2B, molecule 1) and a mobile state (Figure 2B, molecule 2). Both types of trajectories are clearly present in the (x, y) plot shown in Figure 2C, where the trajectories of multiple molecules are recorded. The same heterogeneous distribution of diffusion states can be inferred from the histogram of molecular displacement between successive frames. Typically, 10,000 – 100,000 diffusion trajectories can be acquired from each cell; this large number allows for more rigorous statistical analysis of the diffusion states, for example with the vbSPT algorithm25.
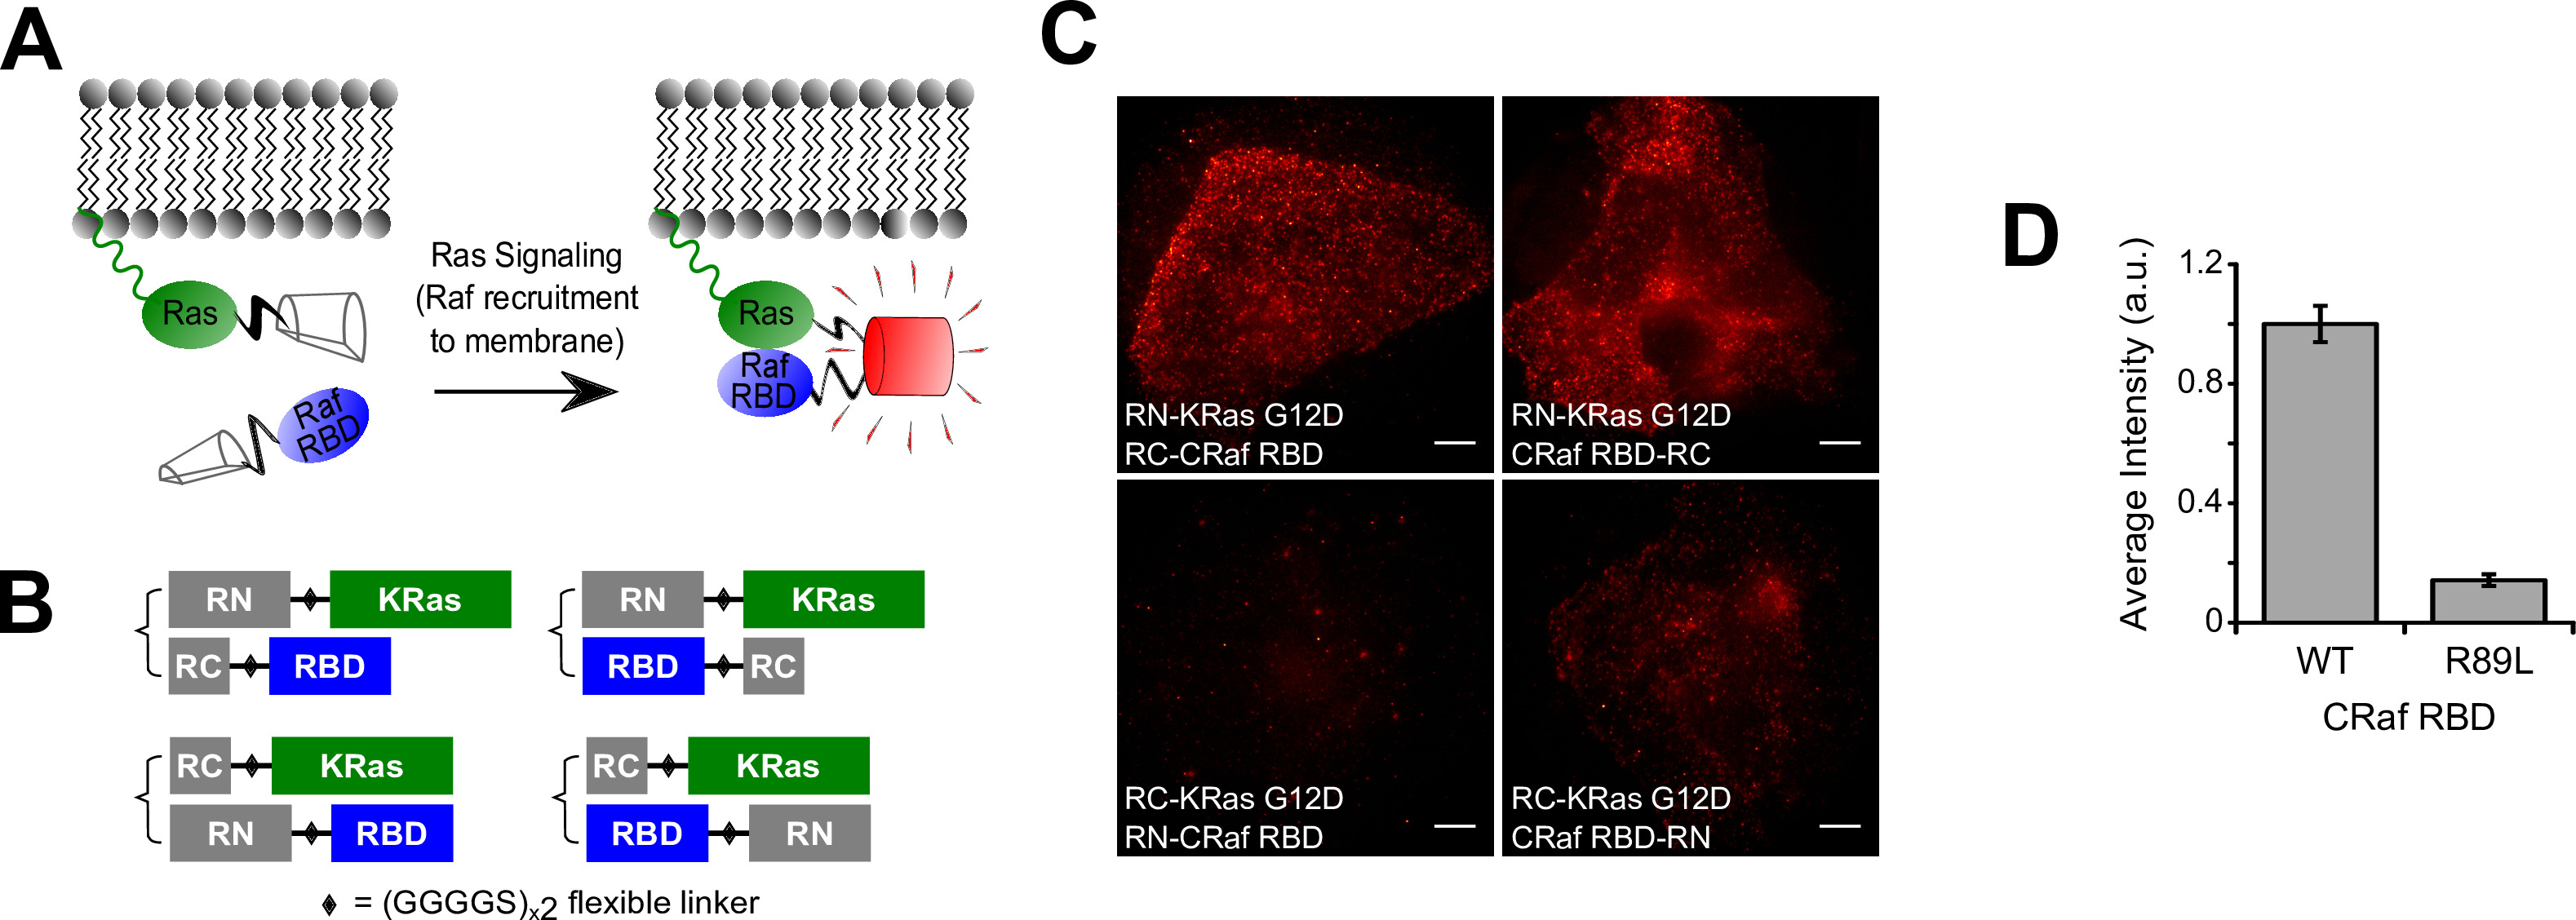
Figure 1. BiFC-PALM experimental design of Ras-Raf interaction. (A) Ras is a membrane bound protein that recruits Raf when active. When non-fluorescent split PAmCherry1 fragments are attached to Ras and Raf, the interaction brings the fragments together and complementation occurs, resulting in a functional fluorescent protein. (B) Since tagging Ras at its C-terminus would disrupt its membrane localization, the number of configurations tested for Ras-Raf BiFC-PALM was reduced from eight to four. (C) Images of U2OS cells expressing the tested configurations taken with a TIRF microscope. To gauge the BiFC efficiency of each configuration, cells are given the same high dosage of 405 nm light while being excited with 561 nm light. (D) Introducing the R89L mutation into the Raf RBD greatly reduced the BiFC signal of the RN-KRas G12D/CRaf RBD-RC configuration (upper right in C, n = 5-8). Error bars are SEM in (D). Scale bars in (C), 10 µm. RN = PAmCherry1 N-terminal fragment, RC = PAmCherry1 C-terminal fragment, and RBD = Ras binding domain. Please click here to view a larger version of this figure.
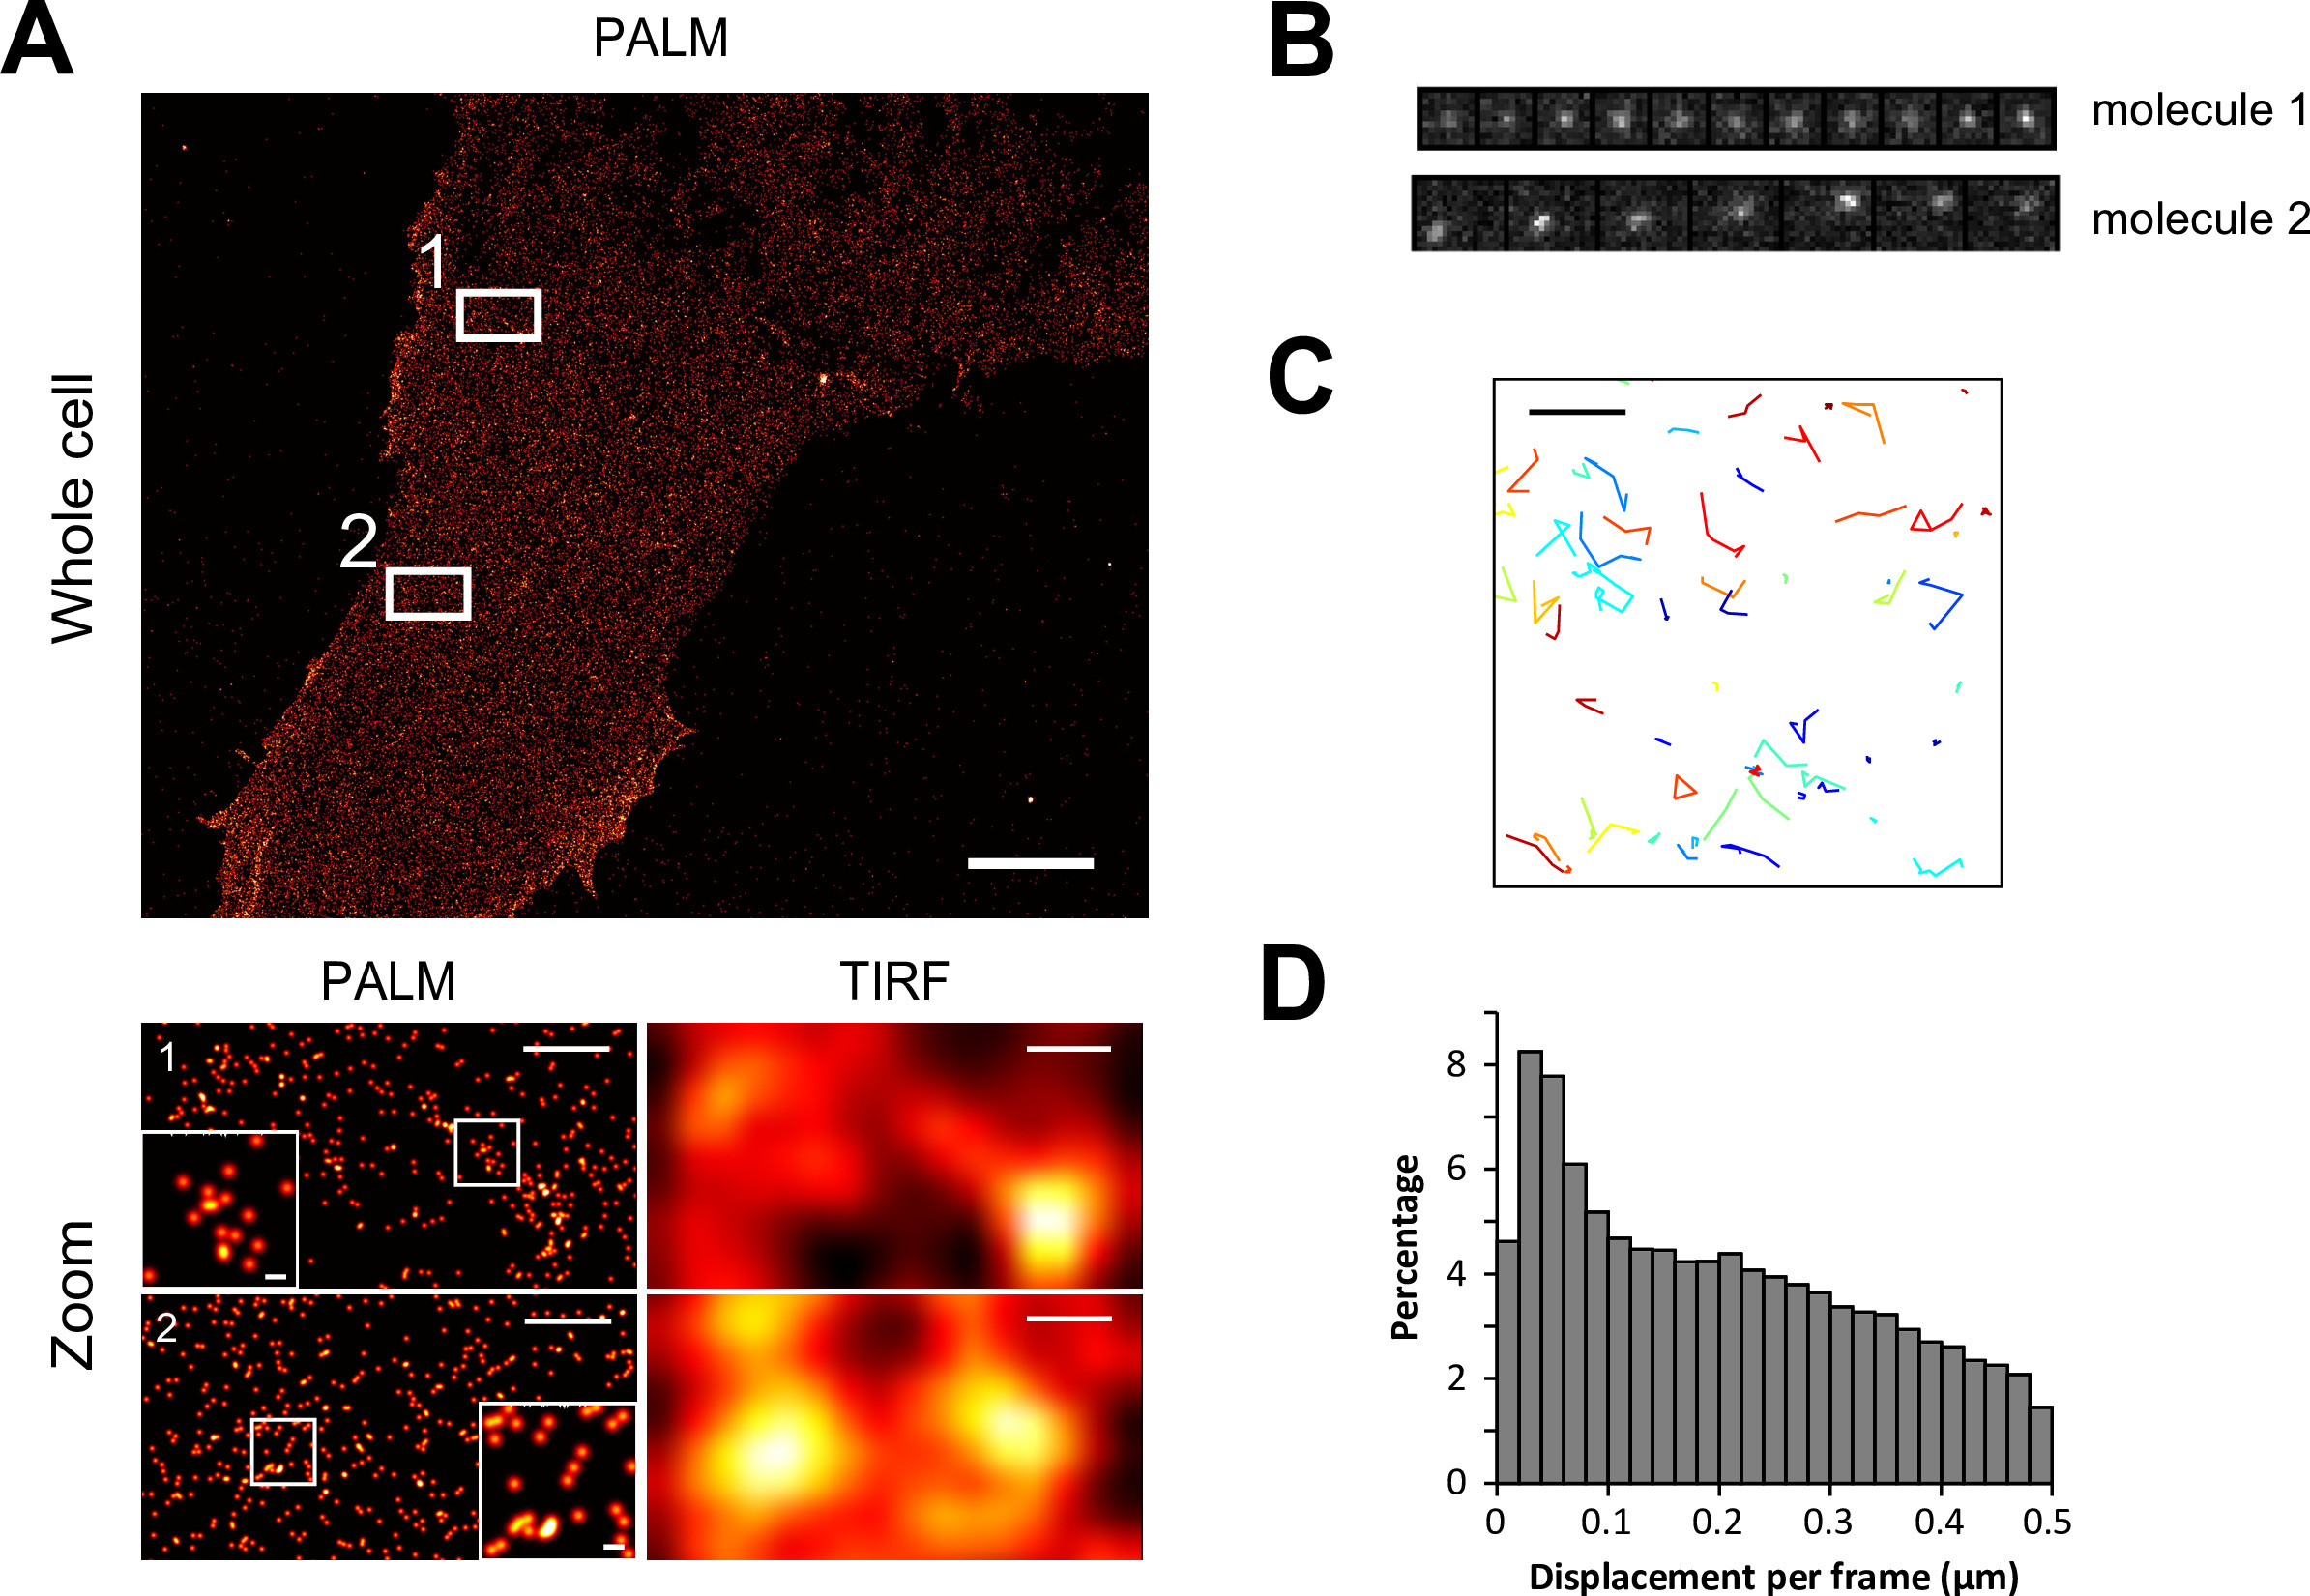
Figure 2. BiFC-PALM of U2OS cells expressing the RN-KRas G12D/CRaf RBD-RC configuration. (A) An entire PALM image is shown above. Lower panels are magnified views of the boxed regions in the upper image as indicated. Insets are higher magnifications of the boxed regions in the respective magnified views. The right side of the lower panels (labeled TIRF) are representations of the images on their left as though taken with a diffraction-limited microscope. (B) Successive frames from a live cell smt-PALM experiment that depict slow (1) and fast (2) moving Ras-Raf complexes. (C) Output from a smt-PALM experiment showing diffusion trajectories of Ras-Raf complexes within a small area of a cell. (D) Histogram of displacements per frame of Ras-Raf complexes from a smt-PALM experiment. Scale bars in (A), 5 µm top, 500 nm bottom, 50 nm insets, and (C), 1 µm. RN = PAmCherry1 N-terminal fragment, RC = PAmCherry1 C-terminal fragment, and RBD = Ras binding domain. Please click here to view a larger version of this figure.
| Primer sequence (5’ to 3’) | |
| Cloning plasmid for insertion at N-terminus reverse | CATGGTACCGAGCTCCTGCAGC |
| RN at N-terminus forward | GTGAGCAAGGGCGAGGAGGATAA |
| RC at N-terminus forward | GGCGCCCTGAAGGGCGA |
| Cloning plasmid for insertion at C-terminus forward | TAAAAGGGTGGGCGCGCC |
| RN from C-terminus reverse | GTCCTCGGGGTACATCCGCTC |
| RC from C-terminus reverse | CTTGTACAGCTCGTCCATGCCG |
Table 1. Primers for linearizing cloning plasmids containing PAmCherry1 fragments. The cloning plasmids containing RN and RC can be linearized with inverse PCR at the point of insertion at either the N- or C-terminus of the fragments. Sequences are listed 5’ to 3’.
| Overhangs for gene of interest primers (5' to 3') | |
| N-terminal insertion RN or RC forward | GAGCTCGGTACCATG |
| N-terminal insertion RN reverse | ACTTCCACCTCCACCACTACCTCCACCTCCCTCGCCCTTGCTCAC |
| N-terminal insertion RC reverse | ACTTCCACCTCCACCACTACCTCCACCTCCGCCCTTCAGGGCGCC |
| C-terminal insertion RN forward | ATGTACCCCGAGGACGGAGGTGGAGGTAGTGGTGGAGGTGGAAGT |
| C-terminal insertion RC forward | GACGAGCTGTACAAGGGAGGTGGAGGTAGTGGTGGAGGTGGAAGT |
| C-terminal insertion RN or RC reverse | GCGCCCACCCTTTTA |
Table 2. Overhangs for gene of interest primers that match Table 1 primers. The 15 base pairs of homology for the ligation-independent reaction is generated from primer overhangs. Additionally, the overhangs include the sequence for a (GGGGS)x2 flexible linker. The flexible linker sequence can be added to the primers in Table 1 instead. Sequences are listed 5’ to 3’.
Discussion
BiFC has been a commonly used technique for detecting and visualizing PPIs in cells, while PALM is a recent single molecule superresolution microscopy technique that enables nanoscale imaging of intact biological samples. The combination of BiFC with PALM achieved selective imaging of PPIs inside a cell with nanometer spatial resolution and single molecule sensitivity. BiFC-PALM extends the utility of both techniques, and as demonstrated in this work, shows great promise in revealing the molecular details of PPIs in their native cellular context. In particular, the nanometer resolution allows for detailed investigation of the spatial and temporal regulation of specific PPIs at the molecular scale, which has been a challenge in biomedical research. However, as mentioned before, BiFC-PALM is limited by the irreversibility of the complementation and slow chromophore maturation.
Split PAmCherry1 was used to demonstrate the principle and utility of BiFC-PALM. PAmCherry1 has been widely used in PALM experiments for its excellent photophysical properties. An additional benefit of using PAmCherry1 as the BiFC probe is the low background and high specificity and efficiency in protein reconstitution at 37 °C when coupled to PPIs. For these reasons, the split PAmCherry1 BiFC probe is expected to become a valuable resource applicable to many different biological investigations involving high resolution imaging of PPIs. In addition to PAmCherry1, a photoconvertible fluorescent protein, mEos3.2, was also split for BiFC-PALM26. Because their emission spectrums overlap, mEos3.2 and PAmCherry1 cannot be used together, but green PA-FPs have recently been reported27, opening the possibility for two-color nanoscale superresolution imaging of PPIs.
As in conventional BiFC, a critical step in implementing BiFC-PALM is the design and cloning of the fusion constructs. The fact that up to eight different expression constructs have to be cloned and eight BiFC pairs have to be tested in each attempt to implement BiFC and BiFC-PALM can be a tedious, if not prohibitive, process. Nevertheless, as illustrated in the Ras-Raf example, prior knowledge on the biochemical and structural properties of the proteins of interest often can be used to guide an optimized design of the fusion constructs with a reduced number of BiFC pairs to be tested. That said, currently there is not a universal guideline to ensure that a BiFC (hence BiFC-PALM) experiment would work; much of it is still an art.
While BiFC and BiFC-PALM are typically used to investigate heterodimer formation between two proteins, it is also feasible to study homodimer formation using these approaches, in which case the two candidate proteins would be the same. However, as such, two proteins with the same fragment can interact but not result in BiFC signal. Despite each construct acting as a competitive inhibitor to the other, such interactions are reversible, while interactions resulting in successful complementation would accumulate due to the irreversibility. In general, there could be a reduction in signal if there is a drastic difference between expression levels of each construct. Therefore, the expression levels of the two constructs may need to be determined when comparing fluorescence intensities (e.g., between wild type and mutant homodimer samples) at endogenous expression levels. This is perhaps why BiFC experiments are commonly performed with transient transfections and overexpression of the constructs.
Last but not least, all BiFC experiments must be confirmed with proper controls. If BiFC signal is present, there is a chance that the signal is non-specific (i.e., the fragments are reconstituting on their own and not because of the PPI). One negative control is mutations in either or both proteins that are known to disrupt the interaction, which should result in a significant loss of BiFC signal. If such a point mutation is unknown, other methods can be used, such as introducing a competitive binding partner to one of the proteins and see if there is a concomitant decrease in signal.
The more difficult situation is troubleshooting a lack of BiFC signal, or false negatives. In such cases, it is important to include positive controls during the cloning process, such as a GFP control during transfections. Western blots can be run to check for expression of the constructs. If these factors are normal, other factors may need to be changed, such as the linker length and/or sequence, or a different BiFC configuration should be considered.
As for the PALM portion, a number of parameters must be considered when processing the images. Step 2.4.2.1 describes parameters used for sorting the coordinates and generating the final PALM image. The first two parameters, Combining Frame and Combining Distance, define if two localization events are both within 100 nm and appear less than 8 frames (at 100 msec/frame) or ~0.8 sec apart as we described previously23. If so, then they will be considered to arise from the same molecule, and their coordinates will be combined by averaging. Dark states with lifetimes much greater than 0.8 sec for PAmCherry1 appears to be rare; as the event of a fluorophore recovering from a long-lived dark state is indistinguishable from a different molecule at a proximal distance emitting fluorescence, two localization events are considered to be arising from the same molecule only if they appeared within a certain number of frames and physical distance. Empirically, a ‘combine frame’ setting at 8-12 frames (0.8-1.2 sec) appears to be optimal under our experimental conditions. Minimum RMS defines the minimal ratio between fitting amplitude and the standard deviation of residue noise after the fitting. These values are recorded in the .cor file during coordinate extraction.
In summary, BiFC-PALM combines the advantages of BiFC and PALM and enables investigation of PPIs at much greater detail than what has been achieved previously. With considerations for the factors above and with proper control experiments, BiFC-PALM should be a useful tool for studying PPIs in a broad range of biological settings.
Divulgations
The authors have nothing to disclose.
Acknowledgements
The authors thank Drs. Steven Chu and Joe W. Gray for helpful discussions, Henry Marr for his initial work on the BiFC-PALM project, and Alexis Shoemaker for her technical assistance. This work is supported by startup funds to X.N. from OHSU. Research in the Nan laboratory was also supported by NIH 5U54CA143836-05, the Damon Runyon Cancer Research Foundation, the M. J. Murdock Charitable Trust, and the FEI company.
Materials
| TIRF Microscope | Nikon | ||
| 60X oil immersion TIRF objective with 1.49 NA | Nikon | ||
| EMCCD camera | Andor | iXon Ultra 897 | |
| 561 nm laser | Coherent | ||
| 405 nm laser | Coherent | ||
| 561 nm dichroic mirror | Semrock | Di01-R405/488/561/635-25×36 | |
| 561 nm filter | Semrock | FF01-525/45-25 | |
| 405/561 nm notch filter | Semrock | NF01-405/488/568-25 | |
| Temperature and CO2 controlled stage | |||
| pENTR-D-TOPO-PAmCherry1_1-159-MCS | Addgene | 60545 | |
| pENTR-D-TOPO-PAmCherry160-236-MCS | Addgene | 60546 | |
| pcDNA3.2-DEST | Life Technologies | 12489-019 | |
| pLenti-DEST | Addgene | http://www.addgene.org/Eric_Campeau/ | |
| Phusion High-Fidelity DNA Polymerase | Thermo Scientific | F-531 | |
| In-Fusion HD Cloning | Clontech | 639649 | |
| LR Clonase | Life Technologies | 11791 | |
| Vira Power Lentivirus Packaging | Life Technologies | K497500 | |
| X-tremeGENE Transfection Reagent | Roche | 13873800 | |
| Lab-Tek II Chambered Coverglass | Thermo Scientific | 155409 | #1.5 glass bottom dishes |
| U2OS cells | ATCC | HTB-96 | |
| 293T/17 cells | ATCC | CRL-11268 | |
| DMEM with phenol red | Life Technologies | 11995 | |
| DMEM no phenol red | Life Technologies | 21063 | |
| Fetal bovine serum | Life Technologies | 10082 | |
| Leibovit's L-15, no phenol red | Life Technologies | 21083-027 | |
| Reduced serum medium | Life Technologies | 31985 | |
| Phosphate Buffered Saline | Life Technologies | 14040 | |
| Syringe | BD Biosciences | 309604 | |
| Syringe filter | Millipore | SLHV033RB | |
| Lentiviral concentrator | Clontech | 631231 | |
| Retroviral concentrator | Clontech | 631455 | |
| 10 cm culture dish | BD Biosciences | 353003 | |
| 6-well culture plate | BD Biosciences | 353046 | |
| Polybrene | Sigma | 107689 | |
| Puromycin | Life Technologies | A11138 | |
| G-418 | Calbiochem | 345812 | Neomycin |
| Doxycyline | Fisher | BP2653 | |
| Tris base | Fisher | BP152 | |
| EDTA | Sigma | EDS | |
| Sodium Hydroxide | Sigma | S5881 | |
| Paraformaldehyde | Sigma | 158127 | |
| Glutaraldehyde | Sigma | G6257 | |
| PIPES | Sigma | P6757 | |
| HEPES | Sigma | H4034 | |
| EGTA | Sigma | 3777 | |
| Magnesium Sulfate | Sigma | M2643 | |
| Potassium Hydroxide | Sigma | 221473 | |
| Sodium chloride | Fisher | BP358 | |
| Magnesium chloride | Fisher | M33 | |
| 100 nm gold particles | BBI Solutions | EM.GC100 | |
| Molecular grade water | Life Technologies | 10977 | |
| Dpn1 | New England Biolabs | R0176 | |
| PCR purification kit | Qiagen | 28104 | |
| Miniprep kit | Qiagen | 27104 | |
| Midiprep kit | Macherey-Nagel | 740410 | |
| 0.6 mL microcentrifuge tubes | Fisher | 05-408-120 | |
| 1.5 mL microcentrifuge tubes | Fisher | 05-408-137 | |
| 15 mL tubes | Fisher | 05-539-12 | |
| 5 mL polypropylene round-bottom tubes | BD Biosciences | 352063 | |
| 14 mL polypropylene round-bottom tubes | BD Biosciences | 352059 | |
| 50 mL tube | BD Biosciences | 352070 | |
| PCR tube | GeneMate | C-3328-1 | |
| SOC medium | Life Technologies | 15544 | |
| LB broth | BD Biosciences | 244610 | |
| Kanamycin sulfate | Fisher | BP906 | |
| Competent cells | Life Technologies | C4040 | |
| Matlab | Mathworks |
References
- Braun, P., Gingras, A. C. History of protein-protein interactions: From egg-white to complex networks. Proteomics. 12, 1478-1498 (2012).
- Lasserre, R., et al. Raft nanodomains contribute to Akt/PKB plasma membrane recruitment and activation. Nat. Chem. Biol. 4 (9), 538-547 (2008).
- Hu, C. D., Chinenov, Y., Kerppola, T. K. Visualization of interactions among bZIP and Rel family proteins in living cells using bimolecular fluorescence complementation. Mol. Cell. 9 (4), 789-798 (2002).
- Kerppola, T. K. Bimolecular fluorescence complementation (BiFC) analysis as a probe of protein interactions in living cells. Annu. Rev. Biophys. 37, 465-487 (2008).
- Kodama, Y., Hu, C. D. Bimolecular fluorescence complementation (BiFC): a 5-year update and future perspectives. Biotechniques. 53, 285-298 (2012).
- Lingwood, D., Simons, K. Lipid Rafts As a Membrane-Organizing Principle. Science. 327 (5961), 46-50 (2009).
- Tian, T., Harding, A., Inder, K., Plowman, S., Parton, R. G., Hancock, J. F. Plasma membrane nanoswitches generate high-fidelity Ras signal transduction. Nat. Cell Biol. 9 (8), 905-914 (2007).
- Betzig, E., et al. Imaging intracellular fluorescent proteins at nanometer resolution. Science. 313 (5793), 1642-1645 (2006).
- Hess, S. T., Girirajan, T. P. K., Mason, M. D. Ultra-high resolution imaging by fluorescence photoactivation localization microscopy. Biophys. J. 91 (11), 4258-4272 (2006).
- Nickerson, A., Huang, T., Lin, L. J., Nan, X. Photoactivated Localization Microscopy with Bimolecular Fluorescence Complementation (BiFC-PALM) for Nanoscale Imaging of Protein-Protein Interactions in Cells. PloS one. 9 (6), e100589 (2014).
- Manley, S., Gillette, J. M., Lippincott-Schwartz, J. Single-particle tracking photoactivated localization microscopy for mapping single-molecule dynamics. Methods Enzymol. 475, 109-120 (2010).
- Shyu, Y. J., Hu, C. D. Fluorescence complementation: an emerging tool for biological research. Trends Biotechnol. 26 (11), 622-630 (2008).
- Fan, J. Y., et al. Split mCherry as a new red bimolecular fluorescence complementation system for visualizing protein-protein interactions in living cells. Biochem. Biophys. Res. Commun. 367 (1), 47-53 (2008).
- Kerppola, T. K. Design and implementation of bimolecular fluorescence complementation (BiFC) assays for the visualization of protein interactions in living cells. Nat. Protoc. 1, 1278-1286 (2006).
- Gomez-Martinez, M., Schmitz, D., Hergovich, A. Generation of stable human cell lines with Tetracycline-inducible (Tet-on) shRNA or cDNA expression. J. Vis. Exp. March. (73), e50171 (2013).
- Robida, A. M., Kerppola, T. K. Bimolecular fluorescence complementation analysis of inducible protein interactions: effects of factors affecting protein folding on fluorescent protein fragment association. J. Mol. Biol. 394 (3), 391-409 (2009).
- Ding, Y., et al. Ratiometric biosensors based on dimerization-dependent fluorescent protein exchange. Nat. Methods. 12 (3), (2015).
- Seidman, C. E., Struhl, K., Coligan, J. E. Introduction of plasmid DNA into cells. Curr. Protoc. Protein Sci. Appendix 4, 4D (2001).
- Morrison, S. L., Coligan, J. E., et al. Preparing frozen bacterial stocks. Curr. Protoc. Immunol. Appendix 3, Appendix 3M (2001).
- Campeau, E., et al. A versatile viral system for expression and depletion of proteins in mammalian cells. PloS One. 4 (8), e6529 (2009).
- Liu, H., Naismith, J. H. An efficient one-step site-directed deletion, insertion, single and multiple-site plasmid mutagenesis protocol. BMC Biotechnol. 8 (91), (2008).
- Deschout, H., et al. Precisely and accurately localizing single emitters in fluorescence microscopy. Nat. Methods. 11 (3), 253-266 (2014).
- Nan, X., et al. Single-molecule superresolution imaging allows quantitative analysis of RAF multimer formation and signaling. Proc. Natl. Acad. Sci. USA. 110 (46), 18519-18524 (2013).
- Chenouard, N., et al. Objective comparison of particle tracking methods. Nat. Methods. 11 (3), 281-289 (2014).
- Persson, F., Lindén, M., Unoson, C., Elf, J. Extracting intracellular diffusive states and transition rates from single-molecule tracking data. Nat. Methods. 10 (3), 265-269 (2013).
- Liu, Z., et al. Super-resolution imaging and tracking of protein–protein interactions in sub-diffraction cellular space. Nat. Commun. 5, 1-8 (2014).
- Xia, P., et al. Super-resolution imaging reveals structural features of EB1 in microtubule plus-end tracking. Mol. Biol. Cell. 25 (25), 4166-4173 (2014).
