By using protocols 2, 3, and 4, time-lapse imaging of gonads in wild type C. elegans adults is performed (strain OD58 (unc-119(ed3) III; ltIs38[pAA1; pie-1::GFP::PH(PLC1delta1) + unc-119(+)]), expressing a membrane marker from a germline promoter). Focusing on the turn of the gonad, a 3D model of the germ cells is generated from the microscopy data (Figure 2). This model allows to analyze changes in cell size while the cells transit form the distal to the proximal arm, reveals the organization of the rachis and the size of the contacts of individual cells to the rachis (see also http://www.wormatlas.org/hermaphrodite/germ%20line/Germframeset.html).
Next, protocols 1, 3, and 5 are used to perform long-term time-lapse microscopy of C. elegans embryos (strain CHP52 which is a cross of strain RW10226 (unc-119(ed3) III; itIs37[pie-1p::mCherry::H2B::pie-1 3'UTR + unc-119(+)]; stIs10226[his-72 promoter HIS-24::mCherry translational fusion with let-858 3' UTR + unc-119(+)]) and strain LP162 (nmy-2(cp13[nmy-2::gfp + LoxP]) I.). In this strain, it is possible to follow both nuclei (through the mCherry-histone fusion proteins) and cell division remnants (through the genomically modified non-muscle myosin II locus where a GFP has been integrated in frame through the CRISPR/Cas9 technology19) simultaneously when using two-color time-lapse microscopy (Figure 3, left panels). The models obtained by lineaging of both structures in Endrov show the previously described stereotyped pattern of cell division remnant inheritance13,14. Moreover, from the lineaging data, the tracks for each cell and cell division remnant (Figure 3, right panels) and the time of cell division remnant persistence (based on the NMY-2GFP-signal) as well as the correlation to the cell division timing can be obtained (Figure 4, shown for the ABa lineage only). When using a plasma membrane marker in addition, it is also possible to observe the time point of cell division remnant internalization.
Finally, by using protocols 1, 3, and 6, short-term time-lapse microscopy with high temporal resolution (5s intervals between recording a z-stack) of cortical non-muscle myosin II (NMY-2GFP) is performed. The focus here lies on the differences in the dynamics of cortical polarizing flow by comparing this flow between wild type and embryos RNAi-depleted for the Rho GTPase activating protein RGA-320,21. Similar to recent observations22, flow in wild type embryos is predominantly along the long axis of the embryo (Figure 5, left panels), while flow in the rga-3 RNAi embryo is orthogonal to this axis. This is readily apparent from overlaying consecutive time points or from the PIV analysis (Figure 5, bottom panels).
To observe these differences, it is important to choose a sampling interval so that cortical flow particles can be resolved unambiguously for accurate interpretation of data. Smaller time intervals (≤5 sec) are recommended to avoid large displacements and missing vectors. The interrogation window should be large enough to accommodate the size of the particles to be analyzed (cortical granules). Overlap between neighboring interrogation windows allows to reduce the vector spacing and thus increases the number of vectors in the grid.
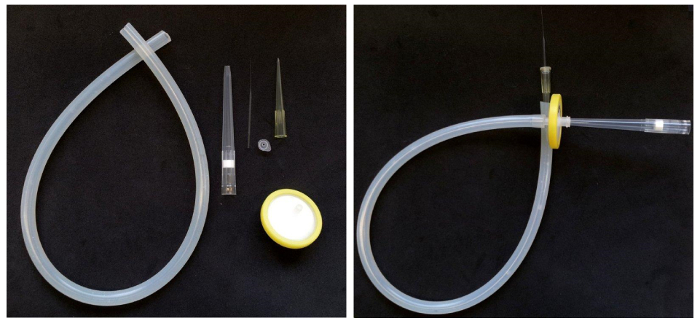
Figure 1. Assembling a mouth pipette. Left: Parts required to assemble a mouth pipette with filter. Right: The assembled pipette. Please click here to view a larger version of this figure.
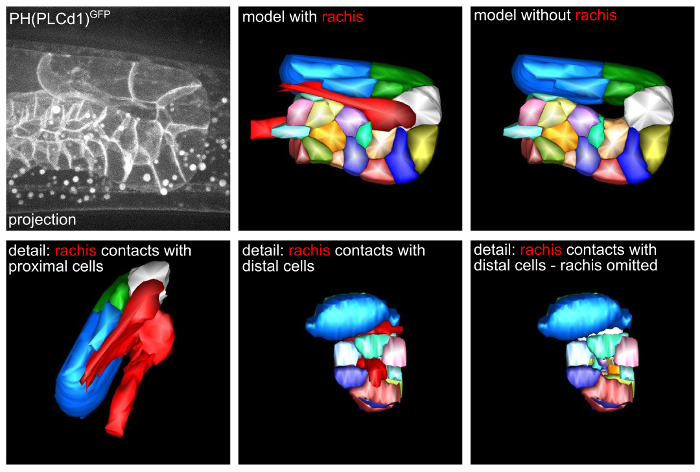
Figure 2. A 3D model of the gonad turn region. Top left: 3D projection of a single time point from time-lapse microscopy data. Top middle and right: 3D models of the microscopy data. Bottom: Details of cell-rachis contacts. Please click here to view a larger version of this figure.
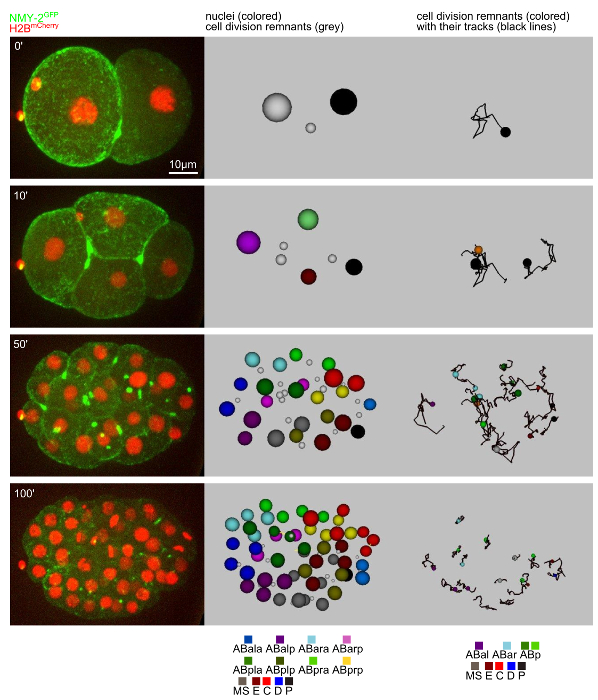
Figure 3. Tracking of nuclei and cell division remnants. Left: 3D projections from time-lapse microscopy data. Middle: Snapshots of the model obtained from tracking both nuclei (colored spheres) and cell division remnants (grey spheres). Right: Snapshots from cell division remnant tracking. The paths for the remnants are also shown. Please click here to view a larger version of this figure.
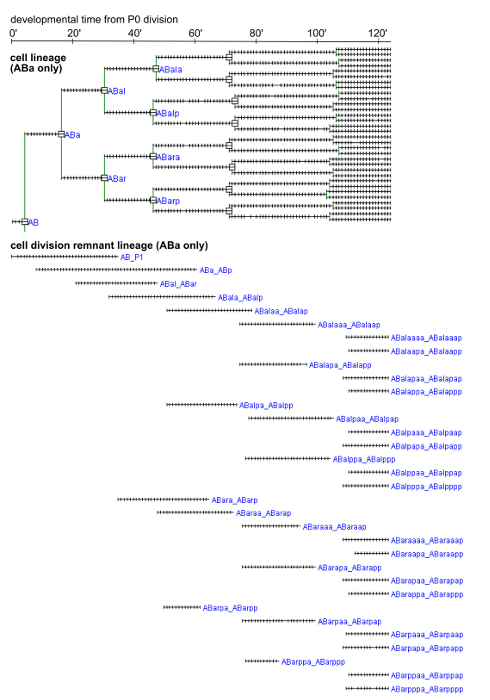
Figure 4. Cell and cell division remnant lineages for the ABa sublineage. Lineages from a representative embryo are shown. Cell divisions are marked by squares. Each tick mark corresponds to 1 min. The cell division remnants were named after the daughters that arise from the division during which the remnant is generated. Please click here to view a larger version of this figure.
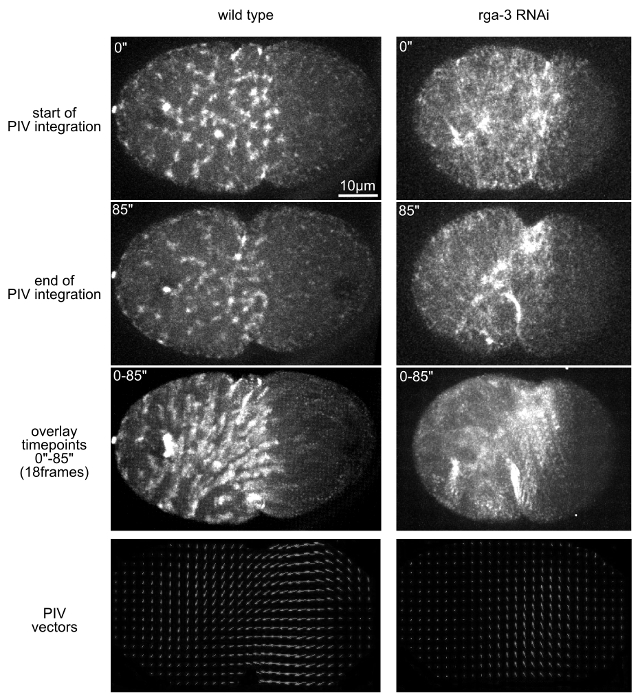
Figure 5. Analysis of cortical contractile flow with PIV. Top: 3D projection stills from time-lapse microscopy that depict the start (first row) and end (second row) of the time window used to calculate the vector field with PIVlab. The third row of panels shows the overlay of all time points of the time window. Bottom: Vector fields obtained by PIVlab. Please click here to view a larger version of this figure.
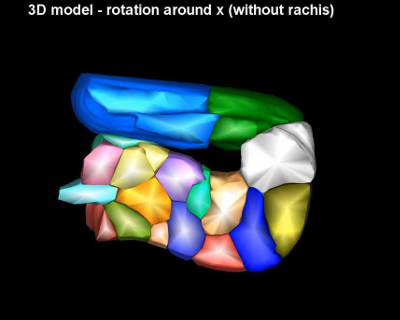
Video 1 – related to Figure 2. A 3D model of the gonad turn region. The video starts with scrolling through the entire stack of planes used to segment the cells. Afterwards a 3D maximum projection of the stack is shown, followed by the 3D segementation model rotating around the x and y axes (with and without the segmented gonad's rachis).
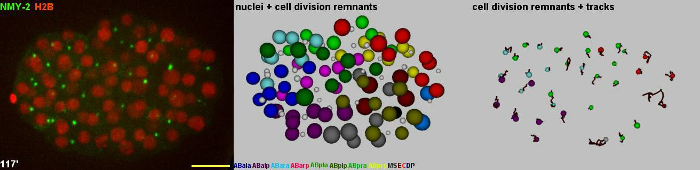
Video 2 – related to Figure 3. Tracking of nuclei and cell division remnants. Left: 3D projections from time-lapse microscopy data. Middle: The model obtained from tracking both nuclei (colored spheres) and cell division remnants (grey spheres). Right: Cell division remnants and their trajectories. Scale bar = 10 µm.
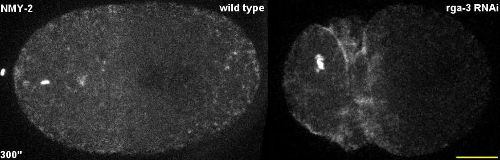
Video 3 – related to Figure 5. Analysis of cortical contractile flow with PIV. 3D maximum projection time-lapse recordings of a representative wild type and rga-3 RNAi embryo used to calculate the vector field with PIVlab. Scale bar = 10 µm.
