1. Setup of the Rapid Scan Coil Driver at 250 MHz
- Calculation of Rapid Scan Experimental Conditions
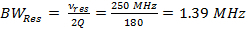
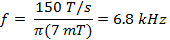
Note: The most important parameter in RS-EPR is scan rate, α, which is the product of scan frequency and scan width (Equation 3). For narrow scan widths, faster scan rates are used, and for wider sweep widths, slower scan rates are used. The following instructions step through the latter case and show how to arrive at the experimental coil driver parameters of 7 mT sweep width and 6.8 kHz scan frequency.- Determine the resonator bandwidth (BWRes).
 (1)
(1)
where vres is the operating frequency of the resonator and Q is the quality factor. Q = 90, is common for the rapid scan resonator used to obtain the data in Representative Results. - Determine the rapid scan rate, α, allowed by the resonator bandwidth
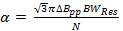 (2)
(2)
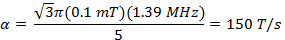
where N is a constant often conservatively selected to be 5-6, ΔBpp is the peak-to-peak derivative linewidth in mT, and a is the scan rate if T/s for a Lorentzian linewidth.
Note: A common value for the radicals in the representative section is = 0.1 mT. In comparison with earlier rapid scan literature; Equation 2 is derived by setting the signal bandwidth (BWsig) equal to BWRes.
 - Determine the maximum rapid scan frequency allowed by the rate.
 (3)
(3)
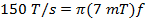
where w is the width of the scan and f is the scan frequency. A sweep width of 7 mT will cover 100% of the spectrum for current probes used in vivo. Use this value and the rate calculated in (Equation 2) to determine the scan frequency.
- Determine the resonator bandwidth (BWRes).
- Selection of tuning capacitors and tuning of rapid scan coil driver
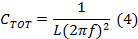
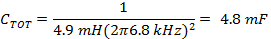
Note: The rapid scan coil driver is typically run in a resonated mode generating a sinusoidal wave. Resonance occurs at a scan frequency where the inductive and capacitive reactances are of equal magnitude and opposite signs, so that total reactance is close to zero.- Determine the proper capacitance for the frequency determined in 1.1.3 using the inductance, L, of the rapid scan coils and (Equation 4).
- Divide CTOT from (Equation 4) in half to get the capacitor values for each side of the coil driver capacitor box.
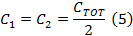
Note: The rapid scan coil driver has two amplifiers. When selecting a capacitor, the capacitor box needs to be balanced with an equal capacitance on each side of the box. The two sides are in series. - Unscrew the top cover of capacitor box and insert capacitors on both sides that are equal to the value determined in step 1.2.2.
- Replace the top of the capacitor box and screw it down to ensure it stays on.
- Using the front panel of the resonated coil driver, adjust the output frequency until the sinusoidal waveform has the maximum amplitude.
- Determine the proper capacitance for the frequency determined in 1.1.3 using the inductance, L, of the rapid scan coils and (Equation 4).
2. Preparation of Reagents and Phantoms
- Preparation of radicals
- Remove 15N-PDT from the freezer and allow the container to come to room temperature (10-15 min).
- Weigh out 1.4 mg of 15N-PDT using an analytical balance.
- Add 1.4 mg of 15N-PDT to 15 ml de-ionized (DI) H2O for a final concentration of 0.5 mM.
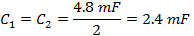
Note: 4-oxo-2,2,6,6-tetra(2H3)methyl-1-(3,3,5,5-2H4,1-15N)piperdinyloxyl (15N-PDT), 4-1H-3-carbamoyl-2,2,5,5-tetra(2H3)methyl-3-pyrrolinyloxyl (15N-mHCTPO) and 3-carboxy-2,2,5,5-tetra(2H3)methyl-1-(3,4,4-2H3,1-15N)pyrrolidinyloxy (15N-Proxyl)25 (Figure 1E-G) radicals have long term stability (2 years) in aqueous solution and at room temperature. Their solid forms are usually stored in a freezer or refrigerator to keep these radicals stable for years. The stability of nitroxide radicals generally make them non-toxic, and their preparation can be done on a normal benchtop when the solvent is water. When using organic solvents, prepare nitroxide solutions inside a fume hood while outfitted with the proper personal protective equipment (PPE).
- Preparation of pH sensitive trityl radicals
- Weigh out 0.7 mg of triaryl methyl radical (aTAM4)26 radical (1,400 g/mol) and dissolve in 200 µl of absolute ethanol.
- Weigh 0.00681 g of KH2PO4 (136.1 g/mol) and dissolve in 50 ml DI water for a final concentration of 1 mM.
- Weigh 2.8 g of KOH (56 g/mol) and dissolve in 50 ml of DI water for a final concentration of 1 M.
- Add KOH drop wise to the phosphate buffer (2.2.2) to adjust the pH of 7.0.
- Add 800 µl of 1 mM phosphate buffer and the 200 µl of aTAM4 in absolute ethanol for a final concentration of 0.5 mM in 80:20 buffer:ethanol.
- Repeat steps 2.2.1-2.2.5 to create the aTAM4 sample at pH = 7.2.
- Place the aTAM4, pH=7.0 and aTAM4, pH=7.2 into separate 6 mm quartz sample tubes.
- Place both 6 mm quartz EPR tubes into a 16 mm quartz EPR tube, with a 2 mm thick Styrofoam spacer in between.
Note: The walls of the quartz sample tube are 0.5 mm thick, and in addition to the 2 mm spacer yield a 3 mm separation between the aTAM samples. The pH sensitive trityl radicals used were synthesized at the Ohio State University26. The example that was used for imaging is called aTAM4. The reaction which accounts for the pH sensitivity is shown in Figure 1A.
- Generation of BMPO-OH
- Weigh out 680 mg of KH2PO4 and dissolve in 100 ml DI water for a final concentration of 50 mM.
- Add 1 M KOH drop wise to the phosphate buffer to pH=7.3.
- Weigh out 50 mg of BMPO (199.25 g/mol).
- Combine the 50 mg of BMPO with 5 ml of phosphate buffer in a 16 mm quartz irradiation tube.
- Add 100 µl of 300 mM hydrogen peroxide.
- Irradiate the mixture in the 16 mm quartz irradiation tube with a medium pressure 450 W UV lamp for 5 min.
- Using a glass transfer pipet, transfer 2.5 ml of irradiated BMPO-OH solution out of the quartz irradiation tube and into one side of a 16 mm quartz sample tube with 3 mm divider.
- Transfer the remaining 2.5 ml of irradiated BMPO-OH into the other side of the 16 mm quartz sample tube with 3 mm divider.
- Preparation of dinitroxide radical
- Weigh out 24.7 mg of 2H,15N-disulfide dinitroxide (Figure 1C) in 1 ml DMSO for a stock solution of 47.5 mM.
- Prepare 10 mM Tris buffer and adjust to pH 7.2.
- Take 40 µl dinitroxide stock solution and dilute with Tris buffer to a final concentration of 1 mM.
- Place 250 µl of dinitroxide solution in buffer in a 16 mm quartz sample tube with a 10 mm divider in the center.
- Weigh out 154 mg of glutathione and add to 5 ml of Tris buffer for a final concentration of 100 mM.
- Add 5 µl of the 100 mM glutathione solution to 250 µl of 1 mM dinitroxide solution on one side of the 10 mm divider to convert the diradical into monoradical.
- Preparation of nitronyl nitroxide
- Remove the radical from the freezer and allow the container to come to room temperature (10-15 min).
- Weigh out 1.9 mg of nitronyl (390 g/mol).
- Weigh out 0.56 mg of KOH and dissolve in 10 ml DI water for a final concentration of 1 mM.
- Mix the 1.9 mg of nitronyl into 10 ml of 1 mM KOH solution for a final concentration of 0.5 mM nitronyl.
Note: If necessary, use a vortexer or sonicator to speed solvation of the nitronyl.
3. Setup of the Rapid Scan Instrument at 250 MHz
Note: Tuning of the resonator with an aqueous sample of nitroxide radical, which has a similar effect on resonator Q and tuning as buffer solution, is a good way to set up for the sample to be imaged
- Tune the resonator with an aqueous sample of nitroxide radical.
- Insert the 15 ml of 0.5 mM 15N-PDT in water sample into a 16 mm quartz EPR tube.
- Insert the quartz tube into the detection side of the cross-loop RS-EPR resonator.
- Change the frequency of the instrument source until it matches the frequency of the detection side that contains the sample. Manually change the carrier frequency of the 250 MHz source by entering the desired value in software.
- Change the frequency of the excitation side to match the frequencies of the experiment source and detection side of the resonator. Change the frequency of the excitation side by turning a variable capacitor within the resonator cavity according to manufacturer's protocol.
- Set up Instrument Console and Main Magnet
- Turn on the spectrometer and choose an experiment which records transient data with time on the abscissa.
- Within the software, set the number of points to 65,536 and the time base to 10 nsec.
- Set the number of averages to 10,000 for a strong or narrow signal, and to 45,000 for a broad or weak signal.
- Press the "engage" button in the software to send the experimental parameters from the software to the console and energize the main field magnet.
- Set the main magnetic field to 9 mT.
- Set the power attenuation knob to 50 dB, and turn on the 7 W high power amplifier.
4. Execution of Rapid Scan Experiment
Note: Specific instructions related to analysis of phantoms containing BMPO-OH24, pH sensitive TAM radicals19,27 and redox sensitive dinitroxides28 are provided in the literature.
- Power saturation of standard nitroxide sample
Note: It is advantageous to do a power saturation curve on a standard nitroxide radical sample under the same experimental conditions which will be used to look at radicals sensitive to pH or redox status.- Turn on the rapid scan coil driver, with the values from Section 1 (scan frequency of 6.8 kHz and scan width of 7 mT).
- Starting at 50 dB, collect a rapid scan spectrum with 100k averages. Decrease the attenuation by 3 dB and repeat the measurement. Continue until an attenuator setting of 0 dB, or for as long as the isolation measurement on the bridge readout is < 0.
- Transfer the raw rapid scan data into a deconvolution program (for example written in Matlab) and process the raw data into the absorption spectrum.
- Enter the scan frequency, sweep width, number of points and timebase into the program, and run the program to process the raw rapid scan signal into an absorption signal.
- Plot the amplitude of the absorption signal as a function of the square root power (in Watt) incident on the resonator. In the non-saturating regime, the amplitude is linearly dependent on the square root of the incident power.
- Fit a trend line starting at 0,0 and include all data points which fall into the linear response region. In the linear response region, signal amplitude increases proportional to the square root of microwave power.
- Extrapolate this trend to higher powers, and compare the EPR signal intensity. Use the highest power for which the signal amplitude does not deviate more than 3% from the extrapolated trend line. In order for the deconvolution of the rapid scan signal to work properly, the signal must still be in the linear response region with respect to incident power.
Note: Transfer of the raw rapid scan data can be done over a network connection or via thumb drive. In this case the transfer is necessary because the program to process raw data (Matlab) is not on the same computer which has data collection software. The deconvolution algorithm which processes raw data is described in 29.
The product of the experiment is a set of projections that are reconstructed into two-dimensional (one spectral, one spatial) images with a false color scale to represent signal amplitude. Deep blue denotes baseline where no signal is present, green is low amplitude and red is highest. Slices along the x-axis (spectral dimension) depict the EPR signal (EPR transition) on a magnetic field axis. Along the y-axis (spatial dimension), separation between signals corresponds to the physical spatial separation between samples in the resonators.
Figure 3 shows a comparison of two images, acquired with CW (Figure 3B) or RS (Figure 3A) of a phantom with three different types of 15N substituted nitroxide radicals (Figure 3D). The broadest signal corresponds to 15N-Proxyl, a five member pyrrolidine ring with a negative charge at physiological pH, which could help target the molecule to specific cellular compartments. The doublet signal belongs to 15N-mHCTPO and is the result of a single hydrogen amidst otherwise complete deuteration. This single splitting has been optimized to monitor changes in oxygen concentration30. The narrowest signal comes from 15N-PDT, a flexible piperidine ring that is completely deuterated. It can be used to monitor oxygen concentration, or redox environment (reduction of the structure leads to decrease in EPR signal).
For the same 5-min acquisition time, the RS image shows superior spatial resolution and clarity of the spectral pattern for each radical. One reason for the improvement of RS over CW can be seen by comparing spectra at two different gradient strengths between the two techniques (Figure 3C). As the gradient strength increases the spectral signal is broadened. Considerable degradation of the CW spectrum under the high gradients (1 mT/cm) which encode spatial information.
Because a derivative signal broadens more quickly than an absorption signal, the SNR for the highest gradient CW projection (red trace) is very poor compared to that of the highest gradient RS projection (blue trace). Linewidth as a function of spatial position can be extracted from a 2D plot. Linewidth will be broad or narrow based on changes in oxygen concentration or viscosity around the nitroxide probe. The phantom imaged in Figure 3A was at room temperature and open to the air. Since oxygen content and viscosity (as determined by temperature) remained steady, the linewidth of each probe should be constant across the width of each tube containing a radical. Figure 4 shows the scatter in linewidths fit from slices through the 2D image compared to the true linewidth value (black horizontal line). The image slice values, especially for 15N-PDT, are a better match to the true linewidth value for RS (Figure 4A) than for CW (Figure 4B). This is also a result of the improved SNR of RS over the CW technique.
Another benefit of the RS technique is the ability to generate wide magnetic homogeneous field sweeps in a very short time. A typical scan frequency for experiments at 250 MHz is 9 kHz, corresponding to 0.11 msec. This is 0.11 msec whether the field sweep is 0.5 mT or 5.0 mT. Compare this to CW, where a 5.0 mT sweep will take tens of seconds to minutes. With rapid scan it becomes possible to quickly collect 100% of the spectral information in times which are amenable to in vivo imaging.
Figure 5 demonstrate wide spectrum RS-EPR imaging applied to spin trapping models. Important signaling molecules, like OH• and NO• are endogenous free radicals with very short lifetimes. In order to study these molecules, "spin traps" are used. An example of the reaction of spin trap 31 (BMPO) with OH• is shown in Figure 1B. Imaging of a phantom containing 5 µM BMPO-OH adduct is shown in Figure 5 (A, B). The spin-trap adduct signal is dependent on the starting concentration of OH• and has a half-life of 30 minutes allowing study of any processes which generate OH•. The nitronyl nitoxide32 was used as another example of wide spectrum imaging, but has been used in the past for spin-trapping of NO•33,34. Imaging of a phantom containing nitronyl is shown in Figure 5 (C, D). For spin traps, capturing the entire spectrum allows better designation of the original transient radical species that was present.
Sensitivity to physiological changes like pH and redox status is derived from changes in the entire spectrum. Figure 6 shows imaging with aTAM4. In Figure 6B, the profile of aTAM4 at pH= 7.0 (blue) has many spectral features, and a slice from the image matches well with the corresponding zero gradient spectrum (green). Compare this to the profile of aTAM4 at pH=7.4, Figure 6C, with fewer spectral features and still in good agreement with the corresponding zero gradient spectrum. Imaging of phantoms containing of the dinitroxide in its dimeric, and reduced monomeric form are shown in Figure 7. The two different spectra are generated by cleavage of a disulfide (S-S), and so convey sensitivity to redox environment1,35.
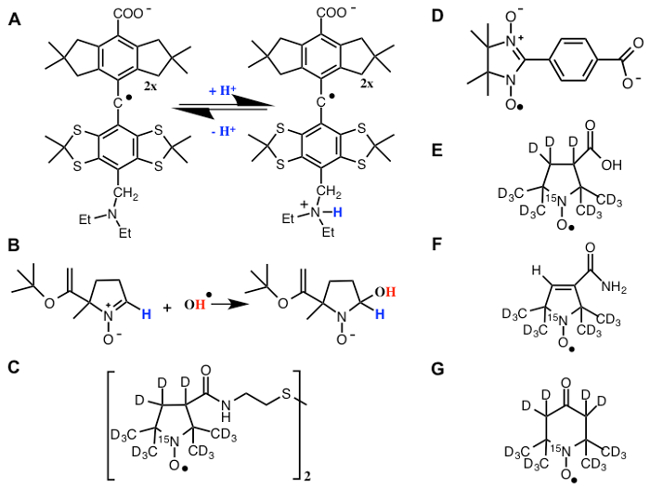
Figure 1. EPR probes are sensitive to many physiological changes. (A) An example of the pH-sensitive tri-aryl-methyl (TAM) radicals26. (B) Spin trap BMPO. (C) 15N-dinitroxide. (D) The nitronyl. (E) 15N-Proxyl. (F) 15N-mHCTPO. (G) 15N-PDT. Please click here to view a larger version of this figure.
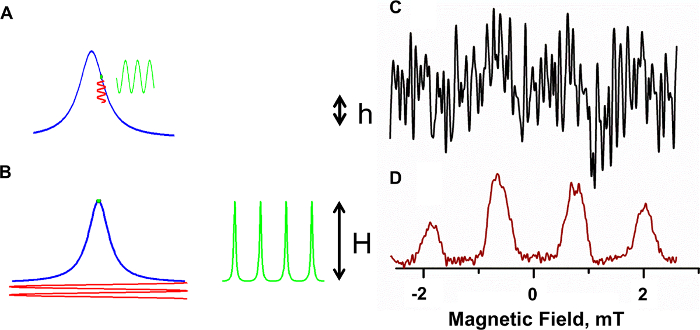
Figure 2. Rapid scan EPR has inherently better SNR. (A) In CW EPR the amplitude h is a small fraction of the total signal, determined by the magnetic field modulation. (B) In direct-detected rapid scan, the full signal amplitude is detected. The signal to noise increase is evident in the experiment where superoxide generated by E. faecalis is trapped with BMPO at X-band. For the same 30 sec acquisition time, hardly any signal is observable in the CW spectrum (C) while a strong signal is observed in the rapid scan spectrum (D)36. Please click here to view a larger version of this figure.
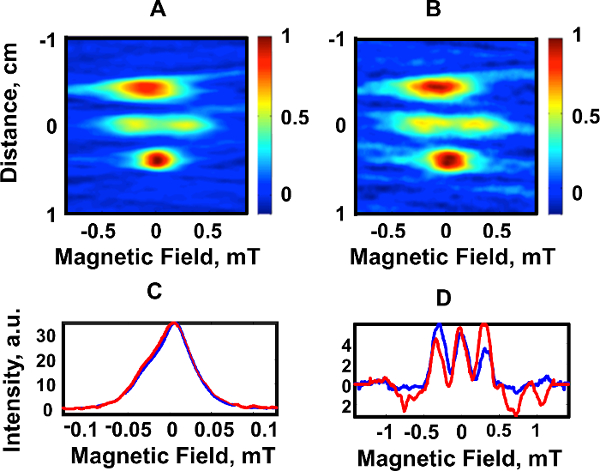
Figure 3. Improved SNR allows better spatial resolution. For the same 5-minute acquisition time, the RS image (A) has better SNR and spatial resolution compared to the one acquired with CW (B). (C) There is good agreement between projections acquired with rapid scan (blue) and CW (red) when no gradient is present (0 mT/cm) (D). Please click here to view a larger version of this figure.
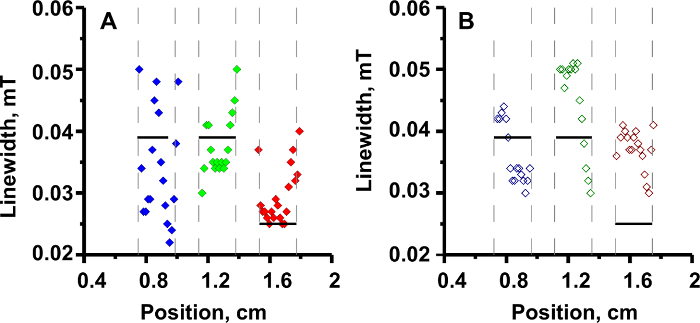
Figure 4. The information content of a rapid scan image is higher than for CW. (A) Slices of the 2D RS image. (B) Slices of the 2D CW image. The true linewidth (black horizontal line) of each sample is shown for comparison. See reference23. Please click here to view a larger version of this figure.
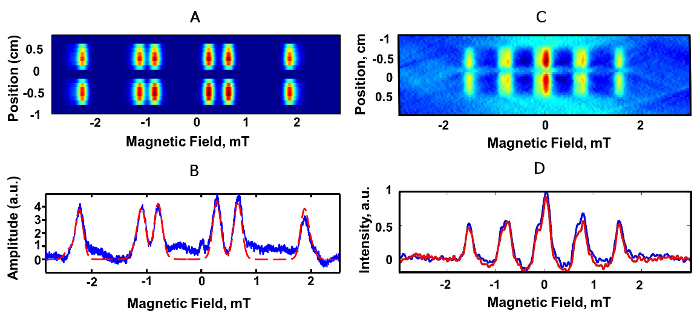
Figure 5. Rapid field sweeping allows capture of an entire spectrum in a few seconds. (A) 2D spectral-spatial image of a phantom consisting of BMPO-OH adduct. (B) A simulation fit to the zero-gradient BMPO-OH spectrum at 250 MHz was used to fit the initial BMPO-OH image and distinguish between regions containing BMPO-OH and noise containing regions. (C) 14N nitronyl radical which can be used for the trapping of nitric oxide in vivo. (D) Slices through each spectrum show the spectral shape at 250 MHz. See reference19. Please click here to view a larger version of this figure.
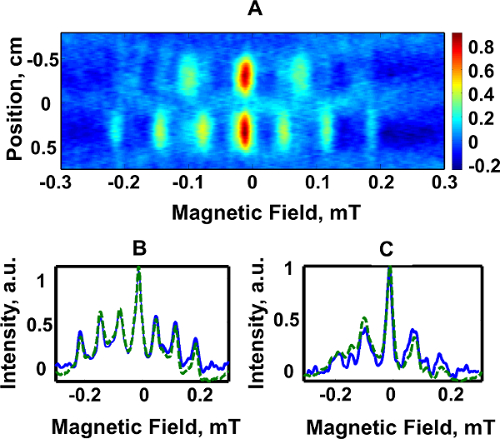
Figure 6. No part of the spectrum is left out, allowing better monitoring of physiologically induced spectral changes. (A) 2D spectral-spatial image of a phantom consisting of two tubes of pH sensitive aTAM4 radical. (B) Spectral profile of aTAM4 at pH= 7.0 (blue) and the corresponding zero gradient spectrum (green). (C) Spectral profile of aTAM4 at pH=7.4 B (blue) and the corresponding zero-gradient spectrum (green). See references19,26,37. Please click here to view a larger version of this figure.
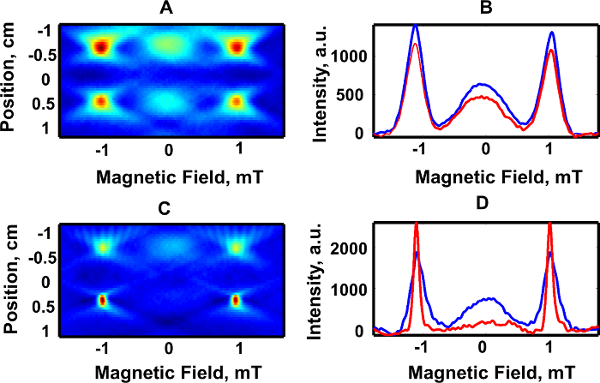
Figure 7. Rapid scan opens the door to de vivo redox monitoring at 250 MHz. (A) 2D spectral-spatial images of 15N-dinitroxide. (B) Slices through top (blue trace) and bottom (red trace) compartments in the two images. (C) The top compartment remains the same, but the bottom compartment has been reduced with glutathione. (D) Slice through each image object showing the change in the 1D spectrum of the bottom compartment. See references1,28,35. Please click here to view a larger version of this figure.
