We describe a targeted RNA sequencing-based method that includes preparation of indexed cDNA libraries, hybridization and capture with custom probes and data analysis to interrogate selected transcripts for gene expression, mutations, and gene fusions. Targeted RNAseq permits cost-effective, rapid evaluation of selected transcripts on a desktop sequencer.
RNA sequencing (RNAseq) is a versatile method that can be utilized to detect and characterize gene expression, mutations, gene fusions, and noncoding RNAs. Standard RNAseq requires 30 – 100 million sequencing reads and can include multiple RNA products such as mRNA and noncoding RNAs. We demonstrate how targeted RNAseq (capture) permits a focused study on selected RNA products using a desktop sequencer. RNAseq capture can characterize unannotated, low, or transiently expressed transcripts that may otherwise be missed using traditional RNAseq methods. Here we describe the extraction of RNA from cell lines, ribosomal RNA depletion, cDNA synthesis, preparation of barcoded libraries, hybridization and capture of targeted transcripts and multiplex sequencing on a desktop sequencer. We also outline the computational analysis pipeline, which includes quality control assessment, alignment, fusion detection, gene expression quantification and identification of single nucleotide variants. This assay allows for targeted transcript sequencing to characterize gene expression, gene fusions, and mutations.
Whole transcriptome or RNA sequencing (RNAseq) is an unbiased sequencing method to assess all RNA products. The goal of targeted RNAseq (Capture) is a focused evaluation of selected transcripts with increased sensitivity, dynamic range, reduced cost or scale, and increased throughput compared to standard RNAseq. Similar to standard RNAseq, targeted enrichment approaches can be used to evaluate gene expression, multiple RNA species such as mRNA, microRNA (miRNA), lncRNA1, other noncoding RNAs2, gene fusions3, and mutations4-6.
Capture involves hybridization of complementary oligonucleotides to enrich cDNA libraries for sequencing. The rationale for RNAseq Capture is similar to microarray approaches where complementary oligonucleotides or probes are hybridized to samples and then measured for relative abundance. For microarray technologies, expression is based on relative signal measured for transcripts binding to these probes. Microarrays are thus limited by range, potential background noise from non-specific binding, and cross-hybridization of probes. Furthermore, arrays have limited dynamic range for low and highly expressed transcripts compared to RNAseq1. Microarrays are widely utilized due to their reduced cost and high throughput capacity compared to RNAseq.
Here, we demonstrate a method for RNAseq Capture that offers a middle ground between RNAseq and microarray approaches for evaluating the transcriptome. RNAseq Capture has intermediate throughput, greater dynamic range and sensitivity, and is scaled for fast turnaround on desktop sequencers. RNAseq Capture also requires reduced computational resources in terms of storage space and data processing.
Note: This protocol describes the simultaneous processing and analysis of four samples. This method is compatible with RNA isolated from cells, fresh frozen tissue and formalin-fixed paraffin-embedded tissue (FFPE). This protocol begins with 50 – 1,000 ng (250 ng recommended) of starting RNA input for each sample.
1. rRNA Depletion and Fragmentation of RNA Procedure
2. cDNA Synthesis
3. Library Preparation
4. Library Amplification
5. Hybridization, Capture and Sequencing
6. Data Analysis
A schematic highlighting key steps in RNAseq Capture is shown in Figure 1. Four cancer cell lines with known mutations were used to demonstrate the effectiveness of the RNAseq Capture technique (K562 with ABL1 fusion, LC2 with RET fusion, EOL1 with PDGFRalpha fusion and RT-4 with FGFR3 fusion). The four samples were pooled together and sequenced with 2x 100 bp reads on a desktop sequencer, which generates FASTQ files. FASTQ files were run through an RNAseq analysis pipeline, which includes five main components: 1) quality control assessment, 2) alignment to human transcriptome, 3) gene expression quantification, 4) fusion calling, and 5) variant calling. The alignment file (BAM) is used to call single nucleotide variants and calculate gene expression. Fusions are called using fusion callers, such as TopHat Fusion (performing their own alignment) and the output is annotated using fusion detection software.
Comparison of gene expression from RNAseq and capture demonstrates enrichment of targeted transcripts by 10 to 1,000-fold using the capture method (Figure 2A). Additionally, Figure 2B shows an increase in the percent of reads mapping to the targeted transcript regions using capture compared to RNAseq. Assessment of quality control measures is represented in Figure 3. Capture and RNAseq perform equally in terms of alignment to the transcriptome (3A, 94% vs. 93%) and mean insert size (3B, 174 bp vs. 162 bp). Using the capture method, a higher percentage of exonic regions are sequenced (3C, 77% vs. 60%), and conversely a lower percentage of intronic regions are sequenced (3D, 4% vs. 20%). Total read counts per sample are depicted in 3E, and as expected, RNAseq generated over 50-fold more reads than capture. Finally, the percentage of rRNA sequences present in each sample was lower using the capture method when compared to RNAseq (3F, 4% vs. 15%).
Fusion detection output shown in Table 1 is generated with normalized fusion supporting reads. Capture RNAseq was successful in detecting fusions for all four cell lines. Comparison of single nucleotide variants called in overlapping regions of capture and RNAseq is displayed in Figure 4. This demonstrates a high concordance of variants between Capture and RNAseq within the target region.
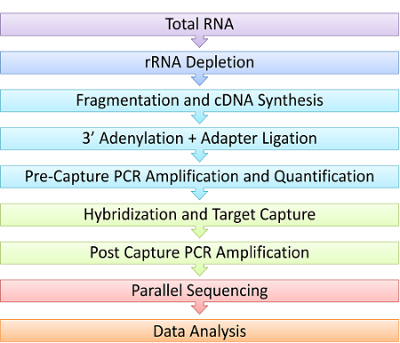
Figure 1. Schematic of RNAseq Capture Steps. In this experimental demonstration, RNA is first depleted of ribosomal RNA, followed by chemical fragmentation and synthesis of complementary DNA (cDNA) using reverse transcriptase. Next, the cDNA is polyadenylated and ligated on both ends to platform-specific adaptors to generate a library. Only cDNA libraries with proper adaptors are then amplified by PCR. Libraries are then hybridized to custom oligonucleotide probes and captured using magnetic beads. This small amount of captured library must be amplified a second time to have enough for next generation sequencing. Multiple libraries can then be sequenced in parallel. Sequencing data is analyzed for RNA events of interest such as gene fusions, expression or mutations. Please click here to view a larger version of this figure.
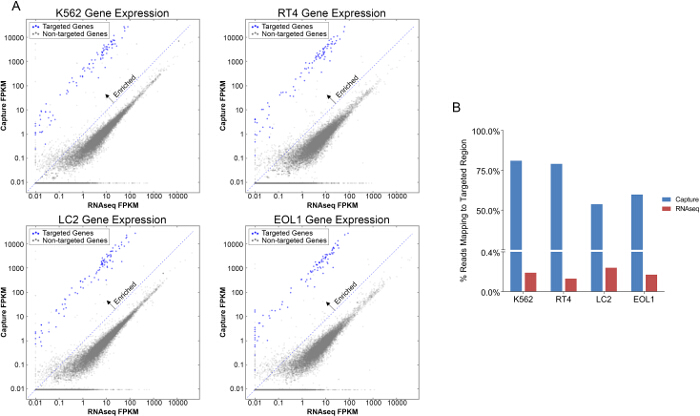
Figure 2. Comparison of Targeted Genes in Capture versus RNAseq. A, Gene expression comparison between Capture and RNAseq in four cancer cell lines K562, LC2, EOL1 and RT-4 measured by reads per kilobase per million mapped reads (FPKM)(Log scale). Targeted genes of interest are enriched (blue) compared to non-targeted genes (grey). B, Percentage of reads mapping to targeted region is increased in Capture versus RNAseq libraries in four cancer cell lines. Please click here to view a larger version of this figure.
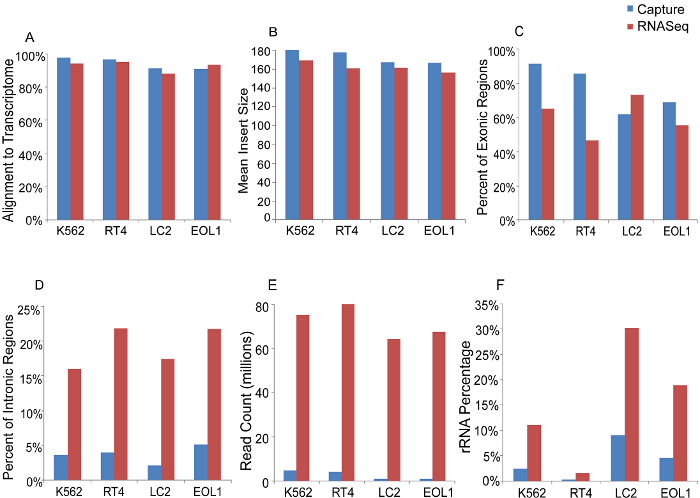
Figure 3. Sequencing Metrics of Capture versus RNAseq in Four Representative Cancer Cell Lines. A, Percentage of reads mapping to the transcriptome, B, Mean insert size of libraries. C, Percentage of reads in exonic regions. D, Percentage of reads in intronic regions. E, Total sequencing reads. F, Percentage of reads mapping to ribosomal RNA. Please click here to view a larger version of this figure.
Cell Line | Fusion | Library Type | Total Reads | On Target Reads | Normalized Fusion Supporting Reads (NFSR) | ||
TophatFusion | ChimeraScan | TRUP | |||||
K562 | BCR-ABL | RNAseq | 150,300,482 | 279,438 | 0 | 438 | 0 |
Capture | 9,341,148 | 7,566,087 | 598 | 343 | 0 | ||
LC2 | CCDC6-RET | RNAseq | 128,861,790 | 307,566 | 0 | 97 | 0 |
Capture | 12,320,692 | 10,314,284 | 71 | 44 | 6 | ||
EOL1 | FIP1L1-PDGFRA | RNAseq | 135,321,406 | 225,222 | 0 | 0 | 170 |
Capture | 9,317,418 | 7,680,818 | 143 | 0 | 7 | ||
RT4 | FGFR3-TACC3 | RNAseq | 161,350,024 | 208,741 | 0 | 131 | 469 |
Capture | 8,305,950 | 6,563,574 | 358 | 88 | 34 |
Table 1. Fusion Detection for Capture versus RNAseq of K562, LC2, EOL1 and RT-4. This Table displays four cancer cell lines and three different fusion detection algorithms, TopHat2, ChimeraScan, and TRUP utilized in this demonstration. This table demonstrates the ability to detect fusions with Capture using less than 10 million total reads compared to greater than 60 million reads utilized for RNAseq. Fusion supporting reads were calculated by dividing fusion supporting reads by kinase reads, multiplied by one million.
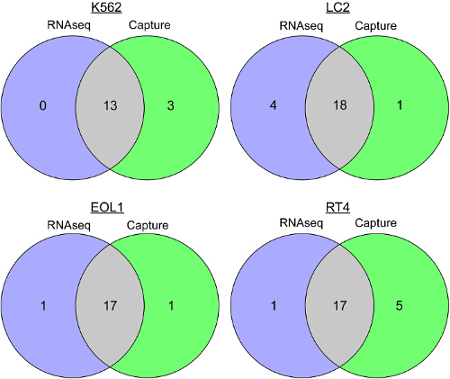
Figure 4. SNV calling for Capture versus RNAseq. These Venn diagrams show the number of Single Nucleotide Variants (SNVs) that were detected by Capture and RNAseq for each of four cell lines (K562, LC2, EOL1 and RT-4). This illustrates high concordance of SNVs between Capture and RNAseq within targeted-region: K562 (81.3%), LC2 (78.3%), EOL1 (89.5%) and RT-4 (73.9%). Please click here to view a larger version of this figure.
RNAseq Capture is an intermediate strategy between RNAseq and microarray approaches for evaluating a selected part of the transcriptome. The advantages of Capture include reduced cost, rapid turnaround time on a desktop sequencer, high throughput, and detection of genomic alterations. The method can be adapted to characterize non-coding RNAs23, detect single nucleotide variants4-6, examine RNA splicing, and to identify gene fusions or structural rearrangements24. Further, this approach can be applied to clinical or processed samples that have undergone fixation with formalin and embedded in paraffin blocks24,25.
There are several significant benefits of RNAseq capture as compared to microarray, real-time quantitative PCR, Sanger sequencing and DNA sequencing. Microarray is limited by high background due to cross-hybridization and non-specific binding of probes. Quantification of genes with low expression is restricted due to background noise, while highly expressed gene measurements are affected by signal saturation1. Compared to RNAseq capture, real-time PCR proves difficult to reproduce. Additionally, RNAseq allows for detection of novel transcripts, requires less starting input material and can detect alternative splicing26.In contrast to Sanger sequencing, RNAseq allows for higher throughput and analysis of low expressed miRNA. Sanger sequencing has proved to be a valuable tool for verification of fusions with known exon-exon junctions and somatic DNA mutations, however identification of novel fusions is hindered by requirements of a priori candidate breakpoint. DNA sequencing is not cost efficient, requires larger storage space for data, and is incapable of detection of post-transcriptional modifications.
There are several critical steps involved in RNAseq Capture. First, to improve yield of library products from the RNA/cDNA specific paramagnetic beads and paramagnetic beads during washes, be cautious not to over dry the beads, which will lead to loss of yield. Also, do not under-dry the beads, ensure all ethanol is removed from the sample tubes, as ethanol can reduce cDNA yield. Second, the hybridization of cDNA libraries with complementary probes is dependent on consistent temperature, we recommend warming Wash Buffer I and Stringent Buffer to 65 °C for at least two hr in advance. Further, after hybridization it is essential to maintain 65 °C during the binding and wash steps. The probes used here were designed for the exons of genes of interest for drug development including kinases, genes involved in common rearrangements such as transcription factors, and house keeping genes. Moreover, gene content is customizable and capture panel sizes can vary. Further, as new information on genomic regions arises, additional probes can be designed and added to the existing capture panel.
Evaluation of alignment metrics, specifically on-target rate, provides information on how well the targeted region was enriched. A low on-target rate may be due to a failed hybridization and capture, whereby the desired target region was not captured and enriched. In this case, a re-hybridization and capture of the library set must be performed. A low on-target rate may also be due to failure to deplete rRNA, which can be confirmed by calculating the percentage of rRNA in the samples. High rRNA percentage within the sample will require re-preparation of the sample beginning with rRNA depletion. Additionally, if library concentration falls below the requirements for hybridization and capture, it would be advisable to optimize the amount of starting input for the sample type and quality (range: 50-1,000 ng).
While there are several advantages for targeted RNAseq applications, there are also limitations to consider. Samples with poor RNA quality based on RIN or degree of fragmentation may not yield quality libraries for sequencing. Several groups have demonstrated success with formalin fixed paraffin-embedded samples, however there are samples that will not pass for sequencing24,25,27. Further, since RNAseq Capture focuses on known transcripts, it loses the benefits of unbiased RNAseq for novel or unannotated transcripts. In addition, for SNP detection, RNAseq methods can only detect mutations in expressed transcripts.
Future opportunities of RNAseq Capture include research and clinical applications. Recent discovery of thousands of long non-coding RNA and their role in biology will require focused characterization. In the clinic, RNAseq Capture may extend beyond research testing and translate into clinical assays to characterize human disease such as cancer, infectious disease, and non-invasive testing. In conjunction with genomic sequencing approaches, RNAseq Capture can be integrated to study and characterize the expressed genome.
The authors have nothing to disclose.
We give special thanks to Ezra Lyon, Eliot Zhu, Michele Wing, Esko Kautto and Eric Samorodnitsky for technical support. We would also like to thank Jenny Badillo for her administrative support for our team. We acknowledge the Ohio Supercomputer Center (OSC) for providing disk space, processing capacity, and support to run our analyses. We thank the Comprehensive Cancer Center (CCC) at The Ohio State University Wexner Medical Center for their administrative support of this work. S.R. and Team are supported by the American Cancer Society (MRSG-12-194-01-TBG), a Prostate Cancer Foundation Young Investigator Award, NHGRI (UM1HG006508-01A1), Fore Cancer Research Foundation, American Lung Association, and Pelotonia.
Thermomixer R | Eppendorf | 21516-166 | |
Centrifuge 5417R | Eppendorf | 5417R | |
miRNeasy Mini Kit | Qiagen | 217004 | |
Molecular Biology Grade Ethanol | Sigma Aldrich | E7023-6X500ML | |
Thermoblock 24 X 1.5ml | Eppendorf | 21516-166 | |
MiSeq Reagent Kit v2 (300-cycles) | Illumina | MS-102-2002 | |
MiSeq Desktop Sequencer | Illumina | ||
PhiX Control v3 | Illumina | FC-110-3001 | |
TruSeq Stranded Total RNA Kit with RiboZero Gold SetA | Illumina | RS-122-2301 | |
25 rxn xGen® Universal Blocking Oligo – TS-p5 | IDT | 127040822 | |
25 rxn xGen® Universal Blocking Oligo – TS-p7(6nt) | IDT | 127040823 | |
25 rxn xGen® Universal Blocking Oligo – TS-p7(8nt) | IDT | 127040824 | |
Agencourt® AMPure® XP – PCR Purification beads | Beckman-Coulter | A63880 | |
Dynabeads® M-270 Streptavidin | Life Technologies | 65305 | |
COT Human DNA, Fluorometric Grade, 1mg | Roche Applied Science | 05480647001 | |
Qubit® Assay Tubes | Life Technologies | Q32856 | |
Qubit® dsDNA HS Assay Kit | Life Technologies | Q32851 | |
SeqCap® EZ Hybridization and Wash Kits (24 or 96 reactions) | Roche NimbleGen | 05634261001 or 05634253001 | |
Qubit® 2.0 Fluorometer | Life Technologies | Q32866 | |
10 x 2 ml IDTE pH 8.0 (1X TE Solution) | IDT | ||
Tween20 BioXtra | Sigma | P7949-500ML | |
Nuclease Free Water | Life Technologies | AM9937 | |
C1000 Touch™ Thermal Cycler with 96–Well Fast Rection Module | Biorad | 185-1196 | |
SeqCap EZ Hybridization and Wash Kits | Roche Applied Science | 05634253001 | |
SuperScript II Reverse Transcription 200U/ul | Life Technologies | 18064-014 | |
D1000 ScreenTape | Agilent Technol. Inc. | 5067-5582 | |
Agencourt RNAClean XP -40ml | Beckman Coulter Inc | A63987 | |
RNA ScreenTape | Agilent Technol. Inc. | 5067-5576 | |
RNA ScreenTape Ladder | Agilent Technol. Inc. | 5067-5578 | |
RNA ScreenTape Sample Buffer | Agilent Technol. Inc. | 5067-5577 | |
Sodium Hydroxide | Sigma | 72068-100ML | |
DynaBeads MyOne Streptavidin T1 | Life Technologies | 65602 | |
DYNAMAG -96 SIDE EACH | Life Technologies | 12331D | |
Chloroform | Sigma | C2432-1L | |
KAPA HotStart ReadyMix | KAPA Biosystems | KK2602 | |
NanoDrop 2000 Spectrophotometer | Thermo Scientific | ||
My Block Mini Dry Bath | Benchmark | BSH200 | |
D1000 Reagents | Agilent Technol. Inc. | 5067- 5583 | |
Vacufuge Plus | Eppendorf | 022829861 |