Critical challenges for the diabetes research field are to understand the molecular mechanisms that regulate islet β-cell replication and to develop methods for stimulating β-cell regeneration. Herein a high-content screening method to identify and assess the β-cell replication-promoting activity of small molecules is presented.
Loss of insulin-producing β-cells is a central feature of diabetes. While a variety of potential replacement therapies are being explored, expansion of endogenous insulin-producing pancreatic islet β-cells remains an attractive strategy. β-cells have limited spontaneous regenerative activity; consequently, a crucial research effort is to develop a precise understanding of the molecular pathways that restrain β-cell growth and to identify drugs capable of overcoming these restraints. Herein an automated high-content image-based primary-cell screening method to identify β-cell replication-promoting small molecules is presented. Several, limitations of prior methodologies are surmounted. First, use of primary islet cells rather than an immortalized cell-line maximizes retention of in vivo growth restraints. Second, use of mixed-composition islet-cell cultures rather than a β-cell-line allows identification of both lineage-restricted and general growth stimulators. Third, the technique makes practical the use of primary islets, a limiting resource, through use of a 384-well format. Fourth, detrimental experimental variability associated with erratic islet culture quality is overcome through optimization of isolation, dispersion, plating and culture parameters. Fifth, the difficulties of accurately and consistently measuring the low basal replication rate of islet endocrine-cells are surmounted with optimized immunostaining parameters, automated data acquisition and data analysis; automation simultaneously enhances throughput and limits experimenter bias. Notable limitations of this assay are the use of dispersed islet cultures which disrupts islet architecture, the use of rodent rather than human islets and the inherent limitations of throughput and cost associated with the use of primary cells. Importantly, the strategy is easily adapted for human islet replication studies. This assay is well suited for investigating the mitogenic effect of substances on β-cells and the molecular mechanisms that regulate β-cell growth.
Diabetes encompasses a collection of disorders sharing the common end-point of disrupted glucose homeostasis. Although the pathogenic mechanisms of diabetes subtypes are distinct, they share the consequence of decreased β-cell mass, i.e., loss of insulin production capacity1,2. Presently, diabetes treatment strategies rely upon chronic administration of exogenous insulin, pharmacologic stimulation of insulin production or enhancement of insulin sensitivity, and rarely, the transplantation of pancreatic islets or whole pancreas3,4. Regrettably, the success of these strategies is short-lived and/or fails to sufficiently recapitulate the function of endogenous insulin production. Despite the utility of developing a method to stimulate β-cell regeneration, no such approach exists. Consequently, a major diabetes research goal is to develop methods to generate new β-cells or to expand endogenous β-cell mass5. Although β-cell regeneration from renewable sources such as embryonic stem cells is advancing, safety and efficiency concerns make the pursuit of alternative strategies, including expansion of mature β-cells, a priority6,7. Importantly, the predominant source of new β-cells in vivo is pre-existing β-cells rather than specialized progenitor cells8,9. Although β-cells appear to have limited replication capacity, a small increase in β-cell mass (~ 30%) may be sufficient to restore glucose homeostasis in many diabetics. Furthermore, in situ pharmacologic stimulation of β-cell mass is a potentially inexpensive and scalable treatment strategy. Herein a high-content screening method for identifying and characterizing small molecules that stimulate β-cell growth is presented.
A variety of in vitro experimental methods may be used to identify gene products and/or molecules that promote primary β-cell replication. Early efforts for measuring β-cell replication induction used fetal rodent pancreata culture or intact isolated islet cultures to measure [3H] thymidine incorporation, BrdU incorporation or mitotic bodies within the aldehyde-thionine or insulin stained population in response to specific treatment conditions10,11. These in vitro approaches and close variants thereof have several limitations. Prominent deficiencies include (1) the use of fetal cells which, unlike mature β-cells, display a high basal β-cell replication rate and are growth regulated in a distinct manner12; (2) the subjective nature of experimenter-dependent adjudication of β-cell replication events; (3) the labor and time intensive nature of experimenter-dependent counting of β-cell replication events retards experimental throughput; (4) the use of nuclear incorporation/stain/appearance to identify replication events and a non-overlapping cytoplasmic stain to identify β-cells leads to misattribution of proximate non-β-cell replication events to β-cells.
More recently mature primary β-cells have been used to assess the impact of transgene over-expression as well as gene product or compound treatment on β-cell replication13-16. However, these studies have also relied upon subjective counting of replication events, cytoplasmic staining- or non-specific methods for β-cell identification and/or labor-intensive steps that limit throughput, e.g., individual slide-well plating of cells or intact islet paraffin embedding and processing17. Notably, an image-based human β-cell replication screening methodology, similar to the one presented herein, has been published18; however, successful use of this assay has not been demonstrated and the use of human islets for primary screening may not be broadly feasible.
An alternative strategy for identifying replication-promoting substances is to assess growth induction of β-cell lines. Initial efforts used transformed β-cell-lines such as min6 cells or INS 832/13-cells14,19-21. However, these cell-lines demonstrate unrestrained growth and bear little resemblance to well-differentiated β-cells22. Consequently, growth-induction capacity is minimal, of unclear relevance and sometimes difficult to recapitulate. An improved strategy for cell-line based screening utilizes "reversibly transformed" cells that are growth arrested in the absence of tetracycline (doxycycline)-dependent SV40 T antigen expression23,24. However, it is unclear whether these cells revert to a "normal" β-cell-like state upon doxycycline removal. Unfortunately, use of these cells has yielded generalized growth-promoting compounds that don't appear to have immediate utility24. Overall, the use of cell-lines to study growth regulation of a cell-type displaying minimal spontaneous replication activity may have limited applicability.
The β-cell replication screening platform presented herein utilizes mature primary rat β-cells to retain in vivo growth regulation to the extent possible, islet-cell cultures of mixed cell-type composition to enable identification of lineage-restricted growth-promoting activities, multi-well formatting to maximize throughput and automated analysis to eliminate bias and facilitate throughput. Successful use of this platform has enabled identification of several compounds that promote β-cell replication25,26. Additionally, the assay has been used for structure-activity relationship studies and chemical epistasis experiments to provide mechanistic insights into the molecular regulation of β-cell replication. The presented platform was successfully adapted for lentiviral RNAi-based investigation of β-cell replication pathways25. Limitations of the assay include restricted scalability (use of primary cells), use of rodent rather than human islet-cells (though the assay may be adapted for human islet studies), expenses associated with antibody-based imaging and primary islet use, the use of dispersed islets (disrupted islet architecture) to facilitate automated image acquisition and dependence upon the availability of an automated microscope with image acquisition and analysis capability. Although a facile in vivo screening methodology for identifying gene products or compounds that stimulate β-cell regeneration in situ would be ideal, such a platform is not yet available27. Consequently, the described platform is appropriate for researcher interested in investigating most aspects of β-cell replication.
This protocol was carried out in accordance with the Institutional Animal Care and Use Committee (IACUC) of Stanford University School of Medicine. The described protocol is scaled for islet isolation from six 250 – 300 g (8 – 9 weeks old) male Sprague Dawley rats, which is sufficient to generate 228 wells of a 384-well plate for islet-cell replication assessment.
1. Material Preparation
2. Perfusion of the Pancreas
3. Dissociation of the Pancreas
4. Purification of Islets
5. Dispersion and Plating of Islet Cells
6. Islet-cell Culture Treatment, Fixation and Staining
7. β-Cell Replication Analysis
Note: An assay protocol must be established for the high content screening microscope used to measure β-cell replication. In its simplest composition, this protocol is a two-color assay where an identity marker is used to define β-cells (PDX-1+-cells) and a replication marker (Ki-67) is used to define cell division events.
To assess β-cell or α-cell replication, a four-color assay protocol is required. First, objects are identified by DAPI staining (Channel 1, 386 nm). Next, β-cells (event 1) are counted: objects that co-express PDX-1+ (channel 2, 650 nm) and peri-nuclear insulin (channel 3, 549 nm). Subsequently, replicating β-cells (event 2) are counted: β-cells (event 1) that co-express Ki-67 (channel 4, 485 nm) (Figure 3). The percentage of replicating β-cells is calculated: (event 2/event 1) x 100. To quantify α-cell replication, total objects are identified by DAPI staining (channel 1) and then α-cells (event 1) are enumerated by the absence of PDX-1 staining (channel 2) and the presence of perinuclear glucagon staining (channel 3). Replicating α-cells (event 2) are the number of α-cells that co-express Ki-67 (channel 4) (Figure 4). The percentage of replicating α-cells is calculated: (event 2/event 1) x 100.
Before initiating the experiment, a compound treatment plan is made (Table 1A). Here, a small scale assay was run using negative control (DMSO-treated) and positive control (dipyridamole-treated [15 µM]) conditions to assess PDX-1, β-cell and α-cell replication in a 384-well format (49 images per well). Experimental data demonstrate dipyridamole to selectively promote PDX-1+-cell and β-cell replication but not α-cell replication. The average number of identified PDX-1-cells per well was 5,541 ± 555 for DMSO-treated and 6,439 ± 363 for dipyridamole-treated conditions (p< 0.01); demonstrating a dipyridamole-dependent increase in PDX-1 cell number (Table 1B, top). The average percent PDX-1+-cell replication (DMSO+PDX-1+Ki-67+/DMSO+PDX-1+) is 3.35 ± 0.50% for DMSO-treated and 10.10 ± 0.98% for dipyridamole-treated conditions (p<0.01) (Table 1B, bottom). Importantly, there are similar PDX-1+-cell replication rates in wells subsequently analyzed for β-cell (rows C-F) and α-cell replication (rows G-J): DMSO= 3.3 ± 0.66 (rows C-F) and 3.4 ± 0.23 (rows G-J) (p= 0.80); dipyridamole= 9.8 ± 0.86 (rows C-F) and 10.4 ± 0.1.1 (rows G-J) (p= 0.43). Hence, these wells, although stained for different cell-lineage markers (insulin and glucagon), responded similarly to drug treatment.
Next the replication rates of β-cells and α-cells were calculated from the raw data (Table 2). The average number of β-cells (event 1) was increased in response to dipyridamole treatment: DMSO 3,930 ± 488 vs. dipyridamole 4,589 ± 218 (p<0.05). Notably, there is a significant reduction in the number of β-cells (3,930 ± 488) compared to PDX-1 cells (5,541 ± 555) (p<0.01). This is a result of excluding PDX-1+-cells that are insulin– from the β-cell count, e.g., δ-cells or β-cell progenitor cells, and the additional stringency of requiring β-cells to be insulin+. Notably, the number of α-cells (event 1) did not increase with dipyridamole treatment (DMSO 1,465 ± 123 vs dipyridamole 1,467 ± 74.7; p= 0.93). Hence, dipyridamole selectively increases β-cell number. The number of replicating β-cells (event 2) is increased in response to dipyridamole treatment (DMSO 131 ± 31 vs. dipyridamole 476.5 ± 39.6; p< 0.01) but the number of replicating α-cells (event 2) is not (DMSO 10.25 ± 3 vs. dipyridamole 9.0±1.6; p=0.5). Finally the percentage of replicating β-cells and α-cells is calculated ((event 2/event 1) x 100). Indeed, dipyridamole increases the percentage of replicating β-cells but not α-cells (summarized in Figure 5). Importantly, the basal β-cell replication rate of a healthy culture varies between experiments (0.5 – 3%) but should be highly consistent across wells within an experiment. Because the basal replication is variable, the compound-induced β-cell replication rate is also variable across experiments; however, the fold-induction of β-cell replication is consistent across experiments and allows compound efficacy to be reliably compared across experiments. Notably, the α-cell replication rate is ~ 5 times lower than the β-cell replication rate and cultures contain ~ 1/3 as many α-cells as β-cells; consequently, the α-cell replication index displays increased variability compared to the β-cell replication index. To limit variability, the images per well is increased from 49 (used here) to a maximum of 81.
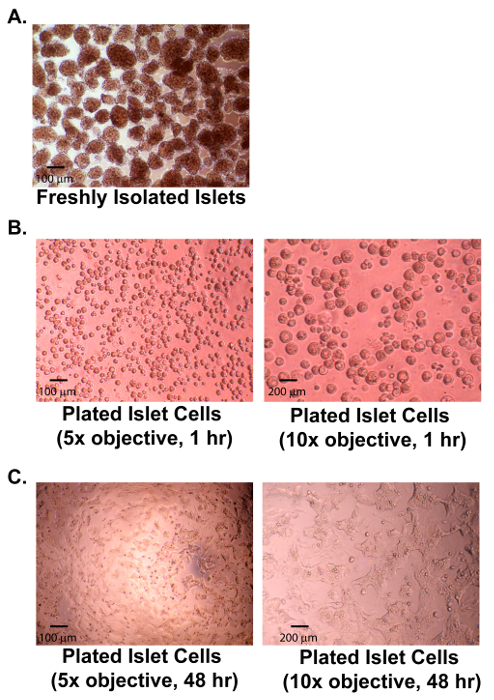
Figure 1: Isolated and Dispersed Rat Islets. (A) A micrograph of healthy isolated rat islets; 100 µm scale bar shown. (B) Micrographs (5X and 10X objectives) of dispersed rat islets 1 hr after plating; 100 µm (left) and 200 µm (right) scale bars shown. (C) Micrographs (5X and 10X objectives) of dispersed rat islets 48 hr after plating; 100 µm (left) and 200 µm (right) scale bars shown. Please click here to view a larger version of this figure.
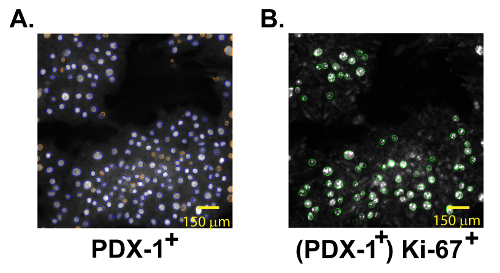
Figure 2: Automated Identification of PDX-1+ and Ki-67+ Islet Cells. (A) Compound-treated dispersed rat islet cells stained for PDX-1. PDX-1+ objects are circled in blue; excluded objects are circled in orange. Scale bar of 150 µm shown. (B) The same field of islet-cells stained for Ki-67. PDX-1+ ki-67+ double-positive cells are circled in green. Scale bar of 150 µm shown. Please click here to view a larger version of this figure.
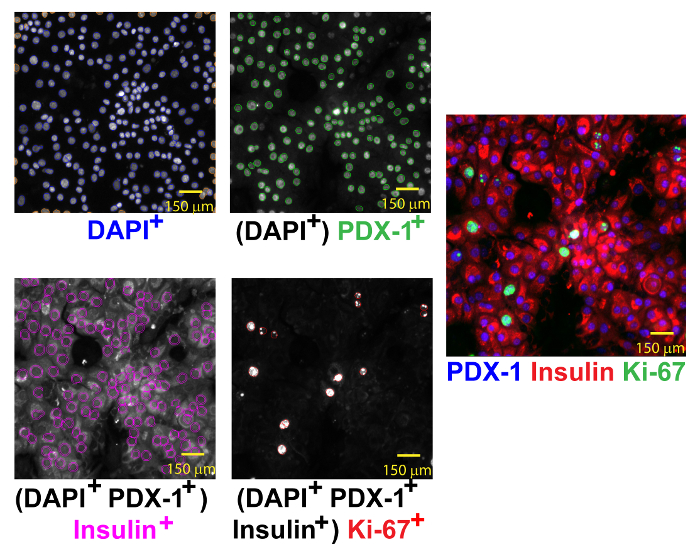
Figure 3: Automated Identification of Replicating β-cells. Replicating β-cells are identified by DAPI (left-upper corner, blue circles), PDX-1 (right-upper corner, green circles), insulin (left-lower corner, magenta circles) and Ki-67 (right-lower corner, red circles) co-expression. The merged image (right) shows several replicating β-cells. Scale bar of 150 µm shown. Please click here to view a larger version of this figure.
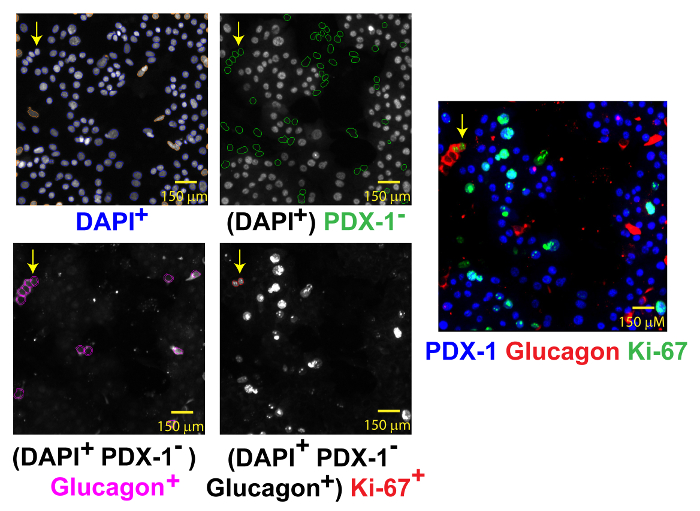
Figure 4: Automated Identification of Replicating α-cells. Replicating α-cells are identified by DAPI (left-upper corner, blue circles), the absence of PDX-1 (right-upper corner, green circles), glucagon (left-lower corner, magenta circles) and Ki-67 (right-lower corner, red circle) co-expression. The merged image (right) shows a rare replicating doublet of α-cells (yellow arrow). Scale bar of 150 µm shown. Please click here to view a larger version of this figure.
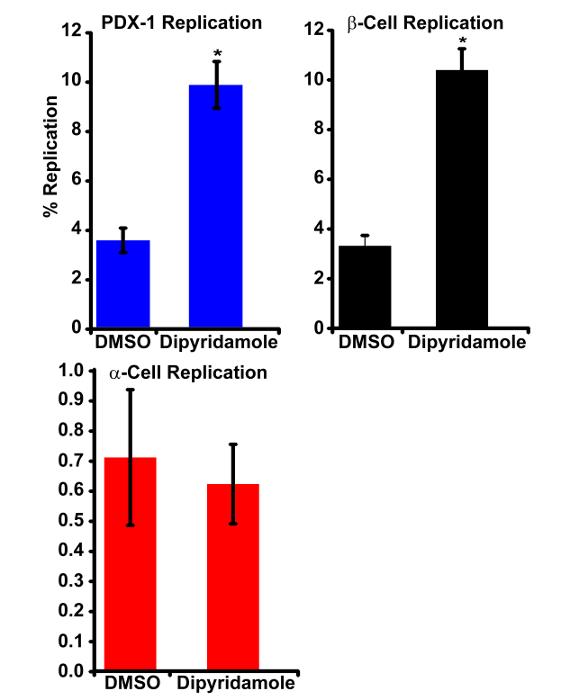
Figure 5: Dipyridamole Induces PDX-1+– and β-cell Replication but Not α-cell Replication. Graphical representation of PDX-1-cell (top left), β-cell (top right) and α-cell (bottom left) replication in DMSO- and dipyridamole-treated wells are shown. Bars represent the mean of independently treated wells (PDX-1 replication, n= 8; β-cell and α-cell replication, n= 4). Error bars indicate the standard deviation (* p< 0.01). Please click here to view a larger version of this figure.
A. | Treatment: | Staining: | |
4 | 5 | ||
C | DMSO | DIPYRIDAMOLE | Insulin, DAPI, PDX-1, Ki-67 |
D | DMSO | DIPYRIDAMOLE | Insulin, DAPI, PDX-1, Ki-67 |
E | DMSO | DIPYRIDAMOLE | Insulin, DAPI, PDX-1, Ki-67 |
F | DMSO | DIPYRIDAMOLE | Insulin, DAPI, PDX-1, Ki-67 |
G | DMSO | DIPYRIDAMOLE | Glucagon, DAPI, PDX-1, Ki-67 |
H | DMSO | DIPYRIDAMOLE | Glucagon, DAPI, PDX-1, Ki-67 |
I | DMSO | DIPYRIDAMOLE | Glucagon, DAPI, PDX-1, Ki-67 |
J | DMSO | DIPYRIDAMOLE | Glucagon, DAPI, PDX-1, Ki-67 |
B. | Number of PDX-1+ Cells | ||
DMSO | DIPYRIDAMOLE | ||
4 | 5 | ||
C | 5158 | 6249 | |
D | 6365 | 6795 | |
E | 4830 | 6974 | |
F | 5988 | 6408 | |
G | 5574 | 6532 | |
H | 5939 | 6411 | |
I | 5612 | 6387 | |
J | 4862 | 5759 | |
Percent of PDX-1+ Ki-67+ Cells | |||
DMSO | DIPYRIDAMOLE | ||
4 | 5 | ||
C | 3.04 | 9.99 | |
D | 3.91 | 10.57 | |
E | 2.51 | 8.58 | |
F | 3.77 | 10.14 | |
G | 3.44 | 10.1 | |
H | 3.06 | 10.69 | |
I | 3.58 | 9.07 | |
J | 3.52 | 11.74 |
Table 1: Representative Experimental Plan and PDX-1+-Cell Replication Data. (A) An outline of the treatment plan is shown. Wells were treated with DMSO (column 4) or dipyridamole (column 5). Staining was performed with DAPI, anti-Pdx-1, anti-insulin (normal lettering) or anti-glucagon (italic lettering) and Ki-67 (B) Total number of PDX-1+ cells (top, DAPI+PDX-1+) per well and the percentage of replicating PDX-1 cells (bottom, DAPI+PDX-1+Ki-67+/DAPI+PDX-1+ x 100) per well are shown.
Event 1: | |||
DMSO | DIPYRIDAMOLE | ||
4 | 5 | ||
C | 3557 | 4352 | # DAPI(+) PDX-1(+) Insulin(+) |
D | 4387 | 4542 | # DAPI(+) PDX-1(+) Insulin(+) |
E | 3462 | 4879 | # DAPI(+) PDX-1(+) Insulin(+) |
F | 4315 | 4585 | # DAPI(+) PDX-1(+) Insulin(+) |
G | 1594 | 1567 | # DAPI(+) PDX-1(+) Glucagon(+) |
H | 1477 | 1439 | # DAPI(+) PDX-1(+) Glucagon(+) |
I | 1491 | 1390 | # DAPI(+) PDX-1(+) Glucagon(+) |
J | 1298 | 1474 | # DAPI(+) PDX-1(+) Glucagon(+) |
Event 2: | |||
DMSO | DIPYRIDAMOLE | ||
4 | 5 | ||
C | 113 | 425 | # DAPI(+) PDX-1(+) Insulin(+) Ki-67(+) |
D | 152 | 511 | # DAPI(+) PDX-1(+) Insulin(+) Ki-67(+) |
E | 97 | 466 | # DAPI(+) PDX-1(+) Insulin(+) Ki-67(+) |
F | 163 | 504 | # DAPI(+) PDX-1(+) Insulin(+) Ki-67(+) |
G | 13 | 9 | # DAPI(+) PDX-1(+) Glucagon(+) Ki-67(+) |
H | 10 | 9 | # DAPI(+) PDX-1(+) Glucagon(+) Ki-67(+) |
I | 6 | 11 | # DAPI(+) PDX-1(+) Glucagon(+) Ki-67(+) |
J | 12 | 7 | # DAPI(+) PDX-1(+) Glucagon(+) Ki-67(+) |
% Replication: | |||
DMSO | DIPYRIDAMOLE | ||
4 | 5 | ||
C | 3.18 | 9.77 | |
D | 3.47 | 11.25 | |
E | 2.8 | 9.55 | |
F | 3.78 | 10.99 | |
G | 0.82 | 0.57 | |
H | 0.68 | 0.63 | |
I | 0.4 | 0.79 | |
J | 0.92 | 0.48 |
Table 2: Representative β-cell and α-cell Replication Data. The total number of β-cells (Event 1: DAPI+PDX-1+insulin+; top table rows C-F, normal lettering)), α-cells (Event 1: DAPI+PDX-1+glucagon+; top table rows G-H, italic lettering), replicating β-cells (Event 2: DAPI+PDX-1+insulin+Ki-67+; middle table rows C-F, normal lettering) and α-cells (Event 2: DAPI+PDX-1+glucagon+Ki-67+; middle table rows G-H, italic lettering) per well are shown. Additionally, the percentage of replicating β-cells (DAPI+PDX-1+insulin+ Ki-67+/ DAPI+PDX-1+insulin+ x 100; bottom table rows C-F, normal lettering) and α-cells (DAPI+PDX-1+glucagon+Ki-67+/DAPI+PDX-1+glucagon+ x 100; bottom table rows G-J, italic lettering) per well are shown.
Experimental methods for studying the molecular pathways that control β-cell growth and regeneration are important tools for diabetes researchers. Herein, a rat-islet-based screening platform to identify and characterize small-molecule stimulators of β-cell replication is presented.
While most aspects of this protocol are easily performed by experienced researchers, a few steps require particular technique. First, during islet isolation, cannulation of the bile-duct without disrupting its integrity requires practice. A helpful strategy is to minimally inflate the bile duct to ensure proper positioning of needle before fully dispensing the pancreatic digestion solution. Second, efficient islet isolation from exocrine tissue requires close attention to digestion duration and appropriate agitation. Care should be taken to ensure even heating throughout the digest through intermittent swirling. Third, experimental success depends upon proficient discrimination between islets and exocrine debris during manual islet picking; this skill improves with practice. Fourth, islet dispersion and plating is done such that all islets are dispersed into a mixture of single-cells and small clusters of two or three cells. Over- and under-digestion of islets prior to plating interfere with experimental performance. Freshly plated islet-cells should be approximately 50% confluent before spreading and allowed to attach over the 48 hr without being disturbed. Figure 1 shows the appearance of successful islet cell cultures at various times after plating. Fifth, media changes for islet-cell cultures are done carefully to avoid disruption of weakly adherent cells. Sixth, antigen retrieval must be done cautiously to avoid warping of the multi-well plate but sufficiently to enable successful Ki-67 staining which is sensitive to both under- and over-exposure to temperature elevation; warped plates cannot be used for automated image acquisition. Note, excessive pancreas digestion, exposure to exocrine tissue debris and/or trypsinization are common causes for islet-cell culture failure.
One limitation of this protocol is the reliance upon specific expression markers for β-cell identity and replication events. Use of single markers has the potential to be misleading. For instance, PDX-1 is expressed by β-cells, a subset of somatostatin-expressing δ-cells and β-cell progenitors29,30; hence, compounds which increase PDX-1-cell replication might be specifically acting on a non-β-cell population. Consequently, confirmatory studies that use alternative β-cell markers are necessary. Similarly, Ki-67 expression is not a perfect marker for replication and additional indicators such as BrdU and phospho-histone 3 should be used31. A second limitation of this assay is that compounds which induce β-cell replication may simultaneously increase β-cell apoptosis or de-differentiation. Hence, it is important to evaluate whether a compound induces an absolute increase in β-cell number, and/or induces β-cell apoptosis and whether compound-treated β-cells retain normal function (glucose-stimulated insulin secretion)32. A third limitation of this assay is the modest throughput associated with use of primary islet-cells; islets from six rats generates 228 experimental wells which allows ~ 55 compounds to be screened in quadruplicate (plus positive and negative controls). An additional limitation of the described β-cell replication screening platform is the use of rat islets rather than human islets. Differences between human and rat islets are sufficient to require that all replication-promoting compounds identified using rat islet cultures are confirmed using human islet cultures. However, given the limited availability, and high cost of human islets, primary screening with human islets is impractical for most researchers.
The primary advantages of this protocol are: 1) the use of freshly isolated primary islets to maintain normal growth restraints to the greatest extent possible, 2) the use of a 384-well format to allow moderate throughput screening (typically islets isolated from six rats are sufficient for 228 wells) and 3) the use of automated image acquisition and analysis to accelerate the pace of experimentation and to limit bias. By contrast, commonly used alternative approaches rely upon manual image acquisition and subjective assessment of β-cell replication events or whole islet incorporation of radioactive thymidine which does not discriminate between cell-linages, example fibroblast versus β-cell replication15,17. Hence, the presented protocol represents an important and improved tool for investigating the growth-regulation of β-cells.
We envision a variety of adapted uses for this screening platform. First, an absolute increase in β-cell number can be measured by counting the number of PDX-1+– or insulin+-cells. To account for variability in the number of cells plated per well a higher number of replicates per condition may be included (typically n= 8). Second, the platform may be adapted for lentivirus-based overexpression or knock-out/down experiments to identify pathways involved in β-cell replication. In summary, the described experimental technique is broadly useful for identifying compounds and the molecular pathways that regulate β-cell replication.
The authors have nothing to disclose.
This work was supported by NIDDK grants DK098143 and DK101530 from the NIH (JPA), Stanford’s Spectrum Child Health Research Institute (CHRI) and SPARK (UL1 TR001085, JPA).
250g male Male Sprague Dawly Rat | Charles River | Stain # 400 | |
12 cm teeth tisuue forceps | Fine Science Tools | 11021-12 | |
11.5 cm fine scissors | Fine Science Tools | 14058-11 | |
14.5 cm surgical scissors | Fine Science Tools | 14001-14 | |
16 cm curved forceps | Fine Science Tools | 11003-16 | |
12 cm curved hepostat | Fine Science Tools | 13011-12 | |
12 cm scalpel handle | Fine Science Tools | 10003-12 | |
Tissue sieve-30 mesh | Bellco Glass | 1985-85000 | |
Cizyme RI, 375,000 CDA units | VitaCyte | 005-1030 | |
Hanks' Balanced Salt solution (Ca++ and Mg++) | Gibco | 24020-117 | |
Ketamine HCl (200 mg/20 ml) | JHP Pharmaceuticals | NDC# 42023-113-10 | to make anesthetic cocktail |
Xylazine (5 g/50 ml) | LLOYD | NADA# 139-236 | to make anesthetic cocktail |
Histopaque 1077 | Sigma | H-1077 | to make histopaque 1100 |
Histopaque 1119 | Sigma | H-1119 | to make histopaque 1100 |
Newborn Calf Serum 500 ml | Hyclone | SH30118.03 | |
Hanks' Balanced Salt solution | Hyclone | SH30268.01 | |
Dulbecco's Modified Eagle Medium/Low Glucose | Hyclone | SH30021.01 | |
Functionality/Viability Solution | Mediatech | 99-768-CV | |
RPMI1640 media | Hyclone | SH30096.01 | to make conditioned medium |
804G rat bladder carcinoma cell-line | Available upon request | to make conditioned medium | |
Fetal Bovine Serum, Qualified | Gibco | 26160 | |
GlutaMax-I | Gibco | 35050-061 | |
Penicillin (5,000 IU/ml/Strptomycin (5 mg/ml) | MP Biomedicals | 1670049 | |
Formamide 500 mL | Fisher BioReagents | BP227-500 | |
Antigen Unmasking Solution 250 mL (PH 6.0) | Vector Laboratories | H-3300 | to make 0.15 M Sodium Sitrate solution |
Dextrose, Anhydrous | EMD Chemicals | DX0145-1 | to make 1 M glucose solution |
Nomal Donkey Serum (Powder) | Jackson ImmunoResearch | 017-000-121 | |
Triton X-100 | Sigma | T8787-100ML | |
Mouse anti-human Ki67 antibody | BD Biosciences | 556003 | |
Goat anti-human PDX-1 antibody | R&D Systems | AF2419 | |
Polyclonal Guinea Pig anti-insulin antibody | Dako | 2016-08 | |
Polyclonal Rabbit anti-glucagon antibody | Dako | 2014-06 | |
Polyclonal Rabbit anti-somatostatin antibody | Dako | 2011-08 | |
Polyclonal chicken anti-vimentin antibody | abcam | ab24525 | |
Biotin-SP-conjugated, Donkey Anti-Mouse IgG | Jackson ImmunoResearch | 715-065-150 | |
StreptAvidin, Alex Flour 488 conjugated | Invitrogen | S32354 | |
Rhodamine-conjugated Donkey Anti-Goat IgG | Jackson ImmunoResearch | 705-025-147 | |
Rhodamine-conjugated Donkey Anti-Guinea Pig IgG | Jackson ImmunoResearch | 706-025-148 | |
Rhodamine-conjugated Donkey Anti-Rabbit IgG | Jackson ImmunoResearch | 711-025-152 | |
Cy 5-conjugated Donkey Anti-Guinea Pig IgG | Jackson ImmunoResearch | 706-175-148 | |
Cy 5-conjugated Donkey Anti-Goat IgG | Jackson ImmunoResearch | 705-175-147 | |
Cy 5-conjugated Donkey Anti-Rabbit IgG | Jackson ImmunoResearch | 711-175-152 | |
Cy 5-conjugated Donkey Anti-Chicken IgG | Jackson ImmunoResearch | 703-175-155 | |
DAPI | Millipore | S7113 | |
Disposable Reagent Reservoir 25 mL | Sorenson BioScience | 39900 | |
384 well, black/clear, tissue culture treated plate | BD Falcon | 353962 | |
96 well, black/clear, tissue culture treated plate | Costar | 3603 | |
Multi-channel pipettor | Costar | 4880 | |
12-channel vaccume aspirator | Drummond | 3-000-096 | |
Cell Scraper | Falcon | 353085 | |
Isotemp Water Bath Model 2223 | Fisher Scientific | ||
High-content screening instrument: ArrayScan VTI | Thermo Scientific |