This protocol describes the synthesis of magnetic particles and evaluation of their DNA-binding properties via dynamic and electrophoretic light scattering. This method focuses on monitoring changes in particle size, their polydispersity and zeta potential of particle surface which play major role in binding of materials such as DNA.
Isolation of DNA using magnetic particles is a field of high importance in biotechnology and molecular biology research. This protocol describes the evaluation of DNA-magnetic particles binding via dynamic light scattering (DLS) and electrophoretic light scattering (ELS). Analysis by DLS provides valuable information on the physicochemical properties of particles including particle size, polydispersity, and zeta potential. The latter describes the surface charge of the particle which plays major role in electrostatic binding of materials such as DNA. Here, a comparative analysis exploits three chemical modifications of nanoparticles and microparticles and their effects on DNA binding and elution. Chemical modifications by branched polyethylenimine, tetraethyl orthosilicate and (3-aminopropyl)triethoxysilane are investigated. Since DNA exhibits a negative charge, it is expected that zeta potential of particle surface will decrease upon binding of DNA. Forming of clusters should also affect particle size. In order to investigate the efficiency of these particles in isolation and elution of DNA, the particles are mixed with DNA in low pH (~6), high ionic strength and dehydration environment. Particles are washed on magnet and then DNA is eluted by Tris-HCl buffer (pH = 8). DNA copy number is estimated using quantitative polymerase chain reaction (PCR). Zeta potential, particle size, polydispersity and quantitative PCR data are evaluated and compared. DLS is an insightful and supporting method of analysis that adds a new perspective to the process of screening of particles for DNA isolation.
DNA isolation is one of the most essential steps in molecular biology. The development of nucleic acid extraction methods has great impact on the emerging fields of genomics, metagenomics, epigenetics, and transcriptomics. There is a wide range of biotechnological applications for DNA isolation including medical (forensic/diagnostic tools and prognostic biomarkers), and environmental applications (metagenomic biodiversity, pathogen prevalence, and surveillance). There has been increasing demand to purify and isolate DNA from different materials and in different scales such as blood, urine, soil, wood, and other kinds of samples.1,2,3,4
Nano- and micro-sized particles are suitable for DNA isolation due to their high surface area and particularly when they can be immobilized by a magnetic field. Physicochemical properties of particles, such as size or charge, can greatly influence their ability to bind target biomolecules.5 To further enhance binding of biomolecules and to stabilize particles, different chemical modifications (surface coatings) can be utilized. The many different strategies for binding are classified according to covalent and non-covalent interactions.6 The size of particles directly affects their magnetization properties, whereas particle composition can be tailored by incorporation of metallic, alloy or other materials that can influence its density, porosity, and surface.7 There is no reliable way to measure surface charge of small particles. Instead, electric potential at the slipping plane (some distance away from nanoparticle surface) can be measured.8 This value is called zeta potential and it is a potent tool that is usually used for evaluation of nano- and microparticle stability via DLS.9 Since its value is highly dependent not only on the pH and ionic strength of the dispersive environment, but also on the surface characteristics of the particles, it can also prove the changes in this surface caused by the interaction between the particles and molecule of interest.10
On the other hand, DNA structure in dehydrated conditions (A-DNA form) exhibits compacted conformations that facilitate its precipitation (aggregation) when compared to commonly occurring B-DNA form. Electrostatic (ionic and H-bond) are the major forces controlling the binding of DNA to other materials due to their sterically accessible phosphate and nitrogen bases (particularly guanine).7,10
In this work, three representative chemical modifications of magnetic nanoparticles and microparticles are analyzed (Figure 1A). The method of synthesis and chemical modification of nanoparticles and microparticles is described. A binding solution, that accords to theoretical principles of DNA precipitation (pH, ionic strength, and dehydration), is used to evaluate DNA binding and elution. Quantitative PCR is used to evaluate the elution efficiency of DNA from the representative nanoparticles and microparticles (Figure 1B). Particle size, polydispersity index, and zeta potential are important parameters that are used to visualize the physicochemical changes that occur on particle surface (Figure 1C). It is important to emphasize on the chemical characterization of magnetic particle surface. While this step was beyond the scope of this protocol, several modern techniques can be applied to investigate the efficiency of chemical modifications.11,12,13,14 Fourier transform infrared spectroscopy (FTIR) can be used to evaluate the infrared spectrum of particle surface and compare it to the spectrum of free chemical modifiers. X-ray photoelectron spectroscopy (XPS) is another technique that can be used to identify the elemental composition of material surface. Other electrochemical, microscopic and spectroscopic methods can be used to shed the light on the quality of particle synthesis. This work highlights a new perspective to analyzing DNA-magnetic particles interactions via DLS.
1. Magnetic Nanoparticles Synthesis
2. Magnetic Microparticles Synthesis
3. Magnetic Particle Size Analysis Using DLS
4. Preparing DNA Stock, Magnetic Particles and Binding Buffer
5. Testing Efficiency of DNA Isolation Using Quantitative PCR
6. DNA-magnetic Particles Binding Analysis Using DLS
Using the protocol described here for chemical synthesis and modification of magnetic particles, six magnetic particles were synthesized and analyzed for DNA binding. A summary of the analysis is shown in Table 1. By comparing the particle size in water and in binding solution, it is clear that all particles aggregated in binding solution by 2 – 22 folds. Some particles further aggregated to more folds in the presence of DNA; however this was not directly correlated with DNA retrieval detected by quantitative PCR (Table 1). Comparison of zeta potential (10 measurements in ~2 min intervals) of particles in controls versus with DNA showed sharp drop in three particles; namely: MNPs_APTES, MMPs_TEOS and MMPs_APTES (Figure 2). Trends in zeta potential over time were also observed, showing variations in the first three readings before they are stabilized in most cases (Figure 3). Variation after exposure to DNA was mostly observed in MMPs (Figure 2). Lower standard deviation was observed by omitting the first three readings representing first 5 min after exposure of particles to DNA (Table 1).
Overall view of the analysis in Table 1 shows the different characteristics of DNA-particle binding as attributed to magnetic particle size and chemical modifications. Briefly, MNPs_PEI nanoparticles increased in size after binding DNA by four folds with no significant change in polydispersity index or zeta potential. However, DNA was not retrievable in this procedure. MNPs_TEOS nanoparticles increased in size and decreased in polydispersity index with unnoticeable change in zeta potential after DNA exposure, yet they were the best particles in their retrieval rates at 20.3%. MNPs_APTES nanoparticles decreased slightly in size and noticeably in zeta potential upon DNA exposure. MMPs_PEI microparticles did not show change in size upon DNA exposure, however they increased in polydispersity index and decreased slightly in zeta potential. MMPs_TEOS microparticles showed alternative size characteristics to their nanoparticle counterparts i.e. MNPs_TEOS. Surprisingly, they decreased noticeably in zeta potential but not beyond the range displayed by MNPs_TEOS. MMPs_APTES increased in particle size upon DNA exposure and also decreased in zeta potential. It is important to note that both MNPs_APTES and MMPs_APTES retained similar sizes after chemical modification despite the fact that they were made from different sized precursors. They have also displayed similar binding properties. MNPs_TEOS showed no significant change in zeta potential by their values were in the lowest extreme detected in this study.
The follow up over time for zeta potential showed stabilizing values after 5 – 10 min, particularly in the case of MNPs (Figure 3A, 3C and 3E). A continuous trend in zeta potential was found in some MMPs readings (Figure 3B, 3D and 3F). In some cases, variations in zeta potential corresponded to variations in polydispersity index and particle size but not with DNA retrieval by elution.
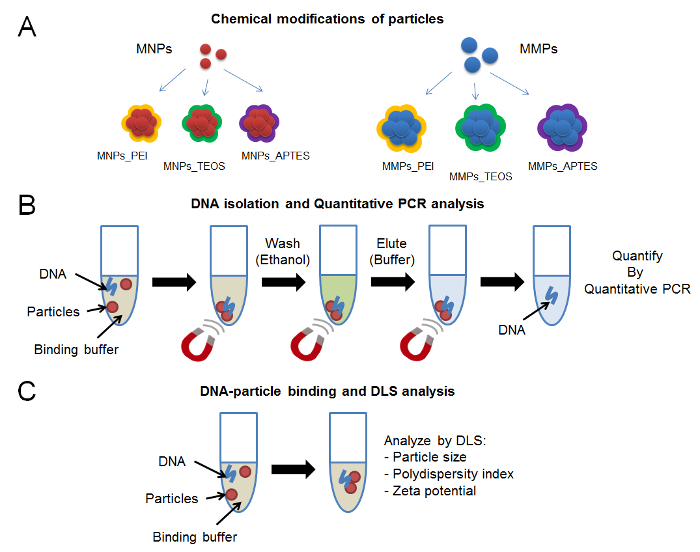
Figure 1: Protocol scheme. (A) Chemical modifications of magnetic particles including branched polyethyleneimine, silica and amino groups. (B) DNA isolation steps using binding buffer and magnetic particles immobilized on magnet, followed by quantitative PCR. (C) DNA-particle binding analysis using DLS. Please click here to view a larger version of this figure.
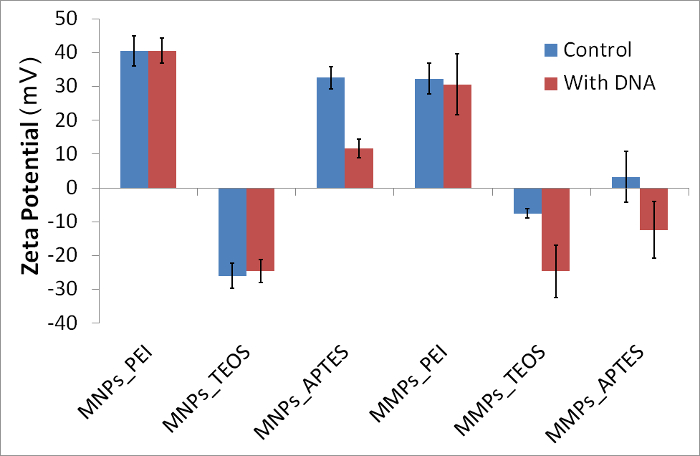
Figure 2: Zeta potential of representative magnetic particles in presence and absence of DNA. Exposure to DNA caused visible decrease of zeta potential in MNPs_APTES, MMPs_TEOS and MMPs_APTES. Error bars represent standard deviation (N = 10). Please click here to view a larger version of this figure.
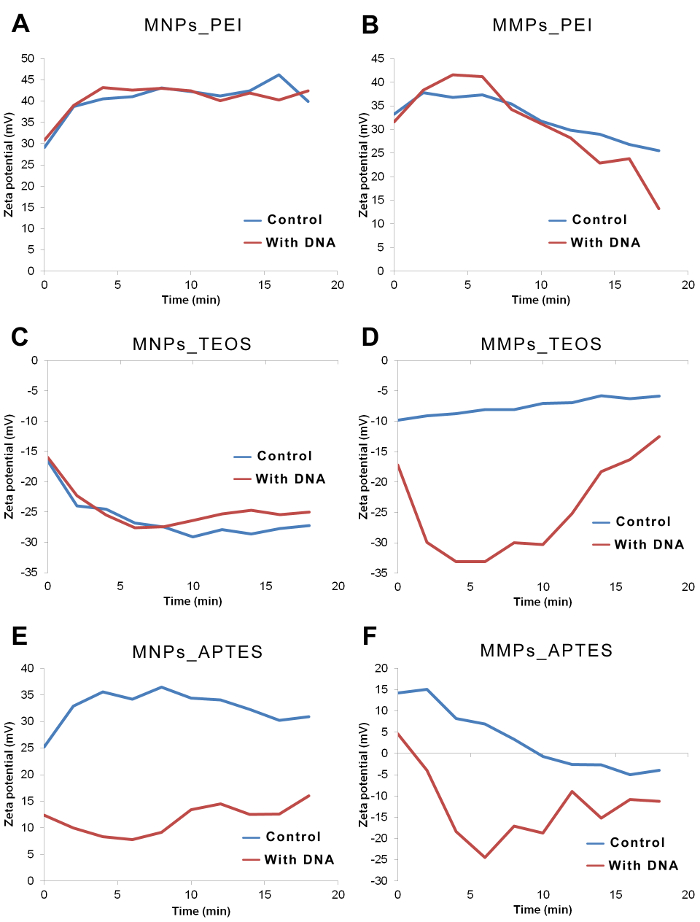
Figure 3: Zeta potential of representative magnetic particles over time in presence and absence of DNA. Zeta potential of particles in binding solution was measured at time = 0, 2, 4, 6, 8, 10, 12, 14, 16 and 18 min. Gap between the zeta potential curves of control vs. with DNA are obvious in cases of MMPs_TEOS, MNPs_APTES and MMPs_APTES. (A) Zeta potential of MNPs_PEI is highly positive indicating no interactions. (B) Zeta potential of MMPs_PEI decreased over time suggesting a very slow interaction between particles and DNA. (C) Zeta potential of MNPs_TEOS was very negative in absence and presence of DNA. (D) Zeta potential of MMPs_TEOS shows lower values in presence of DNA when compared to controls. (E) Zeta potential of MNPs_APTES shows lower values in presence of DNA when compared to controls. (F) Zeta potential of MMPs_APTES shows lower values in presence of DNA when compared to controls. Please click here to view a larger version of this figure.
Characteristics | MNPs_PEI | MNPs_TEOS | MNPs_APTES | MMPs_PEI | MMPs_TEOS | MMPs_APTES |
Particle Size (nm) | ||||||
in water | 141.8 | 91.3 | 1106.4 | 825.0 | 1281.3 | 1281.3 |
in binding solution | 531.2 | 1990.1 | 3091.0 | 2669.0 | 2669.0 | 1990.1 |
in binding solution with DNA | 1990.1 | 3091.0 | 2669.0 | 2669.0 | 1990.1 | 4145.4 |
observed change | increased | increased | increased | |||
Polydispersity index | ||||||
in water | 0.237 | 0.240 | 0.219 | 0.410 | 0.281 | 0.206 |
in binding solution | 0.225 | 0.773 | 0.090 | 0.107 | 0.374 | 0.397 |
in binding solution with DNA | 0.240 | 0.298 | 0.282 | 0.301 | 0.387 | 0.319 |
observed change | decreased | increased | increased | |||
Zeta potential (mV)* | ||||||
in binding solution | 42.29 | -27.83 | 33.23 | 30.80 | -6.86 | -0.66 |
(±SD) | 1.15 | 1.17 | 2.89 | 8.99 | 7.99 | 5.42 |
in binding solution with DNA | 41.81 | -25.97 | 12.28 | 27.81 | -23.67 | -15.22 |
(±SD) | 2.02 | 0.80 | 2.21 | 4.33 | 0.95 | 4.28 |
observed change | decreased | decreased | decreased | |||
Quantitative PCR retrieval** | ||||||
DNA Copy number retrieved | 1.22E+03 | 1.01E+09 | 3.18E+06 | 1.44E+06 | 3.76E+08 | 6.88E+06 |
(±SD) | 8.05E+02 | 7.55E+07 | 2.83E+06 | 1.98E+06 | 1.08E+08 | 3.33E+06 |
DNA retrieval percentage | 0.0 | 20.3 | 0.1 | 0.0 | 7.5 | 0.1 |
(±SD) | 0.0 | 1.5 | 0.1 | 0.0 | 2.2 | 0.1 |
* Only stable measurements after 5 minutes of binding are shown (N=7). | ||||||
** R² = 0.940 for triplicates of standards. |
Table 1: Characterization of representative magnetic particles and their abilities to bind and retrieve DNA. Upon exposure to binding solution, all particles showed aggregation (increase in particle size). When DNA was present in binding solution, particle size increase was visible in MNPs_PEI, MNPs_TEOS and MMPs_APTES. Particles were polydisperse systems in binding solution, particularly MNPs_TEOS which became less polydispersed upon binding of DNA. MNPs_APTES showed increase in polydispersity index and decrease in zeta potential upon exposure to DNA. MMPs_TEOS and MMPs_APTES showed large decrease in zeta potential upon exposure to DNA. MNPs_TEOS and MMPs_TEOS showed the highest DNA retrieval rates of 20.3% and 7.5%, respectively, as shown by quantitative PCR. MNPs_APTES and MMPs_APTES showed 0.1% DNA retrieval rates.
In this protocol, the theoretical principles that explain DNA binding to magnetic particles via zeta potential were under question. The protocol describes the synthesis and modification of magnetic nanoparticles and microparticles. Method for preparation of DNA control and binding solution are also described. Two strategies are shown here for screening of DNA-particle interactions: quantitative PCR and DLS approaches. DLS provides three indicators of physicochemical changes in particles: particle size, polydispersity index and zeta potential. Particle size changes directly indicate aggregation or disintegration. Polydispersity index value describes the distribution of particle species in the system ranging from monodispersed (index < 0.05) to highly polydispersed (index >0.7). Zeta potential can classify particles according to surface charge where highly positive particles show values greater than 30 mV and highly negative particles show values lower than -30 mV. As predicted, the zeta potential of polycharged magnetic particles in binding solution relatively decreased when the particles were exposed to DNA. The exception to this rule is MNPs_TEOS. These particles only differ in that they possess a unique highly negative surface charge (Figure 2). This suggests that ionic strength played an important role in holding the particles, DNA and positive ions together. On the other hand, the changes in particle size can indicate the role of precipitation/aggregation of DNA-particles during the binding process, particularly in presence of longer DNA strands.
During synthesis of magnetic particles and chemical modifications, there are several critical steps which require attention: firstly, the reproducibility of the method of synthesis depends greatly on accurate quantities of chemical precursors used in synthesis as well as good stirring and timely controlled addition of NH4OH. To acquire a homogenized population of particles (of similar size, shape, density and composition), it is important to follow sonication and stirring steps thoroughly when instructed. Secondly, in many realistic cases the chemical modifications do not predict the reality of what is on the surface of magnetic particles. A comprehensive characterization step is required to confirm the chemical composition of the particle surface, as described in the introduction section. Among the commonly used techniques, researchers rely on FTIR, XPS, electrochemistry, spectroscopy as well as DLS.
In addition, several critical steps are required during the DLS measurements and analysis: firstly, the choice of binding solution affects various steps including chemical compatibility with particles and DNA and also spectral properties. Choice of refractive indices of binding solution and particle material can be based on previous studies or evaluated by refractometry. Secondly, interactions between the particles and the electrodes in the cuvettes should be monitored carefully as oxidation/reduction process can affect measurement. Thirdly, as shown in Figure 3, the rate of binding can be a function of time. It is critical to observe the stability of interaction, and this is a major advantage for application of DLS in such studies. Here, the observer is monitoring particle aggregation and physiochemical changes in real-time. Fourthly, polydispersity of the system can set limitations to the scope of analysis. Polydispersity index value below 0.05 describes a monodispersed system while values above 0.7 describe a polydispersed system of various sizes of particles. The size of particles and distribution of various particle species can be studied using various types of DLS, including back-scattered, side-scattered and forward scattered, as mentioned in protocol section 3.1. Finally, sonication of particles prior to testing can obviously affect their physical properties (e.g. size and surface area) and if done excessively it can cause release of some chemical modifications.
In this protocol, information acquired via DLS is compared to data acquired by quantitative PCR, also known as real-time PCR. The latter is the gold standard for detection and quantitation of DNA.15 PCR technique is widely used in laboratories, hospitals and universities. However, when testing DNA exposure to novel and synthesized materials it is important to take the chemistry of PCR into consideration. Polymerase enzyme, the key element of polymerase chain reaction, is sensitive to certain chemical inhibitors and enhancers. Addition of internal controls, testing of the synthetic materials, and good laboratory practice can help reduce biases in PCR results. Mechanisms of action for inhibitors and enhancers vary between chemicals that directly bind to polymerase and others that chelate ions from the Mg2+-dependent polymerase in solution. Some insights on DNA isolation are difficult to get using PCR screening. DLS can show cases when DNA binds to particles but is rather washed or does not elute (DNA not detected by PCR). For example, both MNPs_APTES and MMPs_APTES showed significant decrease in zeta potential upon DNA exposure (Table 1) but the DNA detected in elution did not correlate with these results. It is possible to modify the binding, washing, elution solutions to control the release of DNA from particles. DLS is a relatively faster method for evaluation of DNA-particle interactions. The stability and rate of interaction can also be observed by this method (Figure 3), which can impact the time used in magnetic particles- based DNA isolation protocols.
The challenges for using DLS in analysis are straight forward. This technique requires a relatively large sample volume for analysis (~1 mL) when compared to PCR. Some parameters like refractive indices require careful evaluation when using new solutions in the samples. Furthermore, it is very common to observe oxidation/reduction reactions on the electrodes of cuvettes when testing novel material. Careful assessment and knowledge of the chemical composition of the sample can help evaluate the feasibility of re-using the same cuvette. It is worth mentioning that DLS analysis is limited to the specificity and sensitivity provided by PCR, yet it provides different kind of insight to the DNA-particle binding process.
Like all spectroscopic techniques, modifications and troubleshooting of DLS aim for development of more accurate and sensitive measurements. This can be achieved by providing better understanding of the nature of the material tested physically and chemically. In other words, optical properties and details of chemical composition are the key to gain accurate and sensitive data from DLS. Optical properties can be acquired by refractometry, while chemical composition of particles / particles' surface can be studied by various techniques such as FTIR, XPS, electrochemistry and other spectroscopic methods. In this protocol, binding solution can be improved by using various ionic strengths, other dehydrating agents (e.g. isopropanol), various pH and low temperatures. On the other hand, the chemical modifications of particle surface are left to the chemists' imagination.
The development of materials for isolation of DNA will continue to rise in the next decades with more focus on specificity, purity and limit of detection. The quality of extraction methods plays important role in studies of single cell scale, metagenomic scales and samples of unusual origins. At the present time, it is important to perform DLS analysis of nanoparticles and microparticles modified with various kinds of materials. This step is required before establishing a strong theoretical model that describes the behavior of DNA-particle interactions.
The authors have nothing to disclose.
The financial support by Czech Science Foundation (project GA CR 17-12816S) and CEITEC 2020 (LQ1601) is greatly acknowledged.
Iron(III) chloride hexahydrate | Sigma-Aldrich | 207926 | Magnetic particle synthesis |
Iron(II) chloride tetrahydrate | Sigma-Aldrich | 380024 | Magnetic particle synthesis |
Iron(II) sulfate heptahydrate | Sigma-Aldrich | F8263 | Magnetic particle synthesis |
Acetone | Penta | 10060-11000 | Magnetic particle synthesis |
Sodium citrate dihydrate | Sigma-Aldrich | W302600 | Magnetic particle synthesis |
Tetraethyl orthosilicate | Sigma-Aldrich | 131903 | Magnetic particle synthesis |
(3-Aminopropyl)triethoxysilane | Sigma-Aldrich | 440140 | Magnetic particle synthesis |
Polyethylenimine, branched, average Mw ~25,000 | Sigma-Aldrich | 408727 | Magnetic particle synthesis |
Ammonium hydroxide solution | Sigma-Aldrich | 221228-M | Magnetic particle synthesis |
Ethanol | Penta | 71250-11000 | Magnetic particle synthesis |
Potassium nitrate | Sigma-Aldrich | P6083 | Magnetic particle synthesis |
Potassium hydroxide | Sigma-Aldrich | 1.05012 | Magnetic particle synthesis |
ow-molecular-weight cut-off membrane (Mw=1 kDa) | Spectrum labs | G235063 | Magnetic particle synthesis |
Overhead Stirrer | witeg Labortechnik GmbH | DH.WOS01035 | Magnetic particle synthesis |
Waterbath | Memmert GmbH + Co. | 84198998 | Magnetic particle synthesis |
Sonicator | Bandelin | 795 | Magnetic particle synthesis |
BRAND UV cuvette micro | Sigma-Aldrich | BR759200-100EA | Cuvette for size measurement |
BRAND cap for UV-cuvette micro | Sigma-Aldrich | BR759240-100EA | Cuvette caps for size measurement |
Folded Capillary Zeta Cell | Malvern | DTS1070 | Cuvette for zeta potential measurement |
Zetasizer Nano ZS | Malvern | ZEN3600 | Device for measurement of size and zeta potential |
Infinite 200 PRO NanoQuant instrument |
Tecan | 396 227 V1.0, 04-2010 | device for measurement of DNA concentration |
SYBR Green Quantitative RT-PCR Kit | Sigma-Aldrich | QR0100 | PCR kit |
Mastercycler pro S instrument | Eppendorf | 6325 000.013 | Thermocycler |
MinElute kit | Qiagen | 28004 | DNA purification kit |
Sodium acetate | Sigma-Aldrich | S7670 | DNA binding |