1. Nanoparticle Synthesis and Functionalization
NOTE: Synthesis of the FA-CuS NPs is achieved using a one pot synthesis method adapted from a previously published protocol21.
CAUTION: All synthesis should occur in a ventilated chemical fume hood.
- Prior to synthesis, filter approximately 300 mL of deionized (DI) water though a 0.2 µm sterile filter.
- Clean a 250 mL glass round bottom flask with a detergent solution and rinse with DI water. Add 0.0134 g of CuCl2 into 100 mL of DI water to create a 1 mM solution.
- Add 0.015 g of folic acid (FA) to the CuCl2 solution and stir for ~5 min using a magnetic stir bar.
- Add Na2S·9H2O (0.024 g in 100 µL DI water) over approximately 10 s to the reaction mixture utilizing a 200 µL pipette.
NOTE: Upon addition of the Na2S·9H2O, the solution will change color from a light yellow to a dark brown. - Cap the reaction and place in an oil bath, set to 90 °C, and continue stirring with a magnetic stir bar. After approximately 15 min, or when the oil bath has reached 85−90 °C, allow the reaction to proceed for an additional hour. Your mixture should gradually turn to a dark green color.
NOTE: Make sure to vent the system while heating the reaction mixture to avoid pressure buildup. - Remove the reaction vessel from the oil bath and briefly cool at room temperature for approximately 10 to 15 min before transferring to an ice bath.
- Once the reaction mixture has cooled below 20 °C, adjust the pH to 10 utilizing 1M NaOH to dissolve the remaining folic acid into solution.
- Purify the FA-CuS reaction mixture using a 30 kDa centrifugation column. Add solution in 15 mL batches to the column and centrifuge at 3,082 x g for 15 min.
- Once all of the reaction mixture has been concentrated, recombine the concentrated fractions and wash 4x with 15 mL of pH 10 NaOH in the 30 kDa centrifugation column.
- For mass measurements, take 1/3 of the solution (~66 µL) and split into three glass vials. Dry in a vacuum oven overnight at 40 °C under a vacuum of ~27 mmHg.
- Dissolve the other 2/3 of concentrated solution into 250 µL of PBS and store at 4 °C until further use.
- Prior to utilizing the FA-CuS NPs, sonicate them for 30 min in a bath sonicator on a high setting.
2. NP Characterization
- Perform dynamic light scattering (DLS) Add 10 µL of concentrated FA-CuS NPS in PBS solution from step 1.1.14 to 2 mL of DI water. Prior to characterization by DLS, sonicate the particles for 30 min in a bath sonicator on a high setting and filter through a 0.2 µm sterile filter to remove residual dust.
- Perform transmission electron microscopy (TEM) : Add 10 µL of concentrated FA-CuS NPS in PBS solution to a piece of wax paper. Invert a formvar coated copper grid on the top of the droplet and let sit for 2 min. Touch the edge of the formvar-coated grid to a piece of filter paper to remove excess liquid. Let air dry. Image the copper grid utilizing an electron microscope at an accelerating voltage of 80 kV.
NOTE: Typical results from FA-CuS NPS characterization are presented in Figure 1.
3. Cell Culture
- This protocol utilizes SKOV-3 cells. Unless otherwise noted, culture SKOV-3 cells in McCoy's 5A medium supplemented with 10% FBS, 100 U/mL penicillin, and 100 µg/mL streptomycin, and maintain at 37 °C in a humidified 5% CO2 incubator.
4. Fluorescent Tagging of FA-CuS NPS for Microscopy
- Add Texas-Red-X succinimidyl ester (0.2 mg dissolved in DMSO at a concentration of 10 mg/mL) to a solution containing 2 mg of FA-CuS NPs in 1 mL of 0.1 M NaHCO3 (pH ~9) buffer.
- Stir the reaction mixture using a magnetic stir bar for 1 h, away from light at room temperature.
- Concentrate the reaction mixture in a 4 mL 30 kDa MWCO centrifugation column by spinning at 4,000 x g for 10 min.
- Wash the concentrated solution 3x with 4 mL of 0.1 M NaHCO3 buffer (pH ~9) in a centrifugation column. Subsequently, wash the concentrated solution with 4 mL of DI water 3x or until only a trace amount of fluorescence remains visible in the flowthrough by UV-VIS.
5. FA-CuS NPS Uptake by Ovarian Cancer Cells
- Prior to incubation with FA-CuS NPs, incubate SKOV-3 cells in a T75 flask with 8−15 mL of folic-acid-free RPMI-1640 media with 10% FBS and 1% penicillin/streptomycin for at least 24 h.
- Seed cells in 0.5 mL of folic-acid-free RPMI-1640 complete growth media at a density of 0.1 x 10⁶ cells/mL into a 24 well plate.
- The following day, incubate cells with 400 µg/mL FA-CuS NPS in 0.5 mL of folic-acid-free RPMI-1640 complete growth media for 2 h.
- Following this incubation, trypsinize the cells with 0.5 mL of 0.25% trypsin with EDTA. Add at least 1 mL of folic-acid-free RPMI-1640 complete growth media to neutralize the trypsin, and centrifuge the cells at 123 x g for 6 min.
- Remove the supernatant, resuspend the cells in 2 mL of PBS, and centrifuge at 123 x g for 6 min. Perform this wash step 2x to remove any unbound NPs.
- Resuspend the cells in 1−2 mL of PBS with 2% Tween solution.
- Count the cells using a hemocytometer and trypan blue. Further dilute cells if cell counts are too high. Dilute cells in PBS with 2% Tween to the chosen concentration for detection.
- The cells are now ready to be analyzed by the PAFC system.
6. Fluorescence Microscopy of FA-CuS NPS Uptake
- Repeat steps listed in step 5.1 and proceed with protocol below for microscopy.
- Seed cells at a density of 0.1 x 10⁶ cells/mL in 0.5 mL of folic-acid-free RPMI-1640 complete growth media on glass coverslips in a 24 well plate.
- The following day, incubate the cells with fluorescently tagged FA-CuS NPs in triplicate, at concentrations of 100 µg/mL, 200 µg/mL, 300 µg/mL, and 400 µg/mL in 0.5 mL of folic-acid-free RPMI-1640 complete growth media.
- Incubate the cells with the NPs for 2 h in the 37 °C incubator
- Following this incubation period, wash the cells 3x with PBS.
NOTE: For all wash steps, carefully add the solution on the side of the well plate to not disturb the cells. After addition, carefully tilt the plate and withdraw the solution from the side of the well. - Incubate the cells with 0.5 mL of 3.7% paraformaldehyde (PFA) in PBS for 15 min and transfer the glass coverslips to a new 24 well plate.
CAUTION: PFA is a known carcinogen. Do all fixation in a ventilated chemical fume hood and wear appropriate personal protective equipment. - Incubate the cells in a solution of 3.7% PFA with 0.1% Triton-X in PBS for 5 min.
- Wash the cells with 0.5 mL of PBS 3x for 5 min each and transfer the coverslips to a new plate.
- Incubate the cells with 0.5 mL of a PBS solution containing DAPI (20 µL/mL of a 0.5 mg/mL stock solution is used for staining) for 5 min, away from light.
- Wash the cells with PBS 3x.
- Following the final PBS wash, mount the coverslips on slides with mounting medium.
- The cells are now ready to be imaged by fluorescence microscopy. Figure 2 shows an example of typical cell characterization by fluorescence microscopy.
7. Flow System Architecture
- Flow chamber construction
NOTE:A SolidWorks file of a 3D printed flow tank can be found in the Supplementary Materials.- Using the provided SolidWorks file, 3D print the flow tank using ABS thermoplastic or PLA plastic. Dimensions are provided below if SolidWorks is unavailable. Figure 3A shows a representation of this model. The body of the flow tank is 2.5 cm x 1.5 cm x 7.5 cm. The far ends of the flow tank include holes approximately 5 mm in diameter to allow for the entry of tubing containing the capillary tube.
NOTE: The flow tank has a 1 cm hole, perpendicular to the orientation of the capillary tube, for placement of the ultrasound transducer. A cylindrical extrusion with the same inner diameter as the hole extends 6 mm into the tank. For real-time imaging, the flow tank has a 1 mm x 3 mm slot directly below the capillary tube. - After printing the 3D flow tank, clean and assemble the system for use.
- Place glass coverslips over the 1 mm x 3 mm slot and the 1 cm hole in the flow system.
- Carefully seal with silicone to prevent leakage.
- Fit the capillary tube into the silicone cured tubes. Insert the tubes into the flow chamber though the side of the flow tank such that the glass capillary tube is directly above and in front of the 3 mm slot and the 1 cm hole.
- Seal the tubing using silicone to prevent leakage.
- Using the provided SolidWorks file, 3D print the flow tank using ABS thermoplastic or PLA plastic. Dimensions are provided below if SolidWorks is unavailable. Figure 3A shows a representation of this model. The body of the flow tank is 2.5 cm x 1.5 cm x 7.5 cm. The far ends of the flow tank include holes approximately 5 mm in diameter to allow for the entry of tubing containing the capillary tube.
- Photoacoustic flow system setup
NOTE: Figure 3B and Figure 3C show an example of the flow system architecture.- Connect the transducer to an ultrasound pulser/receiver. Amplify the signal with a 59 dB gain.
- Connect the output of the filter to a multipurpose reconfigurable oscilloscope equipped with a built-in field programmable gate array.
- Connect one of the tubes coming from the flow chamber to a T-junction, connected to two syringe pumps at each branch.
- Fill one of the syringe pumps with air and the other pump with the sample to be analyzed. Set the pump containing air to a flow rate of 40 µL/min and the pump containing the sample to a flow rate of 20 µL/min. The resulting two-phase flow will produce sample volumes of 1 µL. At this flow rate, the system will test approximately 6.4 samples per minute.
NOTE: To maintain a consistent distribution of cells, lightly vortex each sample immediately before being tested. In addition, rotate the syringe every few minutes in order to prevent the cells from settling in the solution. - Connect the remaining tube exiting the flow system to a container with 10% bleach, to dispose of cells after they exit the flow system.
NOTE: Before utilizing the flow system, check for leaks, as these can affect the flow. Cells must be contained within a closed system to maintain biological safety during the procedure. - The design of the 3D printed tank allows for consistent and repeatable alignment between the transducer and laser light with minimal calibration. When placed correctly within the custom tank, the quartz capillary tube ensures that the transducer and laser are directly aligned.
- Place the section of the quartz capillary tube in direct alignment with the transducer, in the field of view of the microscope, allowing for careful placement of the optical fiber above the sample such that it illuminates the entire width of the tube.
- Irradiate the sample using an optical fiber channeling a diode-pumped solid state laser operating at a wavelength of 1,053 nm. The laser light incident on the sample and the transducer used to measure the photoacoustic effect are both unfocused.
- The energy of the laser incident on the sample is approximately 8 mJ and the 10 Hz laser rate is sufficient to illuminate each sample multiple times as it passes through the system.
- Place the flow system on top of an inverted microscope and ensure both the laser pulse and the path of the sample are visible as the sample passes though the flow system. Record flow using a microscope-mounted camera.
- Record the ultrasound acquisitions utilizing data acquisition software (see Table of Materials). Trigger ultrasound and pulsed laser using the FPGA. Utilize PBS with 2% Tween, and FA-CuS NPs at a concentration of 100 µg/mL in PBS 2% Tween, as negative and positive controls, respectively.
- Utilizing a microscope-mounted camera, record both the firing of the laser and the passage of samples though the flow system. These recordings will be utilized to correlate the acoustic signal recorded by the transducer with the firing of the laser. As the samples pass in front of the firing of the laser, the signal can then be correlated to the resulting photoacoustic signal for analysis. At a sampling rate of 10 Hz, the laser will illuminate each plug several times.
8. Post Processing
- For each signal acquisition, s(t), calculate the Hilbert transform, H[s(t)], in order to create an analytic signal.
- Create a complex envelope, se(t), by calculating the magnitude of the analytic signal, such that
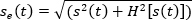 and integrate the envelope to measure the total signal resulting from each acquisition. Compare the signals from each test group (i.e., PBS, tagged cells, FA-CuS NPs, cells alone) utilizing a t-test in R statistical software. Raw photoacoustic signals and their Hilbert transforms are presented in Figure 4.
 - For image reconstruction, normalize the complex envelope based on the maximum peak across the whole run. If comparing a series of runs, normalize the complex envelope using the maximum peak across the entire series. Following normalization, convert each acquisition into a series of pixel values. Represent each series of pixel values as a column in the image reconstruction. Representative reconstructions of PBS and the FA-CuS NPs signals are shown in Figure 5, where both images were normalized using the maximum peak across both runs.
Figure 1A shows a typical TEM image of the synthesized nanoparticles. The average size of the typical nanoparticle is approximately 8.6 nm ± 2.5 nm. Nanoparticle measuring was performed in ImageJ. Threshold and watershed functions were applied to separate the particles for measurement. The horizontal and vertical diameters of each particle were measured perpendicular to each other and further averaged. For DLS, a representative measurement is shown in Figure 1B. The average hydrodynamic diameter for these particles is 73.6 nm. Copper sulfide nanoparticles have a characteristic absorbance curve which extends into the NIR, as shown in Figure 1C. There is a slight artifact around 850 nm that was caused by the switching of lasers by the spectrophotometer.
Fluorescence microscopy images of cells incubated with fluorescently tagged nanoparticles can be seen in Figure 2. Nanoparticle uptake can be visualized by the presence of fluorescence across the cell. Cells not incubated with nanoparticles show no fluorescence signal. The presence of this fluorescence signal indicates the successful uptake of the particles and their ability to be detected in the flow system.
Figure 3 shows the general setup of the photoacoustic flow system. Figure 3A shows a detailed model of the 3D flow chamber. This chamber can be printed utilizing the .stl file provided with this protocol. Figure 3B shows an overview of the flow tank setup. Figure 3C shows a general setup of the flow tank and data acquisition system.
Typical data acquisition signals are shown in Figure 4. The raw data indicates the differences in signal between the nanoparticle tagged cells, PBS, and FA-CuS NPs. An acquisition is the resulting photoacoustic signal generated from a single laser pulse. Due to the rapid firing rate of the laser, each sample analyzed generates multiple acquisitions. An envelope for each individual acquisition was generated using the Hilbert transform. This envelope was integrated to measure the total amount of signal generated from the laser pulse. In a previous study, these data were analyzed using R statistical software, where the number of acquisitions analyzed for the t-test were 203, 150, 160, and 131, for cells with NPs, cells alone, PBS, and NPs alone, respectively22. The data were normalized by log transformation and compared utilizing a Welch's t-test in R. The signals resulting from the FA-CuS NPs alone at a concentration of 100 µg/mL showed a much higher signal than the negative control. The difference in the signals between the negative control and the tagged ovarian CTCs were more subtle than the positive control but could be detected through the analysis of their means by a t-test22.
Utilizing custom LabView and MATLAB software, image reconstructions were made of the positive and negative controls in real-time and post-acquisition, respectively. In order to generate the photoacoustic reconstructions, an envelope of each acquisition was calculated using the Hilbert transform. Individual envelopes were subsequently converted into pixel values and displayed as independent columns. Clear differences in photoacoustic signal occur between the FA-CuS NPs at a concentration of 100 µg/mL and the PBS sample (Figure 5). Controls for the system are important to run to ensure that the system is adequately producing photoacoustic signal that can be detected by the transducer.
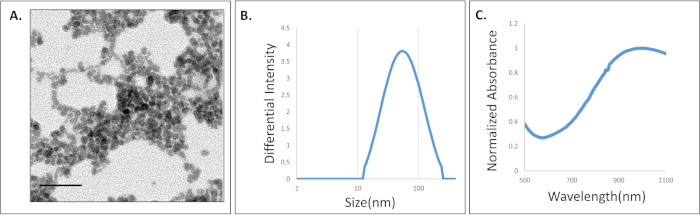
Figure 1: Representative NP characterization. (A) TEM image of synthesized FA-CuS NPs. Scale bar = 50 nm. (B) Representative DLS intensity distribution of synthesized FA-CuS NPs. (C) Representative FA-CuS NPs absorbance curve. Please click here to view a larger version of this figure.
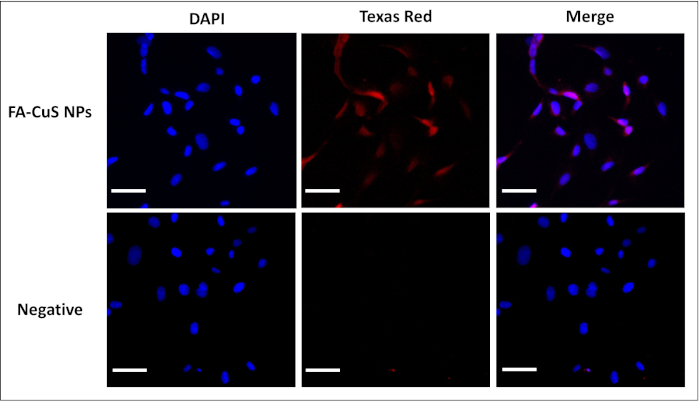
Figure 2: Representative fluorescence microscopy images of SKOV-3 cells. The cells were incubated with and without 400 µg/mL fluorescently-tagged NPs. Scale bar = 50 µm. Please click here to view a larger version of this figure.
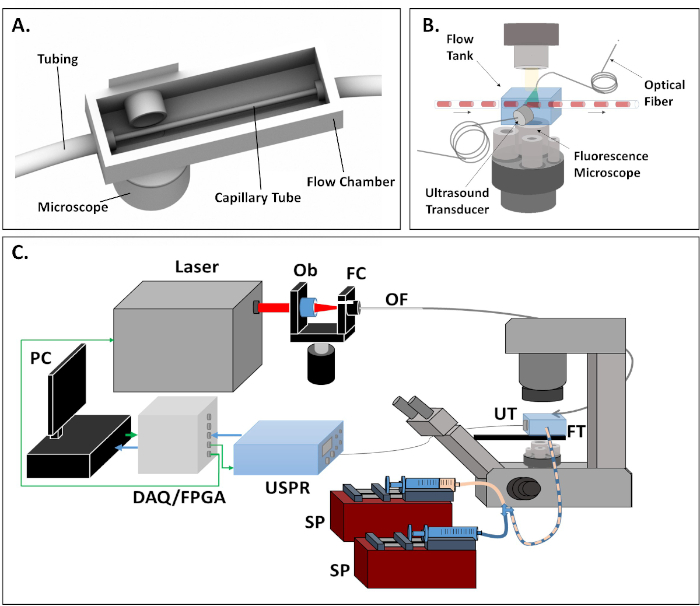
Figure 3: Representative images of photoacoustic flow cytometry system and flow chamber. (A) Detailed view of the 3D printed flow chamber. (B) Diagram of PAFC system. (C) Flow system architecture: SP = syringe pump; DAQ/FPGA = data acquisition/field programmable gate array; Ob = objective lens; OF = optical fiber; FC = fiber coupler; UT = ultrasound transducer; FT = flow tank. This figure is adapted from Lusk et al.22. Please click here to view a larger version of this figure.
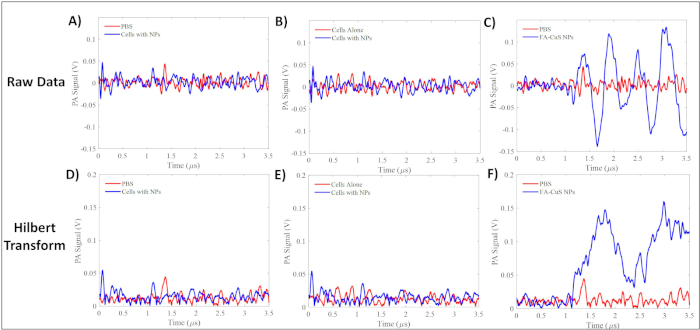
Figure 4: Representative raw data signal and Hilbert transforms of samples tested in the flow system. (A) Representative raw data signal from PBS and cells incubated with NPs and the (D) Hilbert transform of the data. (B) Representative raw data signal from the cells alone and the cells incubated with FA-CuS NPs and (E) the Hilbert transform of the data. (C) Representative raw data signal from PBS and 100 µg/mL FA-CuS NPs and (F) the Hilbert transform of the data. Please click here to view a larger version of this figure.
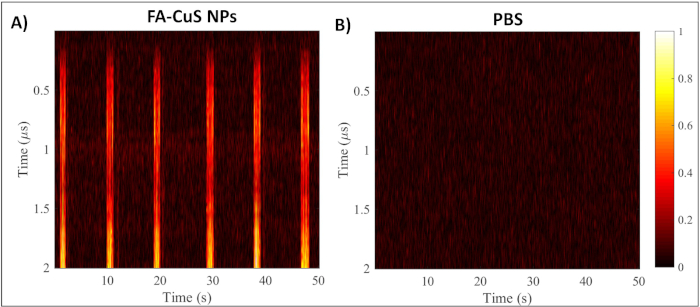
Figure 5: Representative photoacoustic image reconstructions of the photoacoustic data. (A) Image reconstruction of 100 µg/mL FA-CuS NPs and (B) PBS tested within the flow system. Please click here to view a larger version of this figure.
Supplementary File 1: Flow Chamber STL. Please click here to view this file (Right click to download).
