1. Generation of cysts
NOTE: This protocol can be performed with any type of hydrogel, if the gelation allows embedding of cells.
- Hydrogel coating
NOTE: Proper hydrogel coating of the chamber slide is a critical step to avoid the formation of 2D cell layers on the bottom of the well, that might interfere with subsequent cyst imaging and impair the calculation of cyst formation efficiency.- To ensure homogeneity of the gel solution, thaw the hydrogel at 4 °C overnight (O/N).
- Precool pipette tips on ice or O/N at -20 °C and an 8-well chamber slide at -20 °C O/N.
- Place the hydrogel and the 8-well chamber slide on an ice bucket filled with ice.
- In a 15 mL conical tube, prepare a solution containing 40% hydrogel (V/V) in cold NRC complete medium (see Table of Materials) and place the tube on ice.
- To coat a chamber slide, using cold pipette tips, add 50 μL of hydrogel solution on the center of each well, and spread over the whole surface using a pipette tip, while holding the chamber slide on ice (Figure 1A).
NOTE: Spread the hydrogel solution as evenly as possible avoiding bubbles. - To polymerize the hydrogel, incubate the chamber slide for at least 15 min at 37 °C, 5% CO2.
- Cell preparation
- Warm up NRC complete medium, phosphate buffered saline (PBS), and trypsin-ethylenediamine tetraacetic acid (trypsin-EDTA) in a water bath pre-heated to 37 °C.
- While the hydrogel is polymerizing, ensure that NRCs are grown to 70% confluency in a T-25 cm2 collagen-coated flask21. Wash the cells once with pre-heated 1x PBS.
- Incubate the NRCs with 5 mL of pre-heated 1x PBS (for a T-25 cm2 flask) for 20 min at 37 °C, 5% CO2.
NOTE: This step, which shortens the incubation time with trypsin-EDTA is instrumental in retaining the self-organizing properties of cells. - Discard the PBS, add 1 mL of trypsin-EDTA, and incubate for 5-10 min at 37 °C, 5% CO2.
- Neutralize with 4 mL of pre-heated complete NRC medium. Collect and transfer the cell suspension into a 15 mL conical tube, and spin at 150 x g for 4 min.
- Discard the medium and resuspend the cell pellet in 5 mL of pre-heated medium.
- Using a 40 μm cell strainer, filter the cell solution into a 50 mL conical tube and count the cells.
NOTE: Passing the cells through a strainer is a critical step for the quantitative results to be reproducible i.e., to get almost similar size of cell aggregates to be embedded.
- Embedding of cell suspension in hydrogel solution
- Prepare a solution of 1,600 µL of 80% hydrogel (V/V) in cold complete NRC medium (tube 1); keep in ice. Dilute 5 x 10⁵ cells/mL in 1,600 µL of cold complete NRC medium (tube 2) and keep in ice.
NOTE: This step must be performed quickly to avoid polymerization of the hydrogel while mixing it with the cell suspension and to maintain cell viability. - To prepare a cell seeding solution of 2.5 x 10⁵ cells/mL in 40% hydrogel (V/V), mix tube 1 and tube 2. Add 400 μL of the cell solution into each well of the hydrogel-coated chamber slide avoiding bubbles (Figure 1B).
- Keep the chamber slide in an incubator at 37 °C with 5% CO2 until media change.
- After 2 days in culture, remove 250 μL of the medium from a corner of each well, be careful to not pipette out the hydrogel. Then, slowly add 250 μL of the culture medium. Change the medium every 2 days.
NOTE: Minimize the movement of the chamber slide, particularly during the cyst initiation.
- Prepare a solution of 1,600 µL of 80% hydrogel (V/V) in cold complete NRC medium (tube 1); keep in ice. Dilute 5 x 10⁵ cells/mL in 1,600 µL of cold complete NRC medium (tube 2) and keep in ice.
2. Cyst quantification
- Cyst imaging
NOTE: This section should be performed quickly to not compromise the cell viability if the microscope is not equipped with a heating chamber to control CO2 and temperature. In order to ensure consistent quantification, representative of the cyst distribution in the full hydrogel volume, cysts are imaged via phase-contrast microscopy and serial imaging (Z-stacks), with pre-defined parameters throughout different time points.- Take a Z-stack along the depth of the hydrogel for each time point (Figure 1C, D). In this example, Z-stacks are taken at days 1, 2, 4, 7, and 10.
NOTE: Check that the initial cell distribution is uniform in the hydrogel to ensure the applicability of this method.- With a phase-contrast microscope equipped with an image acquisition software, select the 10x objective magnification in the manual nose-piece pad window (Figure 2B(1)).
- Switch on the white lamp and select the brightfield imaging option.
- Switch the camera on by selecting the “Play” button in the bar submenu. Focus on a field of cysts and set the exposure time (Figure 2B(2)). Open the Auto Capture Folder window for an automatic saving of images (Figure 2B(3)).
- Open the capture Z-series window and define with the Z screw the top and bottom planes of the Z-stack (same XY coordinates but different Z screened). Adjust the Z-step depending on the objective, the level of resolution and press the button “Run now” to launch the acquisition (Figure 2B(4)).
NOTE: In this example, cysts are spread over a hydrogel thickness of 520 µm. 26 images are acquired along the hydrogel depth with a 20 µm Z-step interval. Depending on the objective, the Z-step should be adjusted to not miss any cyst and to ensure the detection of single cells and aggregates. - Take at least 3 non-overlapping Z-stacks per well.
NOTE: This sampling is necessary when, like in this example, cysts are more numerous in the depth of the gel than on the edges due to heterogeneities in the hydrogel polymerization. - In order to have a representative dataset repeat step 2.1.1.5. for 3 wells in total.
NOTE: The heterogeneous distribution of cysts depends on the type of hydrogel, its polymerization, and the cell line. Considering three Z-stacks per well and three wells per experiment, a minimum of 200 cysts are imaged over nine Z-stacks to characterize cyst formation and cyst growth at each time point.
- Take a Z-stack along the depth of the hydrogel for each time point (Figure 1C, D). In this example, Z-stacks are taken at days 1, 2, 4, 7, and 10.
- Image processing
NOTE: In a hydrogel, NRCs can be found as single cells, cysts or aggregates. Cysts are identified by the presence of a round and thin contrasted cell shell enclosing a lumen, while cell aggregates present an irregular shape and do not have a lumen. Aggregates and single cells have a dense and contrasted appearance (Figure 3B(4)).- Open the Fiji software, open the Z-stack and go to the Fiji menu and click File | Open (Supplementary Figure 1). Select the Z-stack to analyze. If needed, select “Virtual Stack” option and click “Yes” for opening (Figure 3A(1)).
- Duplicate the stack via Image | Duplicate. Click on the box “Duplicate stack” and click “OK” (Supplementary Figure 2).
NOTE: In this example, Z-stacks are in .nd2 file format encoded in 16 bits. - Create a minimum intensity projection from the duplicated stack. Go to the Image menu | Stacks | Z Project. Select Projection type “Min Intensity” and click “OK” (Figure 3A(2)) (Supplementary Figure 3).
- Subtract the background from the projection. Go to the Process menu | Subtract Background. Type 500.0 pixels of rolling ball radius and click “light background” to render cysts more contrasted than the background (Figure 3A(3)) (Supplementary Figure 4).
NOTE: The rolling ball radius defines the size of the region on which background subtraction is operated. This parameter must be set to the size of the largest object to identify. - If contrast enhancement is needed, go to Image menu | Adjust | Brightness/Contrast | Auto | Apply. Fiji will automatically optimize brightness and contrast. In (Figure 3A(3)), the lower and upper gray values were set to 49702 and 65452, respectively (Supplementary Figure 5).
NOTE: If the projection is not calibrated, go to the Analyze menu | Set scale and type the corresponding calibration µm/pixel ratio (Supplementary Figure 6).
- Cyst counting and cyst size measurements
- To measure the approximate cyst diameter, select the Straight-line tool in the Fiji menu and draw a line across the diameter of each cyst on the final projection (Figure 3B(4)). Add the new region of interest (ROI) created for each cyst to the ROI manager: press the “t” shortcut on the keyboard for faster counting and opening of the ROI manager. Click “Show Tous” to see the counted cysts (Supplementary Figure 7)
- Check that no cyst has been left without counting by superimposing the set ROIs from the projection on the Z-stack. To do so, click on the Z-stack window to select it. In the ROI Manager, click “Show All” and move the cursor along the Z-stack to check that image per image, all cysts have been counted (Supplementary Figure 8).
- Once new cysts have been counted and ROIs added on step 2.3.1., select the ROI set and save it via the ROI Manager window by clicking More | Save (Supplementary Figure 9).
- Select all ROIs in the ROI Manager and click “Measure” in the ROI Manager to get the size of each cyst. This will open a new window of measurements named “Résultats” numbering each cyst and its estimated size. Then save in .csv format by clicking on the “Résultats” window and via the menu: File | Save As (Supplementary Figure 10).
NOTE: A macro can be created to semi-automatically process stacks, estimate cyst number/sizes from the projections, and store the data for faster counting procedure. To do so, select the tool “Record” in the bar menu, by clicking Plugins | Macros | Record.
- Quantification of cyst formation efficiency
- Count the number of cysts at day Y,
 on a projection (Y=1, 2, 4, 7 or 10).
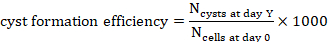
 - To calculate the cyst formation efficiency for 1000 cells at day Y, divide the number of cysts counted at that time point by the number of cells seeded at day 0 inferred from the hydrogel volume and multiply by 1000 (Figure 3C, Figure 4).
- Count the number of cysts at day Y,
3. Cell viability
- Prepare a stock solution of fluorescein diacetate (FDA) at 5 mg/mL by dissolving 5 mg of FDA in 1 mL acetone and store at -20 °C.
- Prepare a stock solution of propidium iodide (PI) at a concentration of 2 mg/mL in deionized water (dH2O) and store at 4 °C.
- Prepare NRC medium without fetal calf serum (FCS).
- To prepare the FDA/PI staining solution, add 4 μL of FDA stock solution (8 µg/mL final concentration) and 25 μL of PI stock solution (20 µg/mL final concentration) into 2.5 mL of NRC medium without FCS.
- Remove the medium from the chamber slide, add 250 μL of staining solution into each well and incubate 4-5 min in the dark at 37 °C, 5% CO2. Pipette out the staining solution carefully and wash once with 250 μL of 1x PBS.
- Carefully add 250 μL of complete NRC medium to each well and take pictures using an inverted fluorescence microscope with Texas red and fluorescein isothiocyanate (FITC) filters. Live cells will be green and dead cells will be red (Figure 5A).
NOTE: In order to quantify live/dead cells, take Z-stacks across the hydrogel volume following step 2 and adapt the image processing method for fluorescence.
4. Secretion activity
NOTE: The secretion activity through the apical membrane of the cholangiocytes is assessed by the secretion of fluorescein in the lumen. Its specificity can be evaluated by doing the same test with Verapamil, a multi-drug resistant (MDR) transporter inhibitor24.
- To prepare a staining solution of Hoechst 33258 at 5 µg/mL, add 0.83 μL of Hoechst stock solution (15 mg/mL stock concentration in dH2O) in 2.5 mL of NRC medium without FCS.
- Add 250 μL of Hoechst solution in each well and incubate at 37 °C, 5% CO2 for 15 min.
- Remove the Hoechst solution and add 250 µL of FDA solution (8 µg/mL final concentration) in each well. Incubate 4-5 min at 37 °C, 5% CO2.
NOTE: As soon as cells are exposed to FDA staining solution, the follow up of fluorescein secretion kinetics might be useful to calibrate the time needed for cysts to secrete. To do so, take pictures every min for 1 h via time-lapse imaging. In this example, the time needed to observe NRC secreting cysts in the hydrogel is about 15-20 min. - Take images using an inverted fluorescence microscope 5 min after rinsing with medium without FCS. Use 4′,6-diamidino-2-phenylindole (DAPI) and FITC filters to reveal nuclei labeling and fluorescein accumulation in the lumen (Figure 6A). To quantify the number of secreting cysts, take Z-stacks as in step 2 and adapt the image processing steps to fluorescent images.
NOTE: For the Verapamil test, precede the previous process (steps 4.3. to 4.4.) by an incubation with Verapamil, according to the following conditions: - Prepare a stock solution of 10 mM Verapamil in dimethyl sulfoxide (DMSO). To prepare 10 µM working solution, mix 2.5 μL of Verapamil stock solution with 2.5 mL culture medium without FCS.
- To assess that the fluorescence in the lumen results from MDR secretion, take another slide and add 250 µL of Verapamil working solution in each well and incubate 20 min at 37° C, 5% CO2
- Remove the solution and add 250 µL of FDA solution (8 µg/mL final concentration) into each well. Incubate 4-5 min in the dark at 37 °C, 5% CO2. Then, wash with 250 μL of 1x PBS, before imaging (Figure 6B, C).
5. Epithelial polarity assessment by immunofluorescence
- To prepare the fixing solution, mix 4% formaldehyde with 5% sucrose, in 1x PBS, pH 7.4 and incubate in a water bath pre-heated at 37 °C.
- To fix the cells, gently pipette out the culture medium from the well without damaging the matrix. Slowly add 400 µL of the fixing solution to the side of the wells. Incubate for 20 min at room temperature (RT).
NOTE: Always leave 25 µL of the liquid above the matrix to prevent its damage. - Gently remove the fixing solution and wash 3x with 400 μL of 1x PBS at (RT).
- Pipette out the PBS, add 400 µL of permeabilization solution (0.5% Triton X-100 in 1x PBS) and incubate 10 min at RT.
- Gently remove the permeabilization solution, followed by 3 quick washes with 400 μL of 1x PBS and a long washing step of 30 min at RT.
NOTE: At this step, the slide can be stored at 4 °C for 2 days. In this case, seal the slide with a paraffin film to prevent evaporation and matrix drying. - Remove the PBS, add 400 µL of blocking solution containing 0.1% bovine serum albumin (BSA) and 10% goat serum in 1x PBS and incubate for 60 min at RT.
CAUTION: Concentrations of BSA higher than 0.1% will result in lumen retraction and further cyst collapse (see Representative Results section) (Figure 7A). - Pipette out the blocking solution and wash once with 400 µL of PBS/0.05% Tween 20 and discard.
- Add 150 µL of the antibody solution, e.g., E-cadherin antibody diluted 1:400 and Phalloidin 568 (16.2 nM final concentration) in 1x PBS and incubate for 90 min at RT.
NOTE: This dilution of E-cadherin is the same used as in a standard 2D immunofluorescence protocol. - Wash the sample with 400 µL of PBS/0.05% Tween 20, 3x; each time incubating the sample for 10 min at RT.
- Add 150 µL of the secondary antibody (goat anti-rabbit IgG Alexa Fluor Plus 647), diluted 1:500 in 1x PBS and incubate 60 min at RT.
- Wash 3x with 400 µL of PBS/0.05% Tween 20, each time incubating the sample for 10 min at RT.
- Wash 3x with 400 µL of 1x PBS, each time incubating the sample for 10 min at RT.
- Discard the PBS of the last wash and prepare the chamber slide for visualization via confocal microscopy following one of the two options below.
- Add 400 μL of 1x PBS and 50 μL of DAPI per well. The samples can be examined through the bottom of the well without the need of mounting with a coverslip (Figure 7B).
- Add 100 µL per well of antifade reagent containing DAPI and let the slide drying O/N at RT.
Formation and characterization of cysts
3D cell culture systems are an important tool to study organogenesis and disease modeling25. Unfortunately, most of these methods are qualitative or use internal quantification performed on a single plane by comparing the number of cysts versus non-cysts, in variable and often unspecified volumes, preventing any comparison in terms of cyst formation efficiency between the various studies7,8,9,10,15,18,23. The method proposed in this protocol, by recording the whole number of cysts and their respective sizes over the time of the experiment, allows for the analysis of the evolution of cyst formation and growth (Figure 4).
Based on phase contrast images, on day 0, 8 hours after cell seeding mostly small cell aggregates are found embedded into the hydrogel. On day 1, small cysts of median diameter of 42.95 (26.53, 50.47) (first, third quartile) μm and fusion of cysts scattered throughout the hydrogel are noticeable. By day 4, it is common to observe aggregate structures as well as cysts of median diameter of 75 (56.48, 97.97) μm. By days 7 and 10 the median cyst diameter reached 108.67 (75.31, 141.76) μm and 186.46 (113.98, 278.29) μm, respectively (Figure 4A-C). Interestingly, the cyst formation efficiency increases from 70.03 ± 5.05 cysts/1000 cells on day 1 to 99.83 ± 12.81 cysts/1000 cells on day 4 remaining constant till day 10 (Figure 4B), suggesting that cysts form essentially from cell aggregates that are present at the time of the embedding or that form during the next 48h, through cell migration or the fusion of small cell aggregates. With regards to the cyst size evolution, while the mean size follows a slow and regular slope, the size distribution increases widely along the culture time, illustrating that the various cysts do not grow at the same speed. Interestingly, this can be linked to our observation (not shown) that cysts are not evenly distributed in the hydrogel, the biggest cysts lying in the center of the hydrogel volume. Since the increase of the cyst diameter mainly relies on the secretion activity (since the cell division rate is limited in NRC derived cysts), it can be inferred that this activity is highly dependent on the hydrogel properties that are not homogenous in the cell culture volume.
We then confirmed the viability of cells after embedding them into the hydrogel (day 0) and cysts on day 10 using FDA/PI live staining (Figure 5A). FDA is a non-fluorescent molecule that only live cells, through an enzymatic reaction, are able to convert to the green fluorescent compound fluorescein26. PI is a non-permeant molecule for live cells that intercalates in the DNA of necrotic cells27. Interestingly, dead cells that represent less than 3% of the whole cells in the culture volume at day 10, are mostly found outside the cysts, as isolated cells or part of small aggregates. However, we noticed that debris from necrotic cells accumulate in some large cysts at day 10 (Figure 5B). Therefore, for the maintenance of cystic cultures, passaging of cysts is recommended before 10 days in those conditions.
Functional assessment
In physiological conditions, the main function of cholangiocytes is to modify canalicular bile via absorptive and secretory mechanisms of which the MDR channel is a key player28. To assess the functionality of cysts, we incubated day 10 cysts with FDA/Hoechst and observed formation of fluorescein and its secretion from the basal into the apical luminal space (Figure 6A,B). Thus, confirming that NRCs in cysts retain their secretory functions. Moreover, the secretion of fluorescein was inhibited by pre-treatment of cysts with the MDR inhibitor Verapamil (Figure 6C), showing that the accumulation of fluorescence FDA into the lumen was due to the secretion through MDR transporter and not by leaking from the intercellular space.
Assessment of cyst polarity
In order to establish polarization of the NRC cysts, we conducted a series of optimization steps in the immunofluorescence protocol. One main hindering in the examination of epithelial cell polarity in the cysts is the frequent collapse of the organoid architecture during the immunofluorescence process, due to the leakage of the fluid contained in the lumen. To circumvent this problem, each step of the immunofluorescence protocol has been evaluated by testing how various conditions might affect the maintenance of cyst structure. We found that modulating the fixing (formaldehyde (2-4%) + sucrose (5-10%)) or permeabilization conditions (0.1-1% of both Triton X-100 and sucrose) did not have much impact on the cyst architecture. These ranges can be used to strongly fix and gently permeabilize the cholangiocytes (Figure 7A). However, we observed that keeping BSA at 0.1% or less during saturation is a key step in maintaining cyst integrity, as higher concentrations result in cyst retraction and lumen collapse (Figure 7A).
Cholangiocyte functions are dependent on their proper apico-basolateral polarity29. To verify that the NRC cysts self-assemble in hydrogel as polarized structures, we confirmed the apical and basolateral localization of F-actin and E-cadherin, respectively. E-cadherin expression in our cysts also indicates that NRCs maintain their epithelial phenotype in hydrogel (Figure 7B) during at least 10 days.
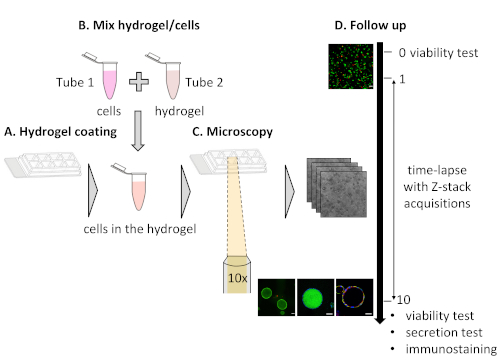
Figure 1: Experimental workflow of cyst formation and characterization. (A) Hydrogel coating of the chamber slide. (B) Cell embedding in the hydrogel. (C) Microscopy of cyst formation. (D) A 10-day follow up assessment of cyst growth, viability, functionality, and polarization. Please click here to view a larger version of this figure.
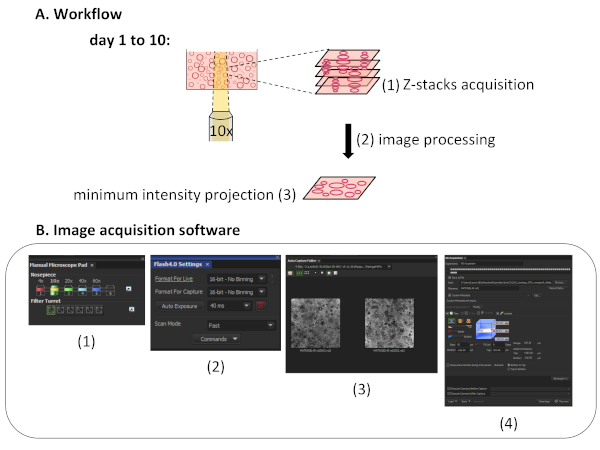
Figure 2: Image acquisition method. (A) Workflow of the Z-stack acquisition performed along the hydrogel depth from day 1 to 10: Z-stack acquisition (1) image processing of the Z-stack (2) generation of a minimum intensity projection and cyst quantification (3). (B) Image acquisition software screenshots showing the selection of the objective (1), the adjustment of parameters (2), the automatic saving of images (3), and the Z-stack calibration (4). Please click here to view a larger version of this figure.
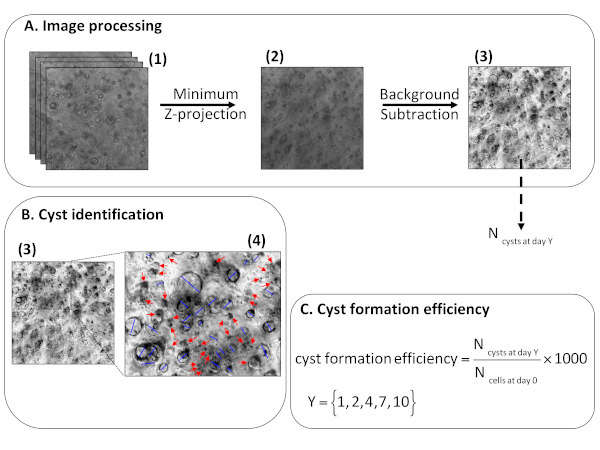
Figure 3: Method for the quantification of cyst size and cyst formation efficiency. (A) Image processing layout depicting: Z-stacks to analyze (1), its minimum intensity Z-projection (2), the final Z-projection after background subtraction (3) used for cyst counting and cyst size estimation. (B) Cyst identification on the projection (A3) with a zoom of the projection (4) to show the identification of cysts featured by a dark cell shell enclosing a brighter lumen, which are distinguished by blue lines plotted for diameter measurement vs aggregates with a dark and irregular appearance pointed by red arrows. (C) The formula for calculation of cyst formation efficiency for 1,000 cells. Please click here to view a larger version of this figure.
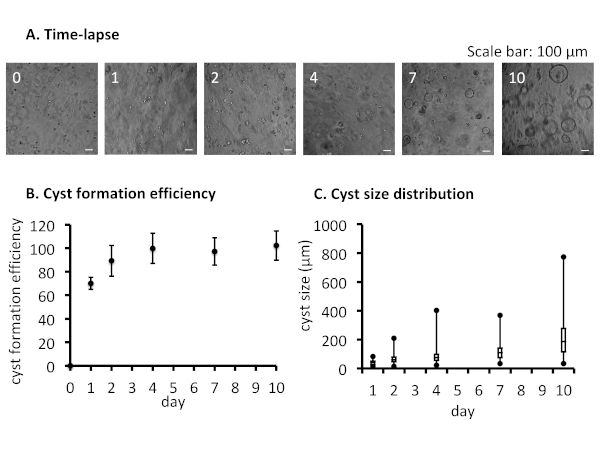
Figure 4: Cyst formation efficiency and cyst size distribution in the hydrogel. (A) Time-lapse showing representative phase contrast images at days 0, 1, 2, 4, 7, and 10 of the 3D cultures. (B) Plot graph with the kinetics of mean cyst formation efficiency ± SEM (n=3). (C) Box and whisker plot showing the cyst size distribution over the time of culture. Black bars represent the first quartile, the median and the third quartile; lines represent the width of the distribution; black dots represent the minimum and the maximum of the distribution, n=3. Please click here to view a larger version of this figure.
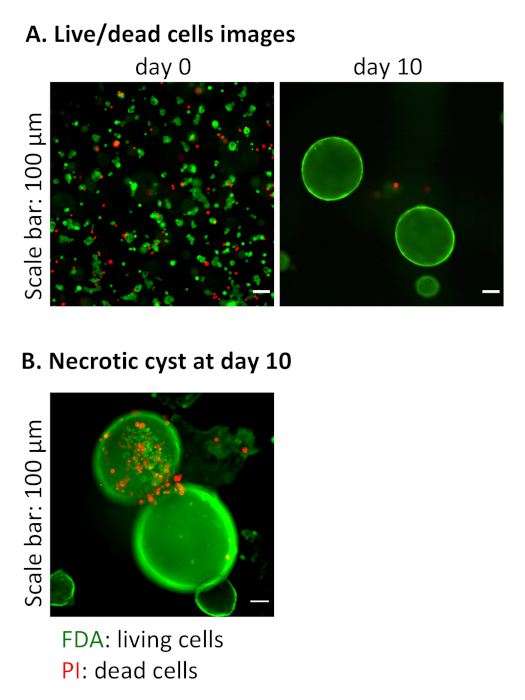
Figure 5: Viability of NRC cysts in the hydrogel. (A) Representative fluorescent live images of cultures at day 0 and at day 10, stained with FDA (green=live) and PI (red=dead). Note that the red fluorescence was mainly associated to single cells. (B) Representative fluorescent live image of a necrotic cyst at day 10, where the dead cells (in red) were seen accumulating in the lumen. Please click here to view a larger version of this figure.
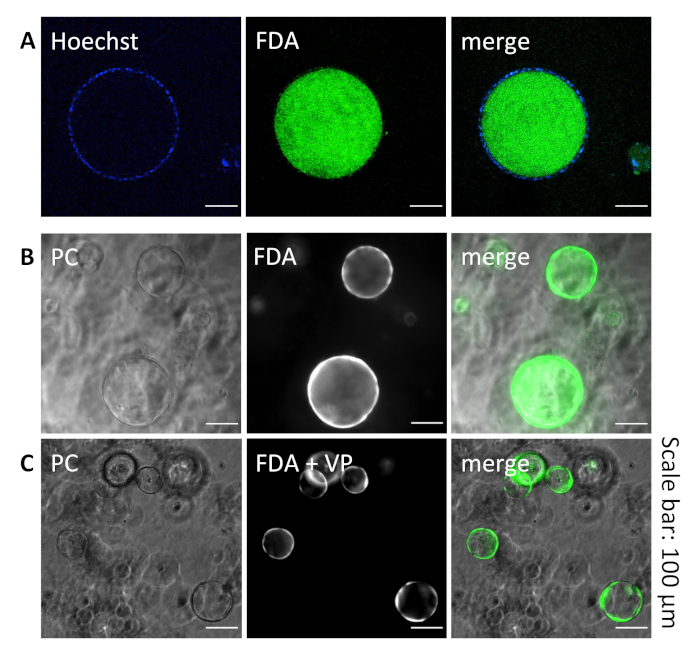
Figure 6: Functionality of NRC cysts in the hydrogel. (A) Representative fluorescent live images of a 10-day cyst where the cell’s layer was revealed by nuclei labeling with Hoechst (blue) and the lumen by the secreted FDA (green). (B) Representative phase contrast/fluorescent live images after a secretion test with FDA, which was shown accumulated in the lumen. (C) After the exposition to Verapamil, an MDR inhibitor, representative phase contrast/fluorescent live images of cysts showing that FDA was retained in the cell’s layer. Please click here to view a larger version of this figure.
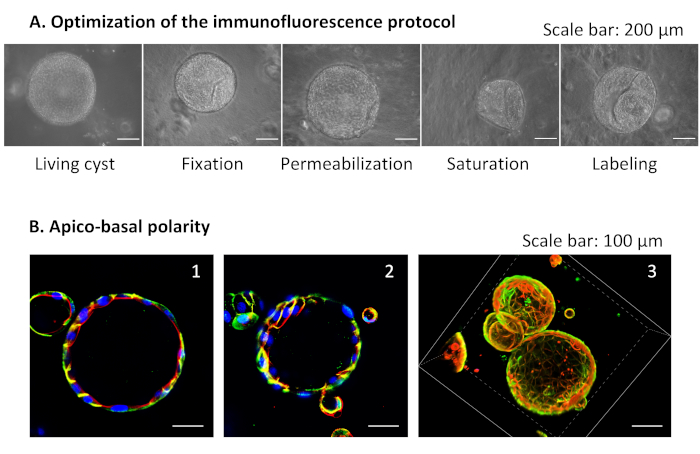
Figure 7: Immunofluorescence of NRC cysts in the hydrogel. (A) Optimization of the immunofluorescence protocol with bright field images showing representative cyst shapes at each step of the protocol. From left to right: (Living cyst) a live cyst in complete medium before fixation, (Fixation) a cyst after fixation, (Permeabilization) another cyst after permeabilization, (Saturation) a cyst after the saturation step and (Labeling) a cyst at the immunolabeling step. (B) (1-2): Confocal images of a section through a cyst showing the apical surface marker F-actin (red-orange), the basolateral marker E-cadherin (green) and the nuclei stained with DAPI (blue). (3): 3D reconstitution of a set of cysts with the following labelings: red-orange for F-actin and green for E-cadherin. Please click here to view a larger version of this figure.
Supplementary Figure 1: Opening of a stack. Screenshot captures of the software depicting the procedure to open a Z-stack. Please click here to view a larger version of this figure.
Supplementary Figure 2: Stack duplication. Screenshot captures of the software showing the process to duplicate a Z-stack. Please click here to view a larger version of this figure.
Supplementary Figure 3: Generation of a minimum intensity projection. Screenshot captures of the software illustrating the procedure to create a minimum intensity projection from the duplicated Z-stack. Please click here to view a larger version of this figure.
Supplementary Figure 4: Background removal. Screenshot captures of the software portraying the method to remove the background from the Z-stack projection. Please click here to view a larger version of this figure.
Supplementary Figure 5: Contrast enhancement. Screenshot captures of the software outlining the steps to enhance the contrast of the Z-stack projection. Please click here to view a larger version of this figure.
Supplementary Figure 6: Picture calibration. Screenshot captures of the software delineating the process to calibrate the Z-stack and the Z-stack projection in microns. Please click here to view a larger version of this figure.
Supplementary Figure 7: Cyst counting. Screenshot captures of the software depicting the procedure to count cysts on the Z-stack projection with the straight-line tool. Please click here to view a larger version of this figure.
Supplementary Figure 8: Cyst counting check-up. Screenshot captures of the software outlining the method to compare the number of cysts counted on the Z-stack projection and the Z-stack. Please click here to view a larger version of this figure.
Supplementary Figure 9: ROI saving. Screenshot captures of the software showing how to save the ROI set defined by the countings. Please click here to view a larger version of this figure.
Supplementary Figure 10: Cyst size and number measurements. Screenshot captures of the software detailing how to measure and save cyst size and cyst number from the Z-stack projection and the Z-stack. Please click here to view a larger version of this figure.
