DNA computing uses a set of designed oligonucleotides as the medium for computation. These oligonucleotides are programmed with sequences to dynamically assemble according to user-specified logic and respond to specific nucleic-acid inputs. In proof-of-concept studies, the output of the computation typically consists of a set of fluorescently labelled oligonucleotides that can be detected via gel electrophoresis or fluorescence plate readers. Over the past 30 years, increasingly complex DNA computational circuitries have been demonstrated, such as various digital logic cascades, chemical reaction networks, and neural networks1,2,3. To assist with the preparation of these DNA circuits, mathematical models have been used to predict the functionality of synthetic gene circuits4,5, and computational tools have been developed for orthogonal DNA sequence design6,7,8,9,10. Compared to silicon-based computers, the advantages of DNA computers include their ability to interface directly with biomolecules, operate in solution in the absence of a power supply, as well as their overall compactness and stability. With the advent of next-generation sequencing, the cost of synthesizing DNA computers has been decreasing for the past two decades at a rate faster than Moore's Law11. Applications of such DNA-based computers are now beginning to emerge, such as for disease diagnosis12,13, for powering molecular biophysics14, and as data storage platforms15.
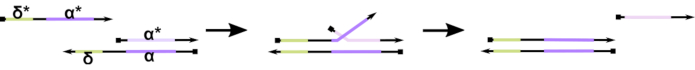
Figure 1: Mechanism of toehold-mediated DNA strand displacement. The toehold, δ, is a free, unbound sequence on a partial duplex. When a complementary domain (δ*) is introduced on a second strand, the free δ domain serves as a toehold for hybridization, allowing for the rest of the strand (ɑ*) to slowly displace its competitor through a zipping/unzipping reversible reaction known as strand migration. As the length of δ increases, the ΔG for the forward reaction decreases, and displacement happens more readily. Please click here to view a larger version of this figure.
To-date, the majority of DNA computers utilize a well-established motif in the field of dynamic DNA nanotechnology known as toehold-mediated DNA strand displacement (TMDSD, Figure 1)16. This motif consists of a partially double-stranded DNA (dsDNA) duplex displaying short "toehold" overhangs (i.e., 7- to 10 nucleotides (nt)). Nucleic acid "input" strands can interact with the partial duplexes through the toehold. This leads to the displacement of one of the strands from the partial duplex, and this liberated strand can then serve as input for downstream partial duplexes. Thus, TMDSD enables signal cascading and information processing. In principle, orthogonal TMDSD motifs can operate independently in solution, enabling parallel information processing. There have been a number of variations on the TMDSD reaction, such as toehold-mediated DNA strand exchange (TMDSE)17, "leakless" toeholds with double-long domains18, sequence-mismatched toeholds19, and "handhold"-mediated strand displacement20. These innovative design principles allow more finely tuned TMDSD energetics and dynamics for improving DNA computing performance.
Synthetic gene circuits, such as transcriptional gene circuits, are also capable of computation21,22,23. These circuits are regulated by protein transcription factors, which activate or repress transcription of a gene by binding to specific regulatory DNA elements. Compared to DNA-based circuits, transcriptional circuits have several advantages. First, enzymatic transcription has a much higher turnover rate than existing catalytic DNA circuits, thus generating more copies of output per single copy of input and providing a more efficient means of signal amplification. In addition, transcriptional circuits can produce different functional molecules, such as aptamers or messenger RNA (mRNA) encoding for therapeutic proteins, as computation outputs, which can be exploited for different applications. However, a major limitation of current transcriptional circuits is their lack of scalability. This is because there is a very limited set of orthogonal protein-based transcription factors, and de novo design of new protein transcription factors remains technically challenging and time-consuming.
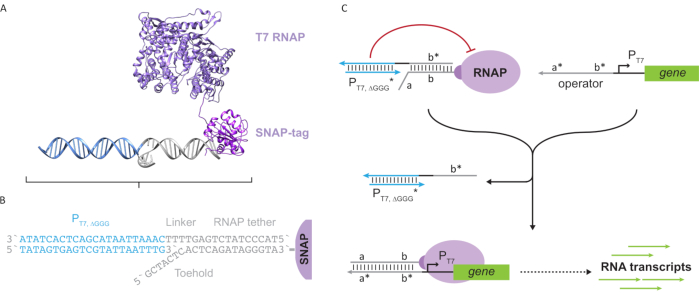
Figure 2: Abstraction and mechanism of "tether" and "cage" polymerase complex. (A and B) An oligonucleotide tether is enzymatically labelled to a T7 polymerase through the SNAP-tag reaction. A cage consisting of a "faux" T7 promoter with a tether-complement overhang allows it to hybridize to the tether and block transcriptional activity. (C) When the operator (a*b*) is present, it binds to the toehold on the oligonucleotide tether (ab) and displaces the b* region of the cage, allowing transcription to occur. This figure has been modified from Chou and Shih27. Abbreviations: RNAP = RNA polymerase. Please click here to view a larger version of this figure.
This paper introduces a novel building block for molecular computing that combines the functionalities of transcriptional circuits with the scalability of DNA-based circuits. This building block is a T7 RNAP covalently attached with a single-stranded DNA tether (Figure 2A). To synthesize this DNA-tethered T7 RNAP, the polymerase was fused to an N-terminal SNAP-tag24 and recombinantly expressed in Escherichia coli. The SNAP-tag was then reacted with an oligonucleotide functionalized with the BG substrate. The oligonucleotide tether allows the positioning of molecular guests in close proximity to the polymerase via DNA hybridization. One such guest was a competitive transcriptional blocker referred to as a "cage", which consists of a "faux" T7 promoter DNA duplex with no gene downstream (Figure 2B). When bound to the RNAP via its oligonucleotide tether, the cage stalls polymerase activity by outcompeting other DNA templates for RNAP binding, rendering the RNAP in an "OFF" state (Figure 2C).
To activate the polymerase to an "ON" state, T7 DNA templates with single-stranded "operator" domains upstream of the T7 promoter of the gene were designed. The operator domain (i.e., domain a*b* Figure 2C) can be designed to displace the cage from the RNAP via TMDSD and position the RNAP proximal to the T7 promoter of the gene, thus initiating transcription. Alternatively, DNA templates were also designed where the operator sequence was complementary to auxiliary nucleic-acid strands that are referred to as "artificial transcription factors" (i.e., TFA and TFB strands in Figure 3A). When both strands are introduced into the reaction, they will assemble at the operator site, creating a new pseudo-contiguous domain a*b*. This domain can then displace the cage via TMDSD to initiate transcription (Figure 3B). These strands can be supplied either exogenously or produced.
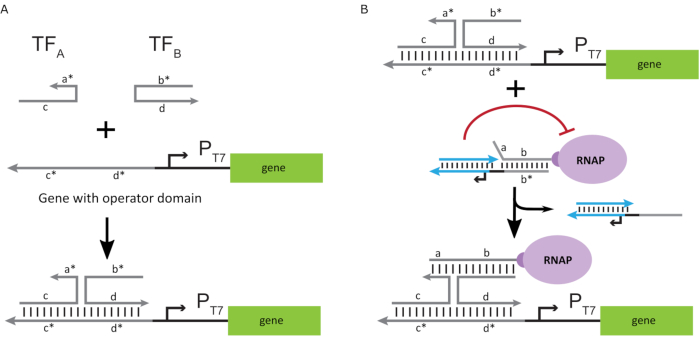
Figure 3: Selective programming of polymerase activity through a three-component switch activator. (A) When the transcription factors (TFA and TFB) are present, they bind to the operator domain upstream of the promoter, forming a pseudo single-stranded sequence (a*b*) capable of displacing the cage through toehold mediated DNA displacement. (B) This a*b* domain can displace the cage via TMDSD to initiate transcription. This figure has been modified from Chou and Shih27. Abbreviations: TF = transcription factor; RNAP = RNA polymerase; TMDSD = toehold-mediated DNA strand displacement. Please click here to view a larger version of this figure.
The use of nucleic acid-based transcription factors for in vitro transcriptional regulation allows the scalable implementation of sophisticated circuit behaviors such as digital logic, feedback, and signal cascading. For example, one can build logic gate cascades by designing nucleic acid sequences such that the transcripts from an upstream gene activate a downstream gene. One application that exploits the cascading and multiplexing made capable by this proposed technology is the development of more sophisticated molecular computing circuitries for portable diagnostics and molecular data processing. In addition, integrating the molecular computing and de novo RNA synthesis capabilities can enable new applications. For example, a molecular circuit can be designed to detect one or a combination of user-defined RNAs as inputs and output therapeutic RNAs or mRNAs encoding functional peptides or proteins for point-of-care medical applications.
1. Buffer preparation
NOTE: Protein purification buffer preparation can occur on any day; here, it was done prior to beginning the experiments.
- Prepare lysis/equilibration buffer containing 50 mM tris(hydroxymethyl)aminomethane (Tris), 300 mM sodium chloride (NaCl), 5% glycerol, and 5 mM β-mercaptoethanol (BME), pH 8. Add 1.5 mL of 1M Tris, 1.8 mL of 5M NaCl, 1.5 mL of glycerol, 25.2 mL of deionized water (ddH2O) into a 50 mL centrifuge tube, and add 10.5 µL of 14.2 M BME just prior to use.
NOTE: Tris can cause acute toxicity; hence, avoid breathing its dust, and avoid skin and eye contact. BME is toxic and should only be used in a fume hood. It is important to add BME last, just prior to resuspension and cell lysis. See Table 1 for lysis buffer formula. - Prepare wash buffer (pH 8) containing 50 mM Tris, 800 mM NaCl, 5% glycerol, 5 mM BME, and 20 mM imidazole. Add 1.5 mL of 1 M Tris, 4.8 mL of 5 M NaCl, 1.5 mL of glycerol, and 22.2 mL of ddH2O into a 50 mL centrifuge tube. Just prior to use, add 7 µL of 14.2 M BME and 200 µL of 2 M imidazole to 20 mL of the above solution.
NOTE: To prevent acute toxicity due to imidazole, use personal protective equipment. It is important to add BME and imidazole last, just prior to washing the protein out of the column. See Table 2 for wash buffer formula. - Prepare elution buffer (pH8) containing 50 mM Tris, 800 mM NaCl, 5% glycerol, 5 mM BME, and 200 mM imidazole. Add 0.5 mL of 1 M Tris, 1.6 mL of 5 M NaCl, 0.5 mL of glycerol, and 6.4 mL of ddH2O to a 15 mL centrifuge tube. Just prior to use, add 3.5 µL of 14.2 M BME and 1 mL of 2 M imidazole to 10 mL of the above solution.
NOTE: It is important to add BME and imidazole last, just prior to eluting the protein out of the column. See Table 3 for elution buffer formula. - Prepare 2x storage buffer (to be mixed 1:1 with glycerol) containing 100 mM Tris, 200 mM NaCl, 40 mM BME, and 2 mM ethylenediaminetetraacetic acid (EDTA), 0.2% of a non-ionic surfactant (see the Table of Materials). Prepare 50 mL of the storage buffer by adding 5 mL of 1 M Tris, 2 mL of 5 M NaCl, 42.56 mL of ddH2O, 200 µL of 0.5 M EDTA, 100 µL of the non-ionic surfactant to a 50 mL centrifuge tube. Mix until the solution is homogeneous, filter the storage buffer through a 0.2 µm syringe filter, and add 140.8 µL of BME to the above solution prior to use.
NOTE: To avoid acute toxicity due to EDTA, avoid breathing its dust, and avoid skin and eye contact. It is important to add BME last and mix the entire storage buffer 1:1 with glycerol, just prior to storing the purified protein. See Table 4 for storage buffer formula.
2. Overnight culture growth: Day 1
- Prepare 1,000x kanamycin stock by dissolving 500 mg of kanamycin in 10 mL of ddH2O.
NOTE: Use personal protective equipment to prevent acute toxicity due to kanamycin. - Add 20 µL of the 1,000x kanamycin stock to 20 mL of lysogeny broth. Using a sterile pipette tip, poke a transformed BL21 E. coli glycerol stock and then inoculate the culture by introducing the tip into the growth media broth.
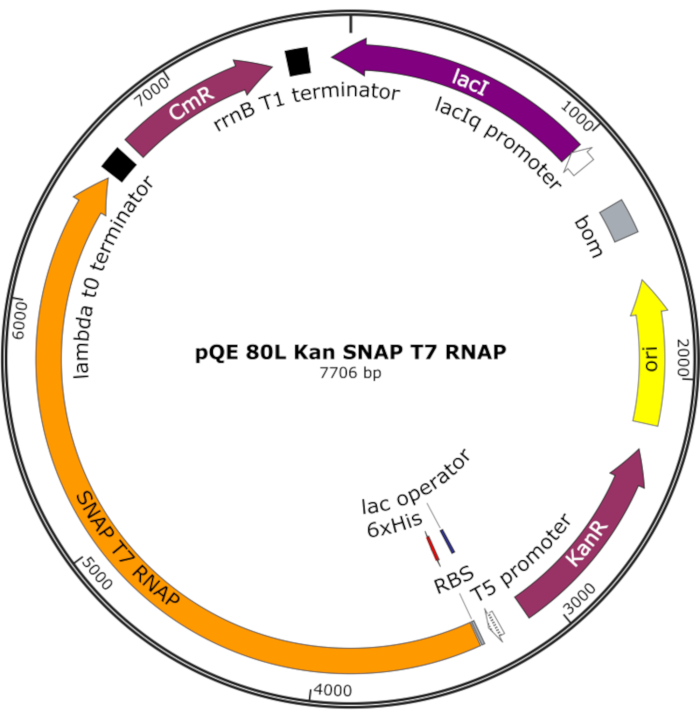
Figure 4: Plasmid map for SNAP T7 RNAP. The plasmid encodes a T7 RNAP containing an N-terminal histidine tag (6x His) and SNAP-tag domain (SNAP T7 RNAP) under a lac repressor (lacI) on a pQE-80L backbone. Other features include kanamycin resistance (KanR) and chloramphenicol resistance (CmR) genes. Abbreviation: RNAP = RNA polymerase. Please click here to view a larger version of this figure.
NOTE: The plasmid encodes a T7 RNAP containing an N-terminal histidine tag and a SNAP-tag domain (SNAP T7 RNAP), as well as a kanamycin resistance gene under a pQE-80L backbone (Figure 4)25.
- Again, add 20 µL of the 1,000x kanamycin stock to a separate culture flask containing 20 mL of lysogeny broth, and incubate it as a control.
- Incubate the two samples (from steps 2.2 and 2.3) overnight for 12-18 h at 37 °C, while rotating at 10 × g.
3. Cell growth and induction: Day 2
- Inoculate 400 mL of lysogeny broth containing 400 µL of kanamycin stock with 4 mL of the overnight growth culture from step 2.4. Incubate the culture flasks at 37 °C, while rotating at 10 × g.
- Once the culture has reached an optical density (OD) at 600 nm of ~0.5, take out 1 mL of sample from the growth flask as a control. Store the control sample at 4 °C.
- Induce the cells with isopropyl β-D-1-thiogalactopyranoside (IPTG) by adding 40 µL of 1M IPTG per 100 mL of culture to achieve a final concentration of 0.4 mM IPTG. Incubate the sample for 3 h at 37 °C, rotating at 10 × g, and then spin the induced culture at 8,000 × g for 10 min to pellet the cells. Remove the supernatant, and store the pellet at -20 °C until further use.
NOTE: To avoid acute toxicity due to IPTG, avoid breathing its dust, and avoid skin and eye contact. If necessary, you can pause the experiment here and continue the next day.
4. Cell lysis, protein purification: Day 3
- Resuspend the stored cell pellet with 10 mL of lysis buffer on ice, and gently swirl to ensure the entire pellet is resuspended. Then, pipette 1 mL of sample into ten 1.5 mL tubes that are kept on ice.
- Sonicate each sample at an amplitude setting of "1", pulsed for 2 s with a 50% duty cycle over a period of 30 s. Before and after each sample, clean the sonication tip with 70% ethanol and ddH2O. Keep all samples on ice during and after sonication.
NOTE: Keep 70% ethanol away from heat and open flame. - Equilibrate a nickel-charged nitrilotriacetic acid (Ni-NTA) purification spin column to a working temperature of 4 °C. Place/store the column at 4 °C, and keep on ice during use.
- Centrifuge the ten 1 mL samples at 15,000 × g for 20 min at 4 °C. Carefully pipette out the supernatant containing the recombinant RNAP without disturbing the pellet. If necessary, use additional equilibration buffer to adjust the total volume to ≥ 6 mL.
- Gently remove the bottom tab from the Ni-NTA spin column to allow for flow through the column. Place the column in a centrifuge tube, and keep it on ice.
NOTE: Use a 50 mL centrifuge tube with the 3 mL Ni-NTA spin columns. - Centrifuge the column at 700 × g and 4 °C for 2 min to remove the storage buffer. Equilibrate the column by adding 6 mL of equilibration buffer to the column. Allow the buffer to fully enter the resin bed.
- Remove the equilibration buffer from the column by centrifugation at 700 × g and 4 °C for 2 min. Before adding the prepared cell extract to the column, place a bottom plug on the column to avoid losing any product. Then, add the cell extract to the column, and mix on an orbital shaker mixer for 30 min at 4 °C.
- Remove the bottom plug from the column and place the column in a 50 mL centrifuge tube labeled flow through. Centrifuge the column at 700 × g for 2 min to collect the flow through.
- Add 6 mL of wash buffer to the column to wash the resin. Centrifuge the column at 700 × g for 2 min to collect the fraction in a new centrifuge tube labeled wash 1. Repeat this step two more times for a total of 3 separate fractions, and collect the fractions in separate centrifuge tubes (wash 2 and wash 3).
- Add 3 mL of elution buffer to elute the His-tagged proteins from the resin. Centrifuge the column at 700 × g for 2 min to collect fraction in a new centrifuge tube labeled eluate 1. Repeat this step two more times for a total of 3 separate fractions, and collect the fractions into separate centrifuge tubes (eluate 2 and eluate 3).
- Combine the eluates and perform desalting to remove salts from the protein solution.
- Pipette 15 mL of 0.05 % w/v polysorbate 20 over a 100 kDa centrifugal filter unit. Centrifuge at 4,000 × g for 40 min and discard the flow-through.
- Use the coated filter to concentrate the eluates 1, 2, and 3 (9 mL of total of protein eluate + 6 mL of storage buffer) to ~1,500 µL. Centrifuge the filter at 3,220 × g for 20 min, and gently pipette-wash the membrane to prevent precipitation.
- Dilute the sample to 15 mL with storage buffer. Perform a buffer exchange using storage buffer 1:1,000 by repeating step 4.11.2 two more times.
- Quantify the purified protein by measuring the absorbance of the fraction at 280 nm. Blank the spectrophotometer with storage buffer (2x storage buffer at 4 °C). Gently mix the sample of the combined eluates and measure its absorbance.
NOTE: Perform three separate readings at 1x, 10x, and 50x dilutions of the protein sample to average and quantify the protein. Dilute samples in storage buffer. - Adjust the protein samples to 100 µM using 2x storage buffer. Dilute the adjusted sample 1:1 by volume with 100% glycerol. Store the resulting protein solution at -80 °C.
5. Sodium dodecyl sulfate-polyacrylamide gel electrophoresis (SDS-PAGE) analysis of protein product: Day 3
- Run an SDS-PAGE gel for protein analysis. Mix 9 µL of the sample with 3 µL of 4x lithium dodecyl sulfate (LDS) protein loading dye. Heat the samples at 95 °C for 10 min.
- Load the samples onto a 4-12% Bis-Tris SDS-PAGE gel setup. Load the protein ladder in well 1, then with samples (from left to right): flow-through, wash 1, wash 2, wash 3, elution 1, elution 2, elution 3, and total desalted elution.
NOTE: Table 5 contains a sample loading table for the SDS-PAGE gel. - Run the loaded gel samples in 2-(N-morpholino) ethanesulfonic acid (MES) buffer for 35 min at 200 V. Rinse the gel in a clean tray three times for 10 min each using 200 mL of ddH2O, with gentle agitation to remove any SDS from the gel matrix.
NOTE: Wear personal protective equipment to avoid acute toxicity due to the MES. - Stain the gel with 20 mL of Coomassie blue, and incubate the gel overnight at room temperature with gentle agitation. De-stain the gel twice for 1 h each with 200 mL of ddH2O with gentle agitation on an orbital shaker.
NOTE: Washing the gel for a longer period or frequently replacing the water will enhance sensitivity. Additionally, placing a folded delicate-task wipe tissue in the container to absorb excess dye will accelerate the de-staining process.
6. Functional verification of SNAP T7 RNAP via in vitro transcription
NOTE: This protocol uses DNA template, which encodes for the fluorescent Broccoli RNA aptamer and allows the use of fluorescence to monitor the kinetics of transcription on a fluorescence plate reader.
- Set up three in vitro transcription (IVT) reactions to compare the activity of SNAP T7 RNAP with wild-type (WT) T7 RNAP from a commercial source and a buffer-only control. Adjust the volume of each reaction to 20 µL.
- Prepare the SNAP T7 RNAP IVT reaction by mixing 2 µL of 10x transcription buffer, 0.4 µL of 25 mM ribonucleoside triphosphate (rNTP) mix, 5 µL of 500 nM DNA template, 2 µL of 500 nM SNAP T7 RNAP, and 10.6 µL of ddH2O.
- Prepare the WT RNAP IVT reaction by mixing 2 µL of 10x transcription buffer, 0.4 µL of 25 mM rNTP mix, 5 µL of 500 nM DNA template, 2 µL of WT T7 RNAP, and 10.6 µL of ddH2O.
- Prepare the buffer-only IVT reaction by mixing 2 µL of 10x transcription buffer, 0.4 µL of 25 mM rNTP mix, 5 µL of 500 nM DNA template, and 12.6 µL of ddH2O.
NOTE: Add the RNAP last, keeping the samples on ice until its introduction. Table 6, Table 7, and Table 8 contain the IVT reaction formulas.
- Monitor the transcription kinetics on a fluorescence plate reader for 2 h at 2 min intervals at 37 °C using an excitation wavelength of 470 nm and an emission wavelength of 512 nm.
7. Preparation of BG-modified oligonucleotides: Day 1
- Dissolve the oligonucleotide with 3'-amine modification in ddH2O to a final concentration of 1 mM. Label this S1.
- Mix 25 µL of 1 M sodium bicarbonate (NaHCO3), 284 µL of 100% dimethyl sulfoxide (DMSO), 125 µL of S1 (oligonucleotide stock), and 66 µL of 50 mM of the BG-N-hydroxysuccinimide (NHS) ester (BG-GLA-NHS) diluted with DMSO, adjust the volume to 500 µL, and incubate overnight at room temperature at 100 × g.
NOTE: Keep DMSO away from heat and flame as it is a combustible liquid. Table 9 contains the reaction formula for the BG conjugation to the oligonucleotide.
- Mix 25 µL of 1 M sodium bicarbonate (NaHCO3), 284 µL of 100% dimethyl sulfoxide (DMSO), 125 µL of S1 (oligonucleotide stock), and 66 µL of 50 mM of the BG-N-hydroxysuccinimide (NHS) ester (BG-GLA-NHS) diluted with DMSO, adjust the volume to 500 µL, and incubate overnight at room temperature at 100 × g.
8. Ethanol/acetone precipitation of BG-oligonucleotide conjugate: Day 2
- Centrifuge the product of step 7.1.1. at 13,000 × g for 5 min. Carefully transfer the supernatant to a fresh tube and discard any precipitated BG. Split the reaction into two equal 250 µL aliquots to prevent overflow, and perform the following steps on both aliquots.
- Add 1/10th of the volume of 3 M sodium acetate (25 µL), followed by 2.5x the volume in 100% ethanol (625 µL). Incubate at -80 °C for 1 h.
NOTE: Use personal protective equipment when handling both sodium acetate (may cause irritation to eyes, skin, digestive and respiratory tract) and ethanol (extremely flammable, causes irritation on contact). If necessary, pause the experiment here and continue the next day. - Place the tubes in the centrifuge, and mark the outer edge. Centrifuge the tubes at 17,000 × g for 30 min at 4 °C.
NOTE: The oligonucleotide pellet will appear on the marked edge of the tube. - Without disturbing the pellet, discard the supernatant. Top up with 750 µL of chilled 70% ethanol, and spin at 17,000 × g for 10 min at 4 °C.
- Without disturbing the pellet, discard the supernatant. Top up with 750 µL of 100% acetone, and spin at 17,000 × g for 10 min at 4 °C.
NOTE: Use personal protective equipment when handling acetone as it is extremely flammable and causes irritation on contact. - With the tube lid open, air dry for 5 min to remove any excess acetone through evaporation. Re-dissolve the oligonucleotide in 250 µL of 1x Tris-EDTA (TE) buffer to produce a ~850 µM BG-oligonucleotide solution.
- Repeat steps 8.2 to 8.6, and re-dissolve in 70 µL of 1x TE buffer. Label this S2.
9. BG-oligonucleotide cleanup via gel filtration chromatography
- Suspend the matrix by vigorously inverting the columns several times; remove the top cap and snap off the bottom tip of column. Place the column in a 1.5 mL centrifuge tube, and centrifuge the tube at 1,000 × g for 1 min at room temperature. Discard the eluted buffer and collection tube.
NOTE: It is important to prevent vacuum formation. Use prepared columns immediately. - Place the packed columns in clean 1.5 mL centrifuge tubes. Add 300 µL of 1x TE buffer to the center of the column bed, and centrifuge at 1,000 × g for 2 min to exchange the buffer solution. Once again, discard the eluted buffer and collection tube.
- Place the buffer-exchanged columns in clean 1.5 mL centrifuge tubes. Apply up to 75 µL of sample to the center of the bed. Spin at 1,000 × g for 4 min.
NOTE: Do not disturb the bed or touch the sides of the column; the highest point of the gel media should point toward the outside rotor. - Collect the eluate from the collection tube, as it contains the purified nucleic acid. To quantify the sample, measure its absorbance at 260 nm; label this S3.
NOTE: Note the path length used in the measurement, and calculate the concentration using the Beer-Lambert law.
10. Denaturing PAGE analysis of BG-oligonucleotide conjugate
- Cast a 18% Tris-borate-EDTA (TBE)-Urea PAGE gel. Dissolve 4.8 g of UREA, 4.5 mL of 40% acrylamide (19:1), and 1 mL of 10x TBE in 2.8 mL of ddH2O; add 5 µL tetramethylethylenediamine (TEMED) and mix thoroughly. Repeat with 100 µL of 10% ammonium persulfate (APS). Pour the solution into an empty gel cassette and allow polymerization for 40 min.
NOTE: Use appropriate personal protective equipment when handling urea (causes irritation to eyes and skin), acrylamide (toxic and carcinogenic), and TEMED (toxic, flammable, corrosive). Table 10 contains the reaction formula for an 18% TBE-UREA polyacrylamide gel. - Microwave 500 mL of TBE buffer (0.5x) for 2 min and 30 s or until ~70 °C and pour into a gel apparatus. Prepare formamide (denaturing) loading dye containing 95% formamide + 1 mM EDTA and bromophenol blue. Mix the loading dye with each sample, and load the mixture onto the polyacrylamide gel.
NOTE: Use appropriate personal protective equipment when handling formamide as it is carcinogenic. Table 11 contains a sample gel loading table. - Run the gel at 270 V for 35 min, or until the dye front migrates to the end. Place the gel in a gel box and stain with cyanine dye for nucleic acids for 15 min at room temperature before imaging.
NOTE: Use appropriate personal protective equipment when handling cyanine dye as it is combustible.
11. Conjugation of oligonucleotide to SNAP T7 RNAP and PAGE analysis
- Prepare the reagents for the analytical-scale coupling of BG-oligonucleotide to SNAP T7 RNAP: make 9 dilutions of single-stranded DNA (ssDNA) oligo with ddH2O to create oligo:RNAP ratios ranging from 5:1 to 1:5. Dilute the protein stock to 50 µM.
NOTE: Example ratios can be found in Table 12; these ratios are calculated using a RNAP concentration of 50 µM. - For each dilution of ssDNA oligo, make 10 µL of the reaction mixture containing 2 µL of SNAP buffer, 4 µL of BG-oligonucleotide, and 4 µL of SNAP T7 RNAP.
NOTE: Table 13 contains reaction formulas for the SNAP-tag labeling reaction.- Prepare two more control samples: 1) an RNAP control by replacing BG-oligonucleotide with ddH2O; 2) a DNA control by replacing SNAP T7 RNAP with ddH2O (for the lowest oligonucleotide concentration of SNAP T7 RNAP). Incubate all samples at room temperature for 1 h, and keep on ice until needed.
- Set up eleven 10 µL reactions by adding 2 µL of each sample to 4 µL of SNAP buffer and 2 µL of protein loading dye, and heat at 70 °C for 10 min. Load 2 µL of each sample onto the 4-12% Bis-Tris protein gel, and perform gel electrophoresis on ice at 200 V for 35 min.
NOTE: Table 14 contains reaction formulas for the gel loading samples.- Wash SDS off via 3x water-exchange on a shaker, each wash lasting 10 min each. Stain with cyanine dye for nucleic acids for 15 min before imaging. Stain the gel again using 20 mL of Coomassie blue stain for 1 h. De-stain with ddH2O for 1 h (or overnight) before imaging.
NOTE: In the gel, one of the reactions will produce the most tethered polymerase along with the least amount of excess free BG-oligonucleotide; this is the optimal ratio.
- Wash SDS off via 3x water-exchange on a shaker, each wash lasting 10 min each. Stain with cyanine dye for nucleic acids for 15 min before imaging. Stain the gel again using 20 mL of Coomassie blue stain for 1 h. De-stain with ddH2O for 1 h (or overnight) before imaging.
- Prepare reagents for the preparative scale coupling BG-oligonucleotide to SNAP T7 RNAP. Perform the coupling reaction with the optimal ratio found in the analytical scale.
NOTE: Minimize protein exposure to room temperature by placing the protein on ice when not in use.
12. Purification of oligonucleotide-tethered SNAP-T7 using ion exchange columns
- Follow the manufacturer's instructions for tube setup if it deviates from the instructions listed here. Prepare a purification buffer with pH higher than the isoelectric point of the protein.
NOTE: For the example protein in this protocol, a purification buffer of 10 mM sodium phosphate buffer (pH 7) was used.- Prepare 1,000 µL of elution buffer containing final concentrations of 50 mM Tris and 0.5 M NaCl. Mix 50 µL of 1 M Tris, 100 µL of 5 M NaCl, and 850 µL of ddH2O.
NOTE: Table 15 contains the reaction formula for the elution buffer.
- Prepare 1,000 µL of elution buffer containing final concentrations of 50 mM Tris and 0.5 M NaCl. Mix 50 µL of 1 M Tris, 100 µL of 5 M NaCl, and 850 µL of ddH2O.
- Place a column in a 2 mL centrifuge tube, and wash with purification buffer at 2,000 × g for 15 min, or until all the buffer has been eluted. Discard the eluted buffer.
- Dilute each sample with purification buffer at a 3:1 purification buffer:sample ratio, and load the sample into the column 400 µL at a time. Spin at 2,000 × g for 10 min, or until all the buffer has been eluted. Collect the flow-through and label it as flow-through.
- Add 400 µL of purification buffer into the center of the column. Spin at 2,000 × g for 15 min, or until all the buffer has been eluted. Collect the flow-through and label it as wash 1. Repeat twice more for wash 2 and wash 3.
- Add 50 µL of elution buffer into the center of the column. Spin at 2,000 × g for 5 min, or until all the buffer has been eluted. Collect the flow-through and label it as eluate 1. Repeat twice more for eluate 2 and eluate 3.
- Pool eluates 1, 2, and 3 (label this total eluate), leaving a small fraction of each eluate for the gel, and measure absorbance at 260 nm (A260) and 280 nm (A280). After the measurement, add glycerol at a 1:1 ratio and store at -20 °C until further use.
- Use a centrifugal filter unit (0.5 mL; 30 kDa) to buffer-exchange total eluate with 2x storage buffer (~1:100) (label this product). Measure A260/280 again. Add glycerol at a 1:1 ratio and store at -20 °C until further use.
- Load each eluate: flow-through, wash 1-3, total eluate, and product in a 4-12% Bis-Tris SDS-PAGE gel, along with a protein ladder. Run at 200 V for 35 min, or until the dye front migrates to the end.
13. Demonstration of on-demand control of tethered RNA polymerase activity
- Prepare 5x annealing buffer containing 25 mM Tris, 5 mM EDTA, and 25 mM magnesium chloride (MgCl2). Mix 2.4 µL of each template (1 µM) with 5 µL of annealing buffer and 14.2 µL of ddH2O to form 25 µL of 1 µM dsDNA cage. Incubate this solution at 75 °C for 2 min. Similarly, anneal the sense and antisense strands of the promoter and malachite green aptamer DNA template. Prepare a 1mM solution of malachite green oxalate.
NOTE: Table 16 contains the reaction formula for 5x annealing buffer, Table 17 contains the reaction formula for annealing two ssDNA templates. - Incubate the tethered SNAP T7 RNAP with the dsDNA cage in a 1:5 molar ratio at room temperature for 15 min to a final concentration of 500 nM RNAP. Keep on ice until needed.
- Preheat the plate reader to 37 °C. Set up three 25 µL IVT reactions on ice
- Set up a reaction containing the caged SNAP T7RNAP with nucleic acid transcription factors. Mix 2.5 µL of 10x IVT buffer, 1 µL of 25 mM rNTP mix, 1 µL of 1 mM malachite green, 2.5 µL of the RNAP-cage mixture, 2.5 µL each of 1 µM transcription factor A and B oligonucleotide strands, and 3 µL of 1 mM malachite green aptamer template in 10 µL of ddH2O.
- Set up a reaction containing the caged SNAP T7RNAP without nucleic acid transcription factors. Mix 2.5 µL of 10x IVT buffer, 1 µL of 25 mM rNTP mix, 1 µL of 1 mM malachite green, 2.5 µL of the RNAP-cage mixture, and 3 µL of 1 mM malachite green aptamer template in 15 µL of ddH2O.
- Set up a reaction containing buffer only. Mix 2.5 µL of 10x IVT buffer, 1 µL of 25 mM rNTP mix, 1 µL of 1 mM malachite green, and 3 µL of 1 mM malachite green aptamer template in 17.5 µL of ddH2O.
NOTE: Table 18 contains a general reference for the in vitro transcription reactions.
- Transfer each reaction to a 384-well plate. Monitor transcription of the malachite green aptamer on a fluorescence plate reader for 2 h at 37 °C and with 610 nm excitation and 655 nm emission. Once finished, keep the plate on ice until needed.
- Microwave 0.5x TBE buffer for 2 min 30 s or until ~70 °C. Run the RNA products of each well in a denaturing 12% TBE-Urea polyacrylamide gel in the heated 0.5x TBE buffer at 280 V for 20 min, or until the dye front reaches the end. Stain the gel with cyanine dye nucleic acid stain for 10 min on an orbital shaker before imaging.
NOTE: Table 19 contains the reaction formula for a denaturing 12% TBE-Urea PAGE gel.
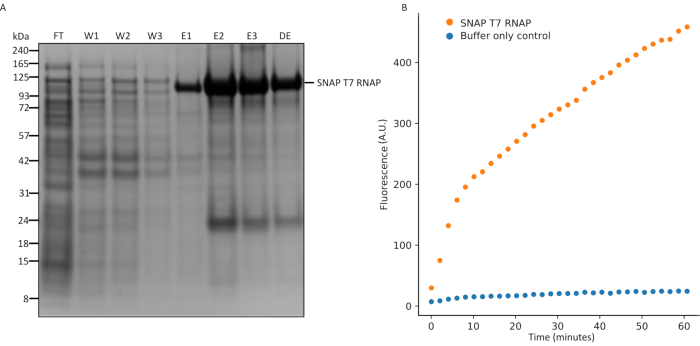
Figure 5: SDS-PAGE analysis of SNAP T7 RNAP expression and in vitro transcription assay. (A) SNAP T7 RNAP protein purification analysis, SNAP T7 RNAP molecular weight: 119.4kDa. FT = flow-through from the column, W1 = elution fractions of wash buffer containing impurities, E1-3 = elution fractions containing purified product, and DE = 10x diluted total desalted elution. 4-12% precast Bis-Tris protein gel, stain: Coomassie blue, running buffer: MES buffer, conditions: 200 V for 35 min. (B) An in vitro transcription assay was performed on the SNAP T7 RNAP protein by measuring production of a fluorescent aptamer over time. Transcription kinetics were monitored on a fluorescence plate reader for 2 h at 2 min intervals at 37 °C using excitation wavelength at 470 nm and emission wavelength at 512 nm. Abbreviations: RNAP = RNA polymerase; MES = 2-(N-morpholino) ethanesulfonic acid; SDS-PAGE = sodium dodecyl sulfate polyacrylamide gel electrophoresis. Please click here to view a larger version of this figure.
Successful expression and purification of the recombinant SNAP T7 RNAP protein was confirmed using SDS-PAGE (Figure 5A). The band for SNAP T7 RNAP is expected at approximately 119 kDa, consistent with the molecular weights of the wild-type T7 RNAP and the SNAP-tag being 99 kDa and 20 kDa, respectively. The His-tag purification procedure described here produced a total of seven fractions, consisting of a flow-through fraction (FT), three wash fractions (W1, W2, and W3), and three elution fractions (E1, E2, and E3). In addition, an aliquot of the protein following buffer exchange and up-concentration (DE) is also typically included. As seen in Figure 5A, the most prominent band appeared at approximately 119 kDa in the elution fractions, suggesting successful protein expression. The majority of the flow-through and wash fractions contained crude cell lysates. A minor portion of the cell lysates carried over to the elution fractions, suggesting that more stringent washes needed to be performed, although this may reduce yield of the protein product. In addition to the main SNAP T7 RNAP band, a second, less prominent band was observed at approximately 20 kDa, which was attributed to truncated SNAP-tag protein. Based on band intensity, this by-product was significantly lower in concentration compared to the SNAP T7 RNAP. It can be removed by an additional round of size-exclusion chromatography or diafiltration with 100 kDa molecular weight cut-off filters. Following SDS-PAGE, the enzymatic activity was validated using an in vitro transcription reaction (Figure 5B). A T7 DNA template encoding a fluorescent RNA aptamer (e.g., malachite green26) was used, which allows monitoring of RNA production kinetics using a fluorescence plate reader, as well as comparison of transcription kinetics between different batches or designs of polymerases.
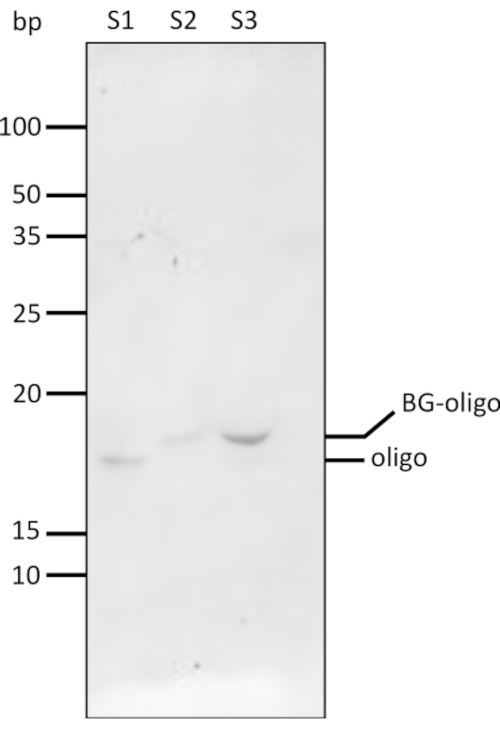
Figure 6: PAGE analysis of BG-oligonucleotide conjugation and purification. BG was conjugated on the 3'-end of the oligonucleotide through standard amine chemistry. BG-functionalized oligonucleotide conjugates were purified from excess by-products using a size exclusion chromatography spin column and analyzed on a denaturing 18% TBE-Urea PAGE following cyanine dye nucleic acid stain. An ultra-low range DNA ladder was used in this gel. S1 = oligonucleotide, S2 = pre-purification BG-oligo, S3 = post-purification BG-oligo. Abbreviations: PAGE = polyacrylamide gel electrophoresis; BG = benzylguanine; TBE = Tris-borate-EDTA; EDTA = ethylenediamine tetraacetic acid. Please click here to view a larger version of this figure.
BG-functionalized oligonucleotides were prepared using standard amine-reactive crosslinking chemistry (i.e., reacting BG-GLA-NHS esters with amine-modified oligonucleotides). Successful coupling was verified via 18% denaturing TBE-Urea PAGE (Figure 6). Compared to the unmodified oligonucleotide (S1), the addition of the BG moiety to the oligonucleotide increases its molecular weight and causes the BG-modified oligo (S3) to travel slower in the gel. The use of a high-percentage denaturing gel is necessary to observe this single-nucleotide difference. Denaturing PAGE analysis is also useful to characterize batch-to-batch variability in conjugation efficiency, as both conjugated and unconjugated oligonucleotide can be resolved as separate bands on the gel. If the product contains a significant amount of unconjugated oligonucleotide, a second round of chemical coupling may be applied to drive the reaction to completion.
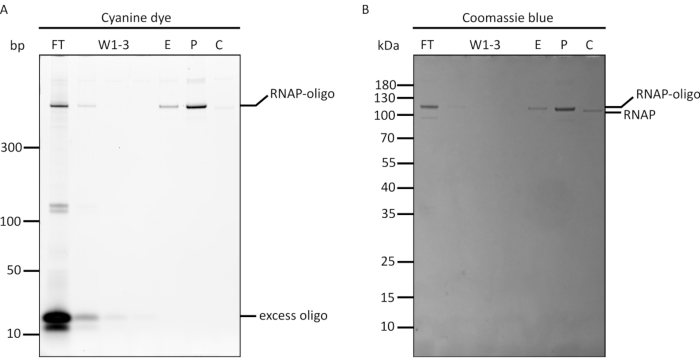
Figure 7: SDS-PAGE analysis of T7 RNAP-oligonucleotide conjugation and purification. A BG-modified oligonucleotide is conjugated to a T7 RNAP via SNAP-tag. The conjugates were purified from excess oligonucleotides using strong cation exchange spin columns, before being analyzed by SDS-PAGE stained with both (A) cyanine dye nucleic acid stain and (B) Coomassie blue stain. Both a protein ladder and a 10-bp DNA ladder were used in this gel. FT = flow-through from the column, W1-W3 = elution fractions of purification buffer containing impurities, E = pooled elution fractions containing purified product, P = purified product after filtration buffer exchange and up-concentration, C = SNAP T7 RNAP only as control. This figure has been modified from Chou and Shih27. Abbreviations: RNAP = RNA polymerase; SDS-PAGE = sodium dodecyl sulfate polyacrylamide gel electrophoresis. Please click here to view a larger version of this figure.
Following the production of the SNAP T7 RNAP and BG-modified oligonucleotide, the synthesis of the DNA-tethered RNAP was a simple one-pot mixing reaction. The resulting DNA-tethered T7 RNAP was purified from excess BG-oligonucleotides using a strong cation exchange spin column and analyzed by denaturing SDS-PAGE (Figure 7). As with the His-tag purification scheme described in a previous paragraph, a total of seven fractions were analyzed, including the initial flow-through (FT), three wash fractions (W1 to W3), the pooled elution fractions (E), the up-concentrated product (P), and a control containing unconjugated T7 RNAP (C). To verify successful conjugation, the gel was first stained with cyanine dye for nucleic acid, followed by Coomassie blue for the protein. As can be observed in the cyanine dye-stained gel (Figure 7A), the initial FT contained mostly excess BG-oligonucleotide, as well as a small portion of the DNA-tethered polymerase (i.e., RNAP-oligo) that did not bind to the cation exchange resin.
The wash fractions contained a series of fainter bands of the BG-oligonucleotides (W1-W3) at the bottom of the gel. This suggests successful removal of excess oligonucleotide. The pooled elution fractions (E) contained only the single band of RNAP-oligo caused by the binding of the cyanine dye to the oligonucleotide tether. If lane E contains bands of free oligonucleotide, more wash steps may be required to remove them from the sample. The lane containing the filtered and up-concentrated product (P) showed the same band as E, but much darker, signifying that the up-concentration procedure was successful. The protein control column contained only protein, which exhibited minimal non-specific binding to cyanine dye, seen as a faint band. The same patterns were observed in the Coomassie blue-stained gel (Figure 7B). A small gel mobility shift was observed when comparing the oligonucleotide-conjugated RNAP to the non-conjugated RNAP control.
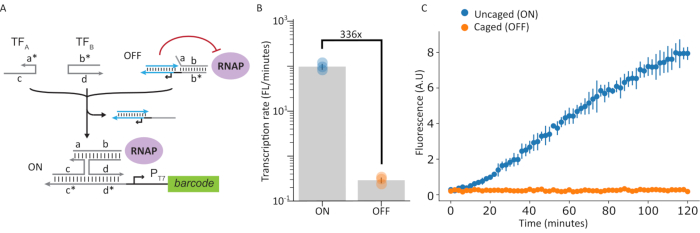
Figure 8: In vitro transcription assay of ON and OFF states of caged polymerase system. (A) Schematic depicting T7 RNAP in caged and uncaged states. (B and C) An in vitro transcription assay was performed on caged and uncaged states of the polymerase by measuring production of a fluorescent aptamer. Shown in this figure is a 336x increase in transcription rate between the ON and OFF states. Error bars indicate standard deviation (n=3). This figure has been modified from Chou and Shih27. Abbreviations: RNAP = RNA polymerase; TF = transcription factor. Please click here to view a larger version of this figure.
To demonstrate a method for on-demand switching of transcriptional ability in the tethered RNA polymerase system, a DNA template design that responded to a pair of nucleic-acid input strands TFA and TFB was used (Figure 8A). Transcriptional activity was monitored by measuring production of the malachite green fluorescent aptamer in both OFF (i.e., caged) and ON (i.e., uncaged) states. The amount of fluorescence signal produced at the end of the in vitro transcription is shown in Figure 8B, and the real-time kinetics are shown in Figure 8C. Here, a 336-fold activation in fluorescence signal can be observed, demonstrating robust control of polymerase activity.
| Reagent | Initial concentration | Units | Volume | Units | Final concentration | Units |
| Tris | 1 | M | 1.5 | mL | 50 | mM |
| NaCl | 5 | M | 1.8 | mL | 300 | mM |
| Glycerol | 100 | % | 1.5 | mL | 5 | % |
| BME | 14.2 | M | 10.5 | µL | 5 | mM |
| ddH2O | — | — | 25.2 | mL | — | — |
| Final volume | — | — | 30 | mL | — | — |
Table 1: Lysis/equilibration buffer formula.
| Reagent | Initial concentration | Units | Volume | Units | Final concentration | Units |
| Tris | 1 | M | 1.5 | mL | 50 | mM |
| NaCl | 5 | M | 4.8 | mL | 800 | mM |
| Glycerol | 100 | % | 1.5 | mL | 5 | % |
| BME | 14.2 | M | 7.0 | µL | 5 | mM |
| Imidazole | 2 | M | 200 | µL | 20 | mM |
| ddH2O | — | — | 22.2 | mL | — | — |
| Final volume | — | — | 30 | mL | — | — |
Table 2: Wash buffer formula.
| Reagent | Initial concentration | Units | Volume | Units | Final concentration | Units |
| Tris | 1 | M | 0.5 | mL | 50 | mM |
| NaCl | 5 | M | 1.6 | mL | 800 | mM |
| Glycerol | 100 | % | 0.5 | mL | 5 | % |
| BME | 14.2 | M | 3.5 | µL | 5 | mM |
| Imidazole | 2 | M | 1 | mL | 200 | mM |
| ddH2O | — | — | 6.4 | mL | — | — |
| Final volume | — | — | 10 | mL | — | — |
Table 3: Elution buffer formula.
| Reagent | Initial concentration | Units | Volume | Units | Final concentration | Units |
| Tris | 1 | M | 5 | mL | 100 | mM |
| NaCl | 5 | M | 2 | mL | 200 | mM |
| BME | 14.2 | M | 140.8 | µL | 40 | mM |
| Triton X-100 | 100 | % | 100 | µL | 0.2 | % |
| EDTA | 0.5 | M | 200 | µL | 2 | mM |
| ddH2O | — | — | 42.56 | mL | — | — |
| Final volume | — | — | 50 | mL | — | — |
Table 4: Storage buffer formula.
| Sample | Description | µL of sample | µL of loading dye |
| 1 | Protein Ladder | 9 | — |
| 2 | FT: Flow-through | 9 | 3 |
| 3 | W1: Wash 1 | 9 | 3 |
| 4 | W2: Wash 2 | 9 | 3 |
| 5 | W3: Wash 3 | 9 | 3 |
| 6 | E1: Elution 1 | 9 | 3 |
| 7 | E2: Elution 2 | 9 | 3 |
| 8 | E3: Elution 3 | 9 | 3 |
| 9 | DE: Desalted elution | 9 | 3 |
Table 5: SDS-PAGE sample loading for lanes from left to right.
| Reagent | Initial concentration | Units | Final concentration | Units | Final volume | Units |
| Transcription buffer | 10 | X | 1 | X | 2 | µL |
| rNTP mix | 25 | mM | 0.5 | mM | 0.4 | µL |
| DNA template | 500 | nM | 125 | nM | 5 | µL |
| SNAP T7 RNAP | 500 | nM | 50 | nM | 2 | µL |
| Nuclease-free water | — | — | — | — | 10.6 | µL |
| Total volume | 20 | µL |
Table 6: In vitro transcription reaction formula with SNAP T7 RNAP (master mix).
| Reagent | Initial concentration | Units | Final concentration | Units | Final volume | Units |
| Transcription buffer | 10 | X | 1 | X | 2 | µL |
| rNTP mix | 25 | mM | 0.5 | mM | 0.4 | µL |
| DNA template | 500 | nM | 125 | nM | 5 | µL |
| WT T7 RNAP | 500 | nM | 50 | nM | 2 | µL |
| Nuclease-free water | — | — | — | — | 10.6 | µL |
| Total volume | 20 | µL |
Table 7: In vitro transcription reaction formula with wild-type (WT) T7 RNAP (master mix).
| Reagent | Initial concentration | Units | Final concentration | Units | Final volume | Units |
| Transcription buffer | 10 | X | 1 | X | 2 | µL |
| rNTP mix | 25 | mM | 0.5 | mM | 0.4 | µL |
| DNA template | 500 | nM | 125 | nM | 5 | µL |
| Nuclease-free water | — | — | — | — | 12.6 | µL |
| Total volume | 20 | µL |
Table 8: In vitro transcription reaction formula without polymerase; buffer-only control.
| Reagent | Initial concentration | Units | Volume | Units | Final | Units | Final | Units | Final volume | Units |
| NaHCO3 | 1 | M | 25 | µL | 0.05 | mM | 1.25E-05 | mol | 500 | µL |
| DMSO | 100 | % | 284 | µL | 56.8 | % | — | — | 500 | µL |
| Oligo | 1 | mM | 125 | µL | 0.25 | µM | 6.25E-08 | mol | 500 | µL |
| BG-GLA-NHS in DMSO | 50 | mM | 66 | µL | 6.6 | mM | 1.65E-06 | mol | 500 | µL |
Table 9: Reaction formula for benzylguanine conjugation to the oligonucleotide.
| Gel volume | 10 mL |
| Acrylamide concentration | 18% |
| g UREA | 4.8 |
| mL of 40% acrylamide (19:1) | 4.5 |
| mL of 10x TBE | 1 |
| mL of ddH2O | 2.8 |
| µL of TEMED | 5 |
| µL of 10% APS | 100 |
Table 10: Reaction formula for a 18% TBE-UREA denaturing PAGE.
| Sample | Description | µl sample | µl loading dye |
| 1 | L: Ultra-Low Range Ladder | 3 | — |
| 2 | S1: 100 nM oligo | 3 | 3 |
| 3 | S2: 100 nM oligo-BG | 3 | 3 |
| 4 | S3: 100 nM oligo-BG + Centri-Spin | 3 | 3 |
Table 11: Denaturing PAGE sample loading for lanes from left to right.
| Sample | Concentration (M) | oligo:RNAP |
| 1 | 2.50E-04 | 5:1 |
| 2 | 2.00E-04 | 4:1 |
| 3 | 1.50E-04 | 3:1 |
| 4 | 1.00E-04 | 2:1 |
| 5 | 5.00E-05 | 1:1 |
| 6 | 2.50E-05 | 1:2 |
| 7 | 1.68E-05 | 1:3 |
| 8 | 1.25E-05 | 1:4 |
| 9 | 1.00E-06 | 1:5 |
Table 12: Reagent ratios for analytical scale coupling of BG-oligonucleotide to SNAP T7 RNAP.
| Reagent | Volume | Unit |
| SNAP buffer | 2 | µL |
| BG-Oligo | 4 | µL |
| SNAP-T7 RNAP | 4 | µL |
| Total volume | 10 | µL |
Table 13: Reaction formula for the SNAP-tag labelling reaction.
| Lane | Sample Description | Sample volume (µL) | SNAP buffer volume (µL) | Loading dye volume (µL) |
| 1 | Sample 1 | 2 | 4 | 2 |
| 2 | Sample 2 | 2 | 4 | 2 |
| 3 | Sample 3 | 2 | 4 | 2 |
| 4 | Sample 4 | 2 | 4 | 2 |
| 5 | Sample 5 | 2 | 4 | 2 |
| 6 | Sample 6 | 2 | 4 | 2 |
| 7 | Sample 7 | 2 | 4 | 2 |
| 8 | Sample 8 | 2 | 4 | 2 |
| 9 | Sample 9 | 2 | 4 | 2 |
| 10 | RNAP control | 2 | 4 | 2 |
| 11 | Oligo control | 2 | 4 | 2 |
| 12 | Ladder | 4 | – |
Table 14: Bis-Tris PAGE (4%-12%) reaction formulas for gel lane loading samples.
| Reagent | Initial concentration | Units | Volume | Units | Final concentration | Units | Final volume | Units |
| Tris | 1 | M | 50 | µL | 50 | mM | 1000 | µL |
| NaCl | 5 | M | 100 | µL | 0.5 | M | 1000 | µL |
| ddH2O | — | — | 850 | µL | — | — | 1000 | µL |
Table 15: Reaction formula for elution buffer (11.1).
| Reagent | Initial concentration | Units | Final concentration | Units | volume to pipette | Units |
| Tris | 1000 | mM | 25 | mM | 25 | µL |
| EDTA | 500 | mM | 5 | mM | 10 | µL |
| MgCl | 1000 | mM | 25 | mM | 25 | µL |
| ddH2O | — | — | — | — | 940 | µL |
Table 16: Reaction formula for 5x annealing buffer.
| Reagent | Initial concentration | Units | Final concentration | Units | Volume to pipette | Units | Total Reaction Volume | Units |
| annealing buffer | 5 | X | 1 | X | 5 | µL | 24 | µL |
| sense | 10 | µM | 1 | µM | 2.4 | µL | 24 | µL |
| antisense | 10 | µM | 1 | µM | 2.4 | µL | 24 | µL |
| ddH2O | — | — | — | — | 14.2 | µL | 24 | µL |
Table 17: Reaction formula used to anneal two ssDNA templates (sense and antisense strands).
| Reagent | Initial concentration | Units | Final concentration | Units | Volume to pipette | Units | Total reaction volume | Units |
| In vitro transcription (IVT) buffer | 10 | X | 1 | X | 2.5 | µL | 25 | µL |
| rNTP mix | 25 | mM | 1 | mM | 1 | µL | 25 | µL |
| Malachite Green | 1 | mM | 40 | µM | 1 | µL | 25 | µL |
| RNAP | 500 | nM | 50 | nM | 2.5 | µL | 25 | µL |
| DNA template | 1000 | nM | 120 | nM | 3 | µL | 25 | µL |
| ddH2O | — | — | — | — | 14 | µL | 25 | µL |
Table 18: In vitro transcription reaction formula (master mix); includes RNAP concentration.
| Gel Volume | 10 mL |
| Acrylamide concentration | 12% |
| g UREA | 4.8 |
| ml 40% acrylamide (29:1) | 3 |
| ml 10x TBE | 1 |
| ml ddH2O | 4.3 |
| µl TEMED | 5 |
| µl 10% APS | 100 |
Table 19: Reaction formula for a 12% TBE-UREA denaturing PAGE.
