The method presented here summarizes optimized protocols for assessing cellular bioenergetics in non-adherent mouse hematopoietic stem and primitive progenitor cells (HSPCs) using the extracellular flux analyzer to measure the extracellular acidification rate (ECAR) and oxygen consumption rate (OCR) of HSPCs in real time.
Under steady state, hematopoietic stem cells (HSCs) remain largely quiescent and are believed to be predominantly reliant on glycolysis to meet their energetic needs. However, under stress conditions such as infection or blood loss, HSCs become proliferative and rapidly produce downstream progenitor cells, which in turn further differentiate, ultimately producing mature blood cells. During this transition and differentiation process, HSCs exit from quiescence and rapidly undergo a metabolic switch from glycolysis to oxidative phosphorylation (OxPHOS). Various stress conditions, such as aging, cancer, diabetes, and obesity, can negatively impact mitochondrial function and thus can alter the metabolic reprogramming and differentiation of HSCs and progenitors during hematopoiesis. Valuable insights into glycolytic and mitochondrial functions of HSCs and progenitors under normal and stress conditions can be gained through the assessment of their extracellular acidification rate (ECAR) and oxygen consumption rate (OCR), which are indicators of cellular glycolysis and mitochondrial respiration, respectively.
Here, a detailed protocol is provided to measure ECAR and OCR in mouse bone marrow-derived lineage-negative cell populations, which include both hematopoietic stem and primitive progenitor cells (HSPCs), using the extracellular flux analyzer. This protocol describes approaches to isolate lineage-negative cells from mouse bone marrow, explains optimization of cell seeding density and concentrations of 2-deoxy-D-glucose (2-DG, a glucose analog that inhibits glycolysis) and various OxPHOS-targeted drugs (oligomycin, FCCP, rotenone, and antimycin A) used in these assays, and describes drug treatment strategies. Key parameters of glycolytic flux, such as glycolysis, glycolytic capacity, and glycolytic reserve, and OxPHOS parameters, such as basal respiration, maximal respiration, proton leak, ATP production, spare respiratory capacity, and coupling efficiency, can be measured in these assays. This protocol allows ECAR and OCR measurements on non-adherent HSPCs and can be generalized to optimize analysis conditions for any type of suspension cells.
Hematopoiesis is the process by which various types of mature blood cells with highly specialized functions are formed from HSCs1. HSCs are capable of self-renewal and differentiation into various multipotent and lineage-specific progenitor populations. These progenitors ultimately produce cells of lymphoid, myeloid, erythroid, and megakaryocyte lineages. To maintain their self-renewal capacity, HSCs remain largely quiescent and, like other tissue stem cells, are believed to rely on glycolysis rather than mitochondrial OxPHOS for ATP production2,3. Entry into the cell cycle leads to enhanced respiration and OxPHOS, resulting in elevated levels of reactive oxygen species (ROS), which are detrimental to HSC maintenance and function3. Repeated cell division thus may lead to reduced self-renewal capacity of HSCs and ultimately to their exhaustion.
In adult hematopoiesis, HSCs primarily undergo asymmetric cell division, during which one of the daughter cells retains HSC potential and continues to rely on glycolytic metabolism. The other daughter cell becomes a primitive progenitor cell that loses self-renewal capacity but proliferates and eventually gives rise to differentiated functional hematopoietic cells4. When HSCs differentiate to produce downstream progenitors, a switch from glycolysis to mitochondrial metabolism is thought to occur to supply the energy and building blocks needed to support this rapid transition5, as suggested by the observations that HSCs possess inactive mitochondrial mass6,7,8,9. In contrast, mitochondrial activity (indicated by linked ROS levels) is much higher in lineage-committed progenitors than in HSCs9,10,11. Metabolic changes that occur during the earliest step of hematopoiesis thus suggest a direct and crucial role of mitochondria in regulating HSC fate.
Dysfunctional mitochondria present under various stress conditions, such as aging, cancer, diabetes, and obesity12, can interfere with HSC self-renewal capacity, inducing an imbalance in HSC/progenitor differentiation by producing excessive amounts of ROS, impairing ATP production, and/or by altering other metabolic processes9,12,13. Perturbations in metabolic homeostasis in HSC/progenitor differentiation could significantly impact hematopoiesis, potentially contributing to the development of hematologic abnormalities13. Given the critical influences of glycolysis and mitochondrial OxPHOS on HSC stemness and differentiation, it is of interest to investigate both metabolic parameters under normal and stress conditions. Valuable insights into the glycolytic and mitochondrial function of HSCs and progenitor cells can be gained by assessing their ECAR and OCR, which are indicators of cellular glycolysis and mitochondrial respiration, respectively.
The Seahorse extracellular flux analyzer is a powerful apparatus equipped with two probes per well to simultaneously measure ECAR and OCR in live cells and thus can be used to assess cellular bioenergetics in real time, in response to various substrates or inhibitors. The assay cartridge used with the analyzer contains injection ports to hold up to four drugs for automated injection during the assay. A scheme of a typical glycolysis stress test is shown in Figure 1A. The assay starts with the measurement of ECAR of cells, incubated in glycolysis stress test medium containing glutamine but not glucose or pyruvate. This represents acidification occurring due to non-glycolytic activities of the cells and is reported as non-glycolytic acidification. This is followed by the injection of glucose at a saturating concentration. Via glycolysis, glucose in the cell is converted into pyruvate, which is further metabolized in the cytoplasm to produce lactate, or in mitochondria to produce CO2 and water.
Conversion of glucose to lactate causes net production and subsequent release of protons into the extracellular medium, resulting in a rapid increase in the ECAR14,15,16. This glucose-stimulated change in ECAR is reported as glycolysis under basal conditions. The second injection consists of oligomycin (an inhibitor of ATP synthase, a.k.a. complex V17), which inhibits mitochondrial ATP production. During oligomycin-mediated OxPHOS inhibition, cells maximally upregulate glycolysis to meet their energetic demands. This causes a further increase in ECAR, revealing the maximum glycolytic capacity of the cells. The difference between the maximum glycolytic capacity and basal glycolysis is referred to as glycolytic reserve. Finally, 2-DG is injected, which causes a significant drop in ECAR, usually close to non-glycolytic acidification levels. 2-DG is a glucose analog that competitively binds to hexokinase, resulting in inhibition of glycolysis18. Thus, the 2-DG-induced decrease in ECAR further confirms that glycolysis is indeed the source of ECAR observed after glucose and oligomycin injections.
Figure 1B displays the schematic for a typical mitochondrial stress test. The assay starts with baseline OCR measurement of the cells, incubated in mitochondrial stress test medium containing glucose, glutamine, and pyruvate. Following basal OCR measurements, oligomycin is injected in this assay, which inhibits complex V, thereby reducing electron flow through the electron transport chain (ETC)17. Consequently, OCR is reduced in response to oligomycin injection, and this decrease in OCR is linked to mitochondrial ATP production. The second injection consists of carbonyl cyanide-4 (trifluoromethoxy) phenylhydrazone (FCCP), a protonophore and an uncoupler of mitochondrial OxPHOS17. FCCP collapses the mitochondrial proton gradient by allowing the flow of protons across the mitochondrial inner membrane. Because of the FCCP injection, electron flow through the ETC is derepressed, and complex IV consumes oxygen at the maximal level. The difference between maximal OCR and basal OCR is referred to as the spare respiratory capacity, which is a measure of the cell's ability to respond to increased energy demand under stress conditions. Finally, a mixture of two ETC inhibitors (rotenone, a complex I inhibitor, and antimycin A, a complex III inhibitor17) is injected, which completely shuts down electron flow, and OCR decreases to a low level. OCR measured after rotenone and antimycin A injection corresponds to non-mitochondrial OCR driven by other processes inside the cells. Non-mitochondrial OCR enables the calculation of basal respiration, proton leak, and maximal respiration.
Basal respiration represents the difference between baseline OCR and non-mitochondrial OCR. Proton leak refers to the difference between OCR after oligomycin injection and non-mitochondrial OCR. Maximal respiration represents the difference between OCR after FCCP injection and non-mitochondrial OCR. Coupling efficiency is calculated as the percentage of ATP production rate to basal respiration rate. This method paper provides a detailed protocol to measure ECAR and OCR in lineage-negative HSPCs using the Seahorse XFe96 extracellular flux analyzer. This protocol describes approaches to isolate mouse lineage-negative HSPCs, explains the optimization of cell-seeding density and concentrations of various drugs used in extracellular flux assays, and describes drug treatment strategies.
All vertebrate animal experiments were approved by and performed in accordance with the regulations of the University of Michigan Committee on Use and Care of Animals.
1. Day before the assay (Total time: ~10 min)
2. Day of the assay (Total time: ~9 h 30 min)
NOTE: The total time indicated above includes cumulative durations of steps 2.1-2.4 in addition to either step 2.5 or step 2.6.
Using this protocol, the cell number and the concentrations of various OxPHOS-targeting drugs (used in the extracellular flux assays) were optimized to measure ECAR and OCR of HSPCs isolated from 24-week-old female C57BL/6 mice. First, the glycolysis stress test was performed to optimize cell number and oligomycin concentration. A varying number of HSPCs per well ranging from 5 × 10⁴ to 2.5 × 10⁵ were used in this assay. As shown in Figure 2A and Figure 2C, the non-glycolytic acidification rate rises with increased cell number from 5 × 10⁴ to 2.5 × 10⁵ but increases only minimally between 2 × 10⁵ to 2.5 × 10⁵ cells. As expected, injection of 10 mM glucose stimulates glycolysis at all cell numbers, with a maximum increase in ECAR observed at 2.5 × 10⁵ cells per well. However, injection of 2 μM of oligomycin does not further increase ECAR, as otherwise expected. The use of 1 μM oligomycin yielded similar results (not shown). These results could be interpreted to indicate that these oligomycin concentrations were not optimal in these assays.
However, OCR data obtained in the same set of glycolysis stress tests show that both tested oligomycin concentrations (1 μM and 2 μM) were indeed effective, as suggested by the significant drop in OCR following oligomycin injection due to complex V inhibition (see Figure 2B for 2 μM oligomycin; not shown for 1 μM oligomycin). At both tested oligomycin concentrations, maximal decreases in OCR were observed at 2.5 × 10⁵ cells per well. Finally, injection of 50 mM 2-DG resulted in a significant reduction of ECAR, implying that glycolysis is the source of ECAR observed in these experiments. Taken together, it may be concluded that HSPCs achieve maximum glycolysis following glucose injection in these assays, and they possess little-to-no glycolytic reserve. This indicates that, like purified HSCs, lineage-negative HSPCs, which include the HSC fraction used in this assay, also rely predominantly on glycolysis for their ATP production. In cells with a high glycolytic rate,there may not be a significant increase in ATP demand upon oligomycin-mediated inhibition of mitochondrial ATP production. Cells could easily manage the loss of mitochondrial ATP without further upregulating glycolysis19. Glycolysis stress test parameters-non-glycolytic acidification, glycolysis, glycolytic capacity, and glycolytic reserve as shown in Figure 2C-were calculated as described previously in the introduction and protocol sections. Based on these data, 2.5 × 10⁵ cells per well and 2 μM of oligomycin were selected for further studies.
The mitochondrial stress test was used for the optimization of FCCP concentration. In this assay, 2.5 × 10⁵ HSPCs were used per well, as optimized previously via the glycolysis stress test. As shown in Figure 3A, the assay begins with the measurement of baseline OCR followed by 2 μM oligomycin injection, causing a significant reduction in OCR via the inhibition of complex V. Following post-oligomycin injection OCR measurements, FCCP was injected at varying concentrations: 0.5 μM, 1 μM, 1.5 μM, and 2 μM. As indicated earlier, FCCP reverses the oligomycin-induced repression of electron flow through ETC by uncoupling proton transport from OxPHOS and forces complex IV to consume oxygen maximally. As shown in Figure 3A, FCCP stimulates OCR in HSPCs in a dose-dependent manner with a maximal increase in OCR observed at 2 μM of FCCP. Finally, a mixture of 0.5 μM rotenone and 0.5 μM antimycin A was injected, which completely shuts down electron flow through the ETC, and OCR decreases to its minimal level. OCR measured after rotenone and antimycin A injection corresponds to non-mitochondrial oxygen consumption. Other mitochondrial stress test parameters-basal respiration, maximal respiration, proton leak, ATP production, spare respiratory capacity, and coupling efficiency as shown in Figure 3B-were calculated as described previously in the introduction and protocol sections. Finally, 2 μM of FCCP was selected for further studies.
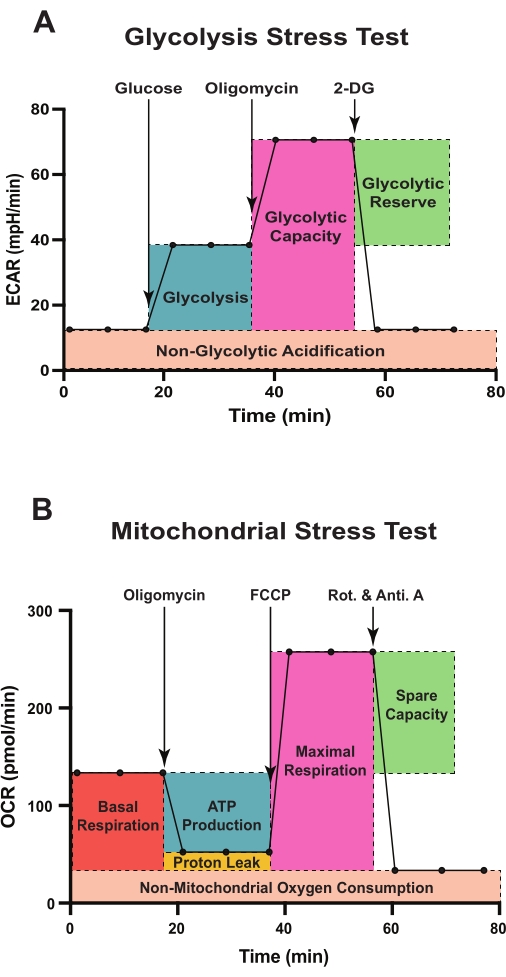
Figure 1: Schematic representation of assessment of glycolytic function and mitochondrial respiration using the extracellular flux analyzer. Sequences and injection timings of various effector compounds used in the glycolytic stress test (A) and the mitochondrial stress test (B) are shown. (A) Glycolytic parameters, glycolysis, glycolytic capacity, glycolytic reserve, and non-glycolytic acidification, and (B) mitochondrial function parameters, basal respiration, ATP-linked respiration, maximal respiration, non-mitochondrial oxygen consumption, proton leak, and spare respiratory capacity are outlined. Abbreviations: ECAR = extracellular acidification rate; 2-DG = 2-deoxy-D-glucose; OCR = oxygen consumption rate; FCCP = carbonyl cyanide-4 (trifluoromethoxy) phenylhydrazone; Rot. = rotenone; Anti. A = antimycin A. Please click here to view a larger version of this figure.
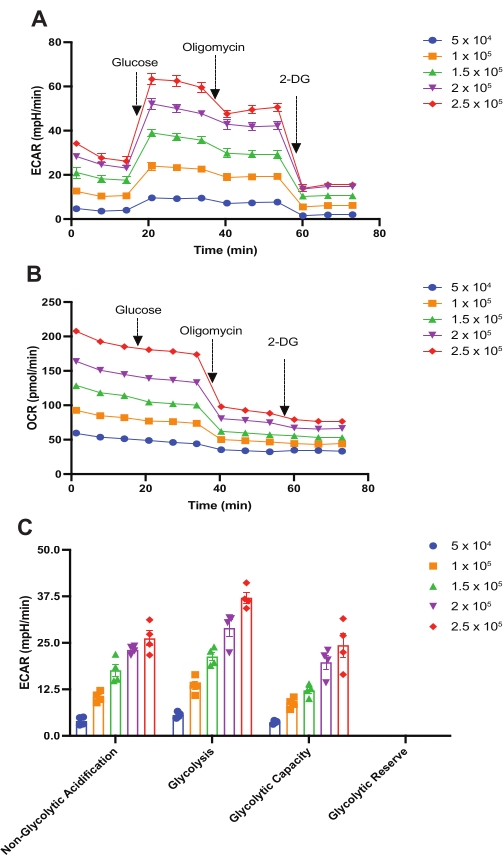
Figure 2: Assessment of the glycolytic function in mouse HSPCs. The glycolysis stress test was performed to measure (A) the extracellular acidification rates (ECAR, mpH/min) and (B) the oxygen consumption rates (OCR, pmol/min) of HSPCs isolated from 24-week-old female C57BL/6 mice. At times indicated, glucose (10 mM), oligomycin (2 µM), and 2-DG (50 mM) were injected. (C) ECAR is calculated as non-glycolytic acidification, glycolysis, glycolytic capacity, and glycolytic reserve per 5 × 10⁴, 1 × 10⁵, 1.5 × 10⁵, 2 × 10⁵, and 2.5 × 10⁵ HSPCs/well. Data are presented as mean ± SEM, n = 4. Abbreviations: HSPCs = hematopoietic stem and primitive progenitor cells; ECAR = extracellular acidification rate; 2-DG = 2-deoxy-D-glucose; OCR = oxygen consumption rate. Please click here to view a larger version of this figure.
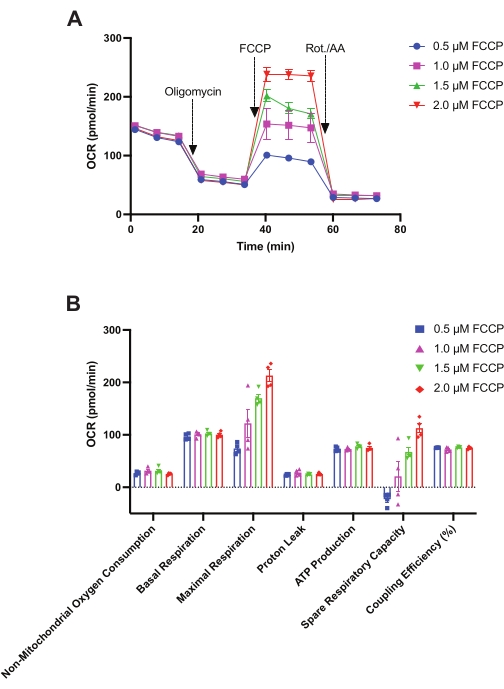
Figure 3: Assessment of the mitochondrial respiration in mouse HSPCs. A mitochondrial stress test was performed to measure (A) the oxygen consumption rates (pmol/min) of HSPCs isolated from 24-week-old female C57BL/6 mice. At times indicated, oligomycin (2 µM), FCCP (0.5 µM, 1 µM, 1.5 µM, 2 µM), and rotenone and antimycin A (Rot./AA, 0.5 µM each) were injected. (B) OCR is calculated as non-mitochondrial oxygen consumption, basal respiration, proton leak, maximal respiration (per 0.5 µM, 1 µM, 1.5 µM, and 2 µM FCCP), ATP production, spare respiratory capacity (per 0.5 µM, 1 µM, 1.5 µM, and 2 µM FCCP), and coupling efficiency per 2.5 × 10⁵ HSPCs/well. Data are presented as mean ± SEM, n = 4. Abbreviations: HSPCs = hematopoietic stem and primitive progenitor cells; OCR = oxygen consumption rate; FCCP = carbonyl cyanide-4 (trifluoromethoxy) phenylhydrazone; Rot. = rotenone; AA = antimycin A. Please click here to view a larger version of this figure.
Injection Port | Port volume | Injecting compound (10x concentrated) | Final compound concentration in the well |
A | 20 μL | Glucose (100 mM) | 10 mM |
B | 22 μL | Oligomycin (20 μM) | 2 μM |
C | 25 μL | 2-DG (500 mM) | 50 mM |
Table 1: Injection strategy for the glycolysis stress test. Abbreviation: 2-DG = 2-deoxy-D-glucose.
1 | Calibration | ||||
2 | Equilibration | ||||
3 | Injections and measurements | ||||
Cycles | Mix | Wait | Measure | ||
Baseline (Non-glycolytic acidification) | 3 times | 3 min | 0 min | 3 min | |
Inject Port A: Glucose | 3 times | 3 min | 0 min | 3 min | |
Inject Port B: Oligomycin | 3 times | 3 min | 0 min | 3 min | |
Inject Port C: 2-DG | 3 times | 3 min | 0 min | 3 min |
Table 2: Extracellular flux analyzer program for the glycolysis stress test. Abbreviation: 2-DG = 2-deoxy-D-glucose.
Injection Port | Port volume | Injecting compound (10x concentrated) | Final compound concentration in the well |
A | 20 μL | Oligomycin (20 μM) | 2 μM |
B | 22 μL | FCCP (20 μM) | 2 μM |
C | 25 μL | Rotenone (5 μM) + antimycin A (5 μM) | 0.5 μM each |
Table 3: Injection strategy for the mitochondrial stress test. Abbreviation: FCCP = carbonyl cyanide-4 (trifluoromethoxy) phenylhydrazone.
1 | Calibration | ||||
2 | Equilibration | ||||
3 | Injections and measurements | ||||
Cycles | Mix | Wait | Measure | ||
Baseline measurements | 3 times | 3 min | 0 min | 3 min | |
Inject Port A: Oligomycin | 3 times | 3 min | 0 min | 3 min | |
Inject Port B: FCCP | 3 times | 3 min | 0 min | 3 min | |
Inject Port C: Rotenone & Antimycin A | 3 times | 3 min | 0 min | 3 min |
Table 4: Extracellular flux analyzer program for the mitochondrial stress test. Abbreviation: FCCP = carbonyl cyanide-4 (trifluoromethoxy) phenylhydrazone.
This method paper describes an optimized protocol for the assessment of cellular bioenergetics (glycolysis and OxPHOS) in mouse HSPCs using the Seahorse extracellular flux analyzer. This device is a powerful tool that simultaneously measures the ECAR and OCR of live cells, which are metrics of glycolysis and mitochondrial respiration, respectively. Thus, it can be used to assess the cellular bioenergetics in real time. Further, the 96-well microplate-based platform offers high-throughput quantification with high sensitivity, allowing simultaneous analysis of multiple samples using a single plate, compared to another high-resolution respirometer, the Oroboros O2k, which can only analyze 2 samples simultaneously, or the classical Clark electrode20.
The extracellular flux analyzer has primarily been used for the analysis of adherent cell types, as it requires cells to be present in a monolayer, rendering it more challenging to analyze cells grown in suspension. Moreover, following drug injection from the port, turbulence occurs during the drug-media mixing cycle in the wells prior to the measurements, which may dislodge the cells. Therefore, cells need to be firmly attached to the bottom of the well. The protocols described here have used a cell-adhesive formulation of non-immunogenic polyphenolic proteins extracted from the marine mussel, Mytilus edulis, to prepare an adherent monolayer of murine HSPCs.
Another limitation of this technology is the per-assay cost, which is very high compared to the Clark-type electrode and the Oroboros O2k. The cartridges are relatively expensive and cannot be reused. It is estimated that the cost of the extracellular flux analyzer itself is ~4 times higher than the Oroboros O2k20. However, given the semi-automation and high-throughput capability of the extracellular flux analyzer, a much greater amount of data can be gathered per run than with the O2k.
The results obtained here show that 2.5 × 10⁵ HSPCs per well are required to obtain reliable data using a 96-well-based extracellular flux analyzer. This adds another challenge in performing flux assays using HSPCs, which are difficult to obtain in large quantities from a mouse and require flow cytometric sorting to obtain a pure population. Moreover, flow-sorting adds substantial time to the experiment and could alter the metabolic phenotype of the progenitor cells. To overcome the limitations associated with flow cytometry-based purification, the strategy discussed here utilized lineage-specific antibodies bound to magnetic beads to deplete lineage-committed progenitors, thus enriching the lineage-negative HSPCs. To further enrich for more primitive HSPCs, an additional cKit enrichment step can be added; however, this comes with the cost of additional ex vivo time (~1.5 h) and a reduction in cell number. The utilization of such a protocol would require optimization outside of the scope of this protocol.
To maintain their pluripotency, HSCs must remain quiescent and preferentially reside in the hypoxic environment inside the bone marrow9,21. Quiescent HSCs are believed to rely predominantly on glycolysis to fulfill their modest energy requirements, as high levels of ROS, a byproduct of mitochondrial respiration, are detrimental to their stemness2,3. HSCs possess relatively high, but largely inactive mitochondrial mass, maintaining cellular ROS at low levels to allow maintenance of HSCs pluripotency9. However, during commitment and differentiation, mitochondria become the primary source of ATP production in HSCs5,9. Thus, mitochondria play a key function in transitioning HSCs from quiescence to the metabolically active state required for their lineage commitment and differentiation. In addition to producing ATP via OxPHOS, mitochondria play many other important roles in hematopoietic cell homeostasis, including ROS regulation, apoptosis, calcium signaling, and the synthesis of heme and many other critical metabolite intermediates9. Alterations in mitochondrial functions could significantly impact HSC/progenitor differentiation pathways and may contribute to various hematological disorders, such as hematopoietic malignancies, congenital dyserythropoiesis and sideroblastic anemias, and myelodysplastic syndromes13. In malignant hematopoietic cells, dysfunctional mitochondria play a critical role in conferring resistance to apoptosis induced by various cytotoxic drugs13.
Owing to the central role of mitochondria in maintaining HSC/progenitor homeostasis, valuable insights into the physiological status of these cells can be obtained by assessing their mitochondrial OxPHOS under normal and stress conditions. The identification of novel modulators of mitochondrial activities could identify novel therapeutic targets for treating hematologic abnormalities. The protocol described in this paper can be used to screen the effects of chemical compounds or metabolic CRISPR libraries on the OCR and ECAR of HSCs under normal and pathological conditions, e.g., HSCs harvested from genetically engineered mouse models of hematological disorders. Such screening could also be useful in elucidating metabolic pathways that sustain HSC potency in their hypoxic niche, which would be useful in devising strategies for in vitro expansion of HSCs while maintaining their pluripotency for therapeutic purposes. Given the high-throughput nature of this analysis, the protocol described here could easily be adapted to screen a large number of bioenergetic modulators in HSCs, hematopoietic progenitors, and malignant hematopoietic cells.
In summary, the methods presented here describe optimized protocols for measuring ECAR and OCR in primary mouse HSPCs using the extracellular flux analyzer. Results obtained from the glycolysis stress test have shown that 2.5 × 10⁵ cells per well and 2 μM oligomycin are optimal for further analysis. Using 2.5 × 10⁵ cells per well and 2 μM oligomycin, the mitochondrial stress test was performed to optimize the FCCP concentration, and 2 μM of FCCP was found to induce maximal OCR. Although the current study is mainly focused on mouse HSPCs, the protocol and this approach could easily be adapted to optimize analysis conditions for any type of suspension cells.
The authors have nothing to disclose.
Work in Lombard laboratory is supported by the NIH (NIGMS R01GM101171, NIEHS R21ES032305), DoD (CA190267, CA170628, NF170044, and ME200030), and Glenn Foundation for Medical Research. Work in Li laboratory is supported by NIH (NHLBI 5R01HL150707).
0.2 μm filter | Corning | 430626 | Used to filter-sterilize the assay media |
100 mM sodium pyruvate | Life Technologies | 11360-070 | Component of mitochondrial stress test assay medium |
15 mL conical Falcon tubes | Corning | 352096 | Used during HSPCs harvest and to prepare assay drug solutions |
200 mM L-glutamine | Life Technologies | 25030-081 | Component of glycolysis stress test and mitochondrial stress test assay media |
2-Deoxy-D-glucose (2-DG) | Sigma-Aldrich | D8375 | 3rd drug injection during glycolysis stress test |
5x Enrichment buffer (MojoSort) | Biolegend | 480017 | Used for washings during HSPCs harvest |
Ammonium chloride (NH4Cl) | Fisher Scientific | A661-3 | Component of ACK lysis buffer |
Antimycin A | Sigma-Aldrich | A8674 | 3rd drug injection during mitochondrial stress test |
Bio-Rad DC protein assay kit | Bio-Rad | 500-0112 | Used as per manufacturer's instructions |
Carbonyl cyanide-4 (trifluoromethoxy) phenylhydrazone (FCCP) | Sigma-Aldrich | C2920 | 2nd drug injection during mitochondrial stress test |
Cell-Tak | Corning | 354240 | Cell adhesive. Used for coating cell microplates |
Countes 3 Automated Cell Counter | ThermoFisher Scientific | For cell counting | |
EDTA | Fisher Scientific | O2793-500 | Component of ACK lysis buffer and RIPA lysis buffer |
Falcon 70 μm filter | Fisher Scientific | 08-771-2 | Used as cells strainer during HSPCs harvest |
Gibco Fetal bovine serum (FBS) | Fisher Scientific | 26400044 | Used to prepare assay buffer during HSPCs harvest |
Gibco HBSS | Fisher Scientific | 14175095 | Used to prepare assay buffer during HSPCs harvest |
Glucose | Sigma-Aldrich | G7528 | Component of mitochondrial stress test assay medium and first injection of glycolysis stress test |
Oligomycin | Sigma-Aldrich | O4876 | 2nd drug injection during glycolysis stress test and 1st drug injection during mitochondrial stress test |
PBS | Life Technologies | 10010-049 | Used to wash cells after assay for protein quantification |
Potassium bicarbonate (KHCO3) | Fisher Scientific | P235-500 | Component of ACK lysis buffer |
Protease Inhibitor Cocktail (PIC) | Roche | 11836170001 | Supplied as tablets. One tablet was dissolved in 10 mL of RIPA buffer to make 1x PIC. |
Rat biotin antimouse-B220, Clone ID: RA3-6B2 | Biolegend | 103203 | Used for lineage depletion during HSPCs harvest |
Rat biotin antimouse-CD2, Clone ID: RM2-5 | Biolegend | 100103 | Used for lineage depletion during HSPCs harvest |
Rat biotin antimouse-CD3, Clone ID: 17A2 | Biolegend | 100243 | Used for lineage depletion during HSPCs harvest |
Rat biotin antimouse-CD5, Clone ID: 53-7.3 | Biolegend | 100603 | Used for lineage depletion during HSPCs harvest |
Rat biotin antimouse-CD8, Clone ID: 53-6.7 | Biolegend | 100703 | Used for lineage depletion during HSPCs harvest |
Rat biotin antimouse-Gr-1, Clone ID: RB6-8C5 | Biolegend | 108403 | Used for lineage depletion during HSPCs harvest |
Rat biotin antimouse-Ter-119, Clone ID: TER-119 | Biolegend | 116203 | Used for lineage depletion during HSPCs harvest |
Rotenone | Sigma-Aldrich | R8875 | 3rd drug injection during mitochondrial stress test |
Seahorse XFe96 extracellular flux analyzer | Seahorse Biosciences now Agilent | For ECAR and OCR measurments in real time. | |
Sodium bicarbonate | Sigma-Aldrich | S5761 | Used to make Cell-adhesive solution for microplate coating |
Sodium chloride (NaCl) | Fisher | BP358 | Component of RIPA lysis buffer |
Sodium deoxycholate | Sigma-Aldrich | D6750 | Component of RIPA lysis buffer |
Sodium Fluoride (NaF) | Sigma-Aldrich | S7920 | Component of RIPA lysis buffer |
Sodium hydroxide (NaOH) | Sigma-Aldrich | S8045 | Prepared 1 N solution. Used for pH normalization |
Streptavidin Nanobeads (MojoSort) | Biolegend | 480015 | Used for lineage depletion during HSPCs harvest |
Tris-HCl | Fisher | BP153 | Component of RIPA lysis buffer |
XF base medium | Agilent | 102353-100 | base medium used to prepare glycolysis stress test and mitochondrial stress test assay media |
XF prep station | Seahorse Biosciences | Used for non-CO2 37 °C incubations | |
XFe96 extracellular FluxPak | Agilent | 102416-100 or 102601-100 | Includes assay cartridges with utility plates, loading guide flats for loading drugs onto the assay cartridge, XF calibrant solution, and XF cell culture microplate |