Metabolism is the cellular process of producing energy. Cellular metabolism encompasses multiple pathways, including glycolysis, oxidative phosphorylation, and glutaminolysis. Healthy cells use these metabolic pathways to generate energy for proliferation and function, such as the production of cytokines by immune cells. Many diseases, including metabolic disorders, cancer, and neurodegeneration, are characterized by altered cellular metabolism1. For example, some cancer cell types have elevated rates of glycolysis, even in the presence of oxygen, to generate molecules for the synthesis of nucleic acids, proteins, and lipids2,3. This phenomenon, known as the Warburg effect, is a hallmark of many cancer types, including breast cancer, lung cancer, and glioblastomas4. Because of the alterations of cellular metabolism associated with cancer progression, cellular metabolism can be a surrogate biomarker for drug response5,6. Moreover, understanding drug efficacy at a cellular level is crucial as cell heterogeneity can lead to differing drug responses in individuals7,8.
Technologies that identify and quantify changes in cellular metabolism are essential for studies of cancer and drug response. Chemical and protein analyses are used to evaluate the metabolism of cells or tissues but lack single-cell resolution and spatial information. Metabolic plate reader-based assays can measure pH and oxygen consumption in the sample over time and the subsequent metabolic perturbation by chemicals. The pH can be used to calculate the extracellular acidification rate (ECAR), which provides an insight into the glycolytic activity of the cells9. Whole-body imaging methods, including 2-[fluorine-18] fluoro-D-glucose positron emission tomography (FDG PET) and magnetic resonance spectroscopy (MRS), are noninvasive imaging modalities used clinically to identify tumor recurrence and drug efficacy through metabolic measurements10,11,12,13,14.
FDG-PET images the tissue uptake of FDG, a radiolabeled glucose analog. Increased uptake of FDG-PET by tumors relative to surrounding tissue is due to the Warburg effect12,13. MRS images common nuclei of molecules used for metabolism, such as 13C and 31P, and can obtain dynamic information about how metabolism changes in response to stimuli, such as exercise or eating14. Although FDG-PET and MRS can be used clinically, these technologies lack the spatial resolution to resolve intratumoral heterogeneity. Likewise, oxygen consumption measurements are made on a bulk population of cells. Autofluorescence imaging overcomes the spatial resolution obstacle of these technologies and provides a noninvasive method of quantifying cellular metabolism.
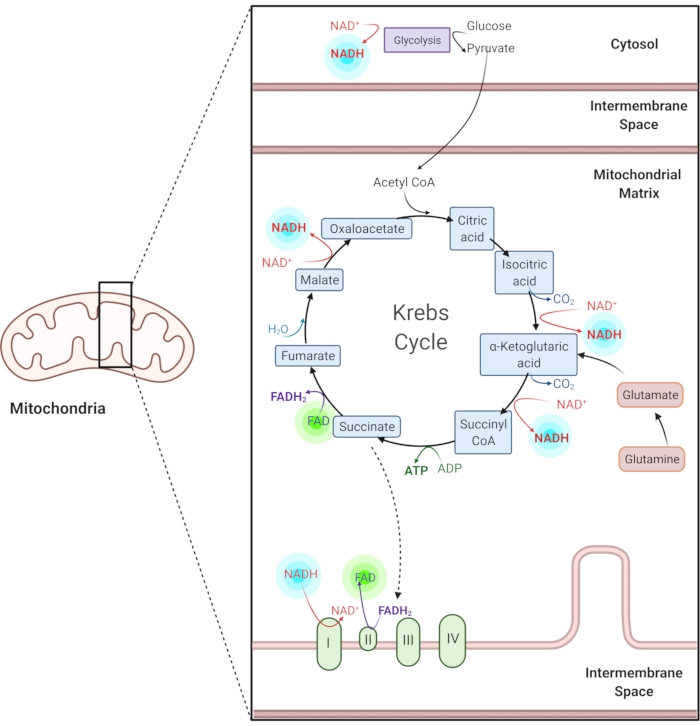
Figure 1: NADH and FAD in common metabolic pathways. NADH and FAD are coenzymes used in glycolysis, the Krebs cycle, and the electron transport chain. Autofluorescence imaging of these molecules provides information about cellular metabolism. Please click here to view a larger version of this figure.
Reduced nicotinamide adenine (phosphate) dinucleotide (NAD(P)H) and oxidized flavin adenine dinucleotide (FAD) are coenzymes of metabolic reactions, including glycolysis, oxidative phosphorylation, and glutaminolysis (Figure 1). Both NAD(P)H and FAD are autofluorescent and provide endogenous contrast for fluorescence imaging1,15. NADPH has similar fluorescent properties to NADH. Because of this, NAD(P)H is often used to represent the combined signal of NADH and NADPH2,16.
Fluorescence lifetime imaging (FLIM) quantifies the fluorescence lifetime or the time for which a fluorophore is in the excited state. Fluorescence lifetimes are responsive to the microenvironment of the fluorophores and provide information about cellular metabolism17. NAD(P)H and FAD can exist within cells in either protein-bound or free conformations, each of which has a different lifetime. Free NAD(P)H has a shorter lifetime than protein-bound NAD(P)H; conversely, free FAD has a longer lifetime than bound FAD18,19. The lifetimes and lifetime component weights can be quantified from fluorescence lifetime decay data through Eq. (1)20:
I(t) = α1e–t/τ1 + α2e–t/τ2 + C (1)
Eq (1) represents the normalized fluorescence intensity as a function of time. The α1 and α2 in this equation represent the proportional components of short and long lifetimes (α1+ α2=1), respectively, τ1 and τ2 represent the short and long lifetimes, respectively, and C accounts for background light7,20. The amplitude-weighted lifetime, represented here as τm, is calculated using Eq. (2).
τm= α1τ1+ α2τ2 (2)
A mean lifetime can be computed by averaging "t" over the intensity decay of the fluorophore, which for a two-exponential decay is shown by Eq. (3)17,21.
τ*m= (α1τ12+ α2τ22)/ (α1τ1+ α2τ2) (3)
A fluorescence intensity image can be computed from the lifetime image by integrating the fluorescence lifetime decay. Autofluorescence imaging is a nondestructive and label-free method that can be used to characterize the metabolism of live cells at a subcellular resolution. The optical redox ratio provides an optical analog metric of the chemical redox state of the cell and is calculated as the ratio of NAD(P)H and FAD intensities. Although the formula for calculating the optical redox ratio is not standardized22,23,24,25, it is defined here as the intensity of FAD over the combined intensities of NAD(P)H and FAD. This definition is used because the summed intensity in the denominator normalizes the metric between 0 and 1, and the expected result of the cyanide inhibition is a decrease in the redox ratio. The fluorescence lifetimes of free NAD(P)H and FAD provide insight into changes in the metabolic solvent microenvironment, including pH, temperature, proximity to oxygen, and osmolarity17.
Changes in the fluorescence lifetime of the bound fractions of NAD(P)H and FAD can indicate metabolic pathway utilization and substrate-specific metabolism26. Component weights can be interpreted for changes in the free to the bound fraction of the coenzymes18,19. Altogether, these quantitative autofluorescence lifetime metrics allow the analysis of cellular metabolism, and autofluorescence imaging has been used for identifying neoplasms from normal tissues27,28, characterizing stem cells29,30, evaluating immune cell function31,32,33,34,35, gauging neurological activity36,37,38, and understanding drug efficacy in cancer types such as breast cancer and head and neck cancer21,39,40,41,42. High-resolution autofluorescence imaging can be combined with image segmentation for single-cell analysis and quantification of intrapopulation heterogeneity43,44,45,46,47.
NAD(P)H and FAD can be imaged on single-photon or multiphoton fluorescence microscopes configured for intensity or lifetime imaging. For single-photon microscopes, NAD(P)H and FAD are typically excited at wavelengths of 375-405 nm and 488 nm, respectively, due to common laser sources at these wavelengths48. In two-photon fluorescence excitation, NAD(P)H and FAD will excite at wavelengths of approximately 700 to 750 nm and 700 to 900 nm, respectively15,49. Once the fluorophores are excited, NAD(P)H and FAD emit photons at wavelengths between ~410 nm to ~490 nm and ~510 nm to ~640 nm, respectively15. The NAD(P)H and FAD maxima emission wavelengths are approximately 450 nm and 535 nm, respectively48.
Because of their different excitation and emission wavelengths, the fluorescence of the two metabolic coenzymes can be spectrally isolated. An understanding of the spectral characteristics of NAD(P)H and FAD is necessary for the design and optimization of autofluorescence imaging protocols. Cyanide is an electron transport chain (ETC) complex IV inhibitor. The effects of cyanide on cellular metabolism and the autofluorescence intensities and lifetimes of NAD(P)H and FAD within cells are well characterized27,40. Therefore, a cyanide perturbation experiment is an effective means of validating NAD(P)H and FAD imaging protocols. A successful cyanide experiment provides confidence that the NAD(P)H and FAD imaging protocol can be used to assess the metabolism of unknown groups or perturbations.
1. Cell plating for imaging
- Aspirate the medium from an 80-90% confluent T-75 flask of MCF-7 cells, rinse the cells with 10 mL of sterile phosphate-buffered saline (PBS), and add 2 mL of 0.25% trypsin (1x) to detach the cells from the flask bottom.
- Incubate the flask at 37 °C for ~4 min. Check the cells under the microscope to confirm detachment.
- Immediately add 8 mL of culture medium to de-activate the trypsin.
- Collect the cells in a conical tube (15 mL or 50 mL). Count the cells using a hemocytometer.
- Centrifuge the cells 200 × g for 5 min.
- Once centrifuged, aspirate the supernatant. Resuspend the pellet of cells in 1 mL of culture medium, and seed 4 × 10⁵ cells onto a 35 mm glass-bottom imaging dish (or the appropriate sample holder for the microscope being used).
- Add 2 mL of culture medium to the imaging dish to maintain cell metabolism.
- Incubate the cells at 37 °C with 5% CO2 for 24-48 h prior to imaging for the cells to adhere and reach the logarithmic growth phase.
NOTE: The growth phase was determined by prior experience with these cells and confirmed with the cell datasheet.
2. Multiphoton FLIM imaging of NAD(P)H and FAD
- Turn on all components of the multiphoton fluorescence lifetime microscope, including the microscope, the laser source, and the detectors being used.
- Sample placement
- Turn on the brightfield lamp. Ensure that light is going into the eyepiece. Choose an objective, usually 20x, 40x, or 100x for cell imaging. Apply 1 drop of the appropriate immersion medium on top of the objective [skip if using an air objective].
- Move the objective down to properly place the sample without touching the objective. Place the glass-bottom dish onto the sample holder on the microscope stage. Ensure that the specimen is secure and will not move during imaging.
- Center the specimen with the objective using the X-Y stage control. Once this is done, look into the eyepiece and move the objective up to focus on the cells.
- If the microscope is within an enclosure, close the lightbox door. Open the image acquisition software, click on the Multiphoton Imaging tab, and set the following multiphoton imaging parameters: image size = 256 x 256 pixels; pixel dwell time = 4-25 µs; total image acquisition time = ~60 s; optimized detector gain for single-photon counting = 85% (specific to the system being used).
- Imaging of Instrument Response Function (IRF) and Fluorescent Lifetime Standard
- Place urea crystals on a glass-bottom dish and secure the dish lid with tape or parafilm.
NOTE: Urea crystals remain stable at room temperature for months. - Image the urea crystals.
- Place the urea dish on the microscope stage and focus on a urea crystal.
- Set the wavelength of the excitation laser to 900 nm.
- Use an emission filter that captures 450 nm wavelengths.
- Obtain a fluorescence lifetime image of the urea crystal with laser power at the sample <1 mW and use the recommended imaging parameters mentioned in step 2.2.4.
- Image the Yellow-green (YG) beads as a fluorescence lifetime standard.
- Create a YG bead slide by diluting the YG bead solution 1:1,000 in sterile water. Place a small volume (~30 µL) onto a slide or glass-bottom dish. Cover with a coverslip and seal the edges of the coverslip with clear nail polish.
- Place the YG bead slide on the microscope stage with the coverslip side of the slide towards the objective.
- Set the wavelength of the excitation laser to 890 nm
- Use an emission filter that captures ~500-600 nm wavelengths.
- Obtain a fluorescence lifetime image of the YG bead using a laser power at the sample <1 mW and the recommended image parameters [step 2.2.4].
- Check the lifetime of the bead using the IRF of the urea. If the lifetime is not ~2.1 ns, check whether the bead is in contact with another bead contributing to fluorescence quenching, the bead solution has dried, the bead is out of focus, IRF is not accurate, or the shift between IRF and fluorescence decay is not optimized [see step 4.2.4].
NOTE: The lifetime of ~2.1 ns is stable over time.
- Place urea crystals on a glass-bottom dish and secure the dish lid with tape or parafilm.
- NAD(P)H imaging
- Place the glass-bottom dish with the cells on the microscope stage and focus on the cells.
NOTE: It is recommended that the cells be placed in an environmental chamber to maintain heat, humidity, and CO2 levels during image acquisition, as these parameters can influence cellular metabolism. - Adjust the gain of the detector to the optimal value for FLIM. Additionally, change to the desired dwell time-a parameter indicating the time the laser spends at each pixel of the specimen.
NOTE: These parameters should stay the SAME throughout the remainder of the procedure. This is to ensure consistency in laser illumination and detector settings to ensure the validity of the intensity-based measurements, which are dependent on laser power, scan parameters, and detector gain. There is an optimized detector gain for operating detectors in single-photon counting mode; the value is 85% for the system referenced. - Set the multiphoton laser to 750 nm. Ensure that the power control for the laser is set at zero initially so that the cells are not damaged upon opening the shutter on the laser.
NOTE: Excitation at 750 nm is recommended for NAD(P)H, although it has broad absorption at 700-750 nm. Excitation at 890 nm is recommended for FAD, although it has broad absorption at 700-900 nm. - Set or select an emission filter to collect emission wavelengths at ~400-500 nm.
- Begin imaging in a focusing or live-view manner to optimize the image settings.
NOTE: The laser is now operating. Do not open the microscope enclosure at this point. Wear appropriate personal protective equipment. - Slowly increase the laser power to ~ 3-8 mW at the sample while also ensuring the cells are in focus. Once adjusted, record the maximum power used. Use this power setting for the imaging on other segments of the Petri dish for NAD(P)H imaging.
NOTE: It is important to measure the laser power at the sample or a pick-off window and not rely on the pockels cell voltage as the pockels cells are not stable. Often laser power is monitored during imaging with a pick-off window instead of at the sample. Using a second power meter at the objective, the relationship between the power at the pick-off window and the power at the sample can be used to estimate the approximate power at the sample from the pick-off window measurements. - Collect an NAD(P)H FLIM image with an image integration time of 60 s.
- Check that the image has sufficient photons (peak of ~100 photons for a cytoplasm pixel) within the fluorescence lifetime decay curve. If the number of photons is too low, increase the laser power or duration of image acquisition.
NOTE: The minimum peak number of photons within the fluorescence exponential decay is dependent on system parameters, including temporal resolution, IRF, and background noise.
- Place the glass-bottom dish with the cells on the microscope stage and focus on the cells.
- FAD imaging
- Set the multiphoton laser to 890 nm and wait for it to mode-lock at the new wavelength. Ensure that the power control for the laser is set at zero initially so that the cells are not damaged upon opening the shutter on the laser.
NOTE: Do not move the stage or objective focus when conducting this step. The FAD field of view (FOV) should directly match NAD(P)H FOV for this image. - Set or select an emission filter to collect emission wavelengths at ~500-600 nm.
- Begin imaging in a focusing or live-view manner to optimize the image settings.
NOTE: The laser is now operating. Do not open the microscope enclosure at this point. - Slowly increase the laser power to ~5-10 mW at the sample and record the maximum power used. Use this as the power setting for the imaging on other segments of the Petri dish for FAD imaging.
- Collect an FAD FLIM image with an image integration time of 60 s.
- Check that the image has sufficient photons (peak of ~100 photons for a cytoplasm pixel) within the fluorescence lifetime decay curve. If the number of photons is too low, increase the laser power or duration of image acquisition.
NOTE: The minimum peak number of photons within the fluorescence exponential decay is dependent on system parameters, including temporal resolution, IRF, and background noise.
- Set the multiphoton laser to 890 nm and wait for it to mode-lock at the new wavelength. Ensure that the power control for the laser is set at zero initially so that the cells are not damaged upon opening the shutter on the laser.
- Repeat steps 2.4-2.5 at an additional four to five FOVs. Ensure that each image is spaced at least 2 FOVs away from the imaged locations.
3. Cyanide experiment preparation
- Dissolve 130.24 mg of sodium cyanide in 25 mL of PBS to make an 80 mM (20x) sodium cyanide solution.
NOTE: Cyanide is toxic. Wear appropriate personal protective equipment. - Aspirate 100 µL of culture medium from the dish. Replace this with 100 µL of sodium cyanide solution to obtain a 4 mM concentration of cyanide in the dish.
- Put the cells in an incubator for 5 min to allow the cells to react with the cyanide solution.
- Repeat steps 2.4-2.6 to acquire NAD(P)H and FAD images of the cells after cyanide exposure.
NOTE: Prolonged exposure to cyanide will kill the cells. Postcyanide images are acquired within 30 min of the cyanide addition.
4. FLIM image analysis
- Open the FLIM lifetime analysis software.
- Open the urea image to acquire the measured IRF.
- Import the urea image. Select a point on the image of the urea crystal to be used for image analysis. Increase the spatial bin value to integrate FLIM data from multiple pixels to 1 or higher for a decay peak > 100 photons by changing the Bin variable located on the main software interface.
- Save the data as an IRF.
- In the referenced software, click the dropdown menu titled IRF, select Copy from Decay Data. After this, click Copy to Clipboard to be utilized in the image analysis of the image taken during the experiment.
- Image analysis of NAD(P)H and FAD lifetime images
- Import the image file into fluorescence lifetime analysis software.
- Improve image visualization to see the cells and subcellular compartments by changing the intensity and contrast if needed.
- Click the Options dropdown menu and select Intensity. Here, change the intensity and contrast as desired and click Ok.
- Import the IRF from the urea image.
- Click the IRF dropdown menu and select Paste from Clipboard.
- Set Multiexponential Decay parameters50.
- Set a threshold value to evaluate decays for cytoplasm pixels.
NOTE: Here, a value of 50 was used. The value was selected by comparing the fluorescence peak values of several representative background and nucleus pixels with the peak value of several cytoplasm pixels. A value between the nucleus pixels and cytoplasm pixels was selected for the threshold.
- Set a threshold value to evaluate decays for cytoplasm pixels.
- Check that the Shift value aligns the IRF relative to the rising edge of the fluorescence. Adjust the shift if needed to a value that minimizes the Chi-squared value.
- Increase the spatial bin so that cytoplasm pixels have fluorescence peak values at or above 100.
NOTE: Increasing the spatial bin will lead to decreased spatial resolution. - Compute fluorescence lifetimes for all pixels in the image.
- In the referenced program, click the Calculate dropdown menu | Decay Matrix.
NOTE: Success is indicated with an image false-colored to the amplitude-weighted fluorescence lifetime.
- In the referenced program, click the Calculate dropdown menu | Decay Matrix.
- Save the fluorescence lifetime data.
- Click the File dropdown menu | Export. Choose the desired parameters for analysis and click Ok. Save the image.
- Select the Color button from the Options dropdown menu to adjust the fluorescence lifetime metric displayed, the color configuration à B-G-R, and set the specific color bar minimum and maximum values to adjust the color scale of the fluorescence lifetime image.
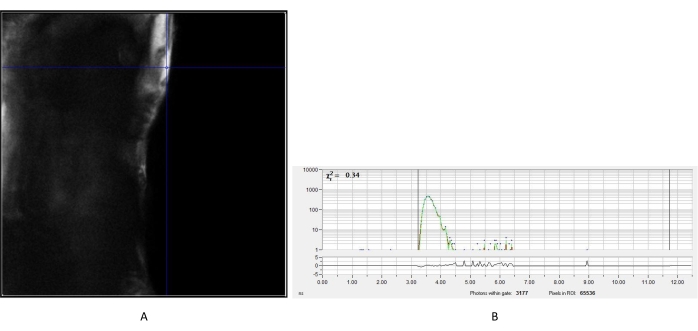
Figure 2: Measured IRF of urea crystal. (A) Intensity image obtained from the urea. A representative pixel was chosen to create the IRF decay curve (B) for subsequent analysis of fluorescence lifetime images of cells. Abbreviation: IRF = instrument response function. Please click here to view a larger version of this figure.
- Cell segmentation
NOTE: The protocol described here uses an image analysis software51. Representative MCF-7 images and data analysis code are provided52.- Download the MCF7_Segmentation_Final.cpproj file52.
- Import the MCF7_Segmentation Pipeline by clicking on File | Import | Pipeline from file, select the file MCF7_Segmentation_Final.cpproj.
- Click the Images module and add the NAD(P)H intensity images to be segmented.
NOTE: Images must be in.tif, .png, or .jpg format. - Press Analyze Images button on the bottom left.
NOTE: Pipeline may need optimization for images acquired on different systems. For troubleshooting, try the following substeps- Use the Test Mode for testing different parameters: Click Start Test Mode and run each module by clicking the play button next to the module name.
- Click the first IdentifyPrimaryObjects module and adjust the Typical diameter of objects, in pixel units (Min, Max) to match the diameter of the cells.
NOTE: For MCF-7 cells, 10 and 40 pixels were used for the minimum and maximum, respectively. - Click the EnhanceOrSuppressFeatures module and adjust the Feature size to improve identification of the selected Feature type.
NOTE: A feature size of 10 pixels was used for MCF-7 cells. - Click the second EnhanceOrSuppressFeatures module and adjust the Range of hole sizes to optimize the enhancement of the nuclear regions.
NOTE: A range of 5-20 was used for MCF-7 cells. - Click the second IdentifyPrimaryObjects module and adjust the parameters (Threshold strategy, Thresholding method, Threshold smoothing scale, and Threshold correction factor) to optimize the identification of nuclei. Click on the ? by each parameter to identify optimal settings and apply to the IdentifySecondaryObjects module.
- Click on the FilterObjects module and adjust the area shape. Select a minimum and maximum pixel of the area shape to be identified.
NOTE: For the MCF-7 cells, 100 and 500 were used for the maximum and minimum, respectively. The process of cell segmentation by identifying the nucleus and propagation to the cell boundaries is explained in detail by Walsh and Skala47.
- Using the cell cytoplasm masks, average the fluorescence lifetime output variables for each cell within the image.
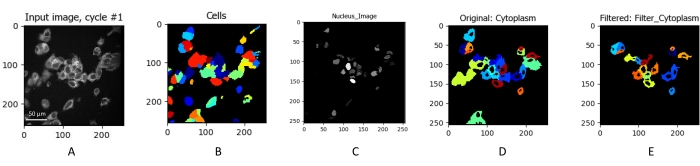
Figure 3: Identification and segmentation of individual cells. The NAD(P)H intensity image of MCF7 cells (A) obtained by integrating a fluorescence lifetime image. Cells were imaged using 750 nm excitation at 5 mW for 60 s. The x and y axes represent the pixel location of the image. (A) Individual cells were identified. The cells were masked (B) to eliminate any background noise from the data set. The nucleus was then identified (C) and projected onto the cell mask (D). The cells were then filtered (E) to remove masked areas that do not fit the size of typical cells. Scale bar = 50 µm. Please click here to view a larger version of this figure.
5. Alternative method: Fluorescence intensity imaging
- Turn on the equipment that will be used during the experiment.
NOTE: Fluorescence intensity images can be acquired with wide-field fluorescence microscopes, confocal fluorescence microscopes, or multiphoton microscopes.- Ensure that the microscope to be used has an appropriate excitation source for NAD(P)H (single-photon wavelength ~370-405 nm: two-photon wavelength ~700-750 nm) and FAD (single-photon wavelength ~488 nm, two-photon wavelength ~890 nm).
- Ensure that the microscope has a filter for the isolation of NAD(P)H emission (~400-500 nm).
NOTE: 4',6-Diamidino-2-phenylindole (DAPI) settings often work for NAD(P)H. - Ensure that the microscope has a filter for isolation of FAD emission (~500-600 nm).
NOTE: Green fluorescent protein (GFP) settings often work for FAD.
- Prepare the microscope.
- Turn on the brightfield lamp. Ensure that light is going into the eyepiece. Apply 1 drop of the appropriate immersion medium on top of the corresponding objective if needed.
- Move the objective down to properly place the samples without any interference. Place the Petri dish onto the stage properly. Ensure that the specimen is secure and will not move during imaging.
NOTE: It is recommended that the cells be placed in an environmental chamber to maintain heat, humidity, and CO2 levels during image acquisition, as these parameters can influence cellular metabolism. - Center the specimen with the objective. Once this is done, look into the eyepiece and move the objective until the cells appear to be in focus.
- Begin intensity imaging.
- Open up the imaging software and set the excitation and emission configuration to capture NAD(P)H by clicking the Capture tab in the image acquisition software and positioning the NAD(P)H excitation and emission filter in the microscope turret.
NOTE: A 357/44 excitation filter, 409 longpass dichroic, and 447/60 emission filter were used for NAD(P)H imaging. - Optimize the excitation illumination and detector parameters. If bleaching is an issue, reduce the illumination intensity and increase the image integration time.
NOTE: NAD(P)H is a weak signal; be aware of bleaching if too much power is used. - Acquire an NAD(P)H image of the desired image size. Ensure that the image is saved.
- Set the excitation and emission configuration to capture FAD. Optimize the excitation illumination and detector parameters.
NOTE: A 458/64 excitation filter, 495 longpass dichroic, and 550/88 emission filter were used for FAD imaging. - Acquire an FAD image. Ensure that the image is saved.
NOTE: NAD(P)H and FAD image acquisition parameters (illumination intensity, image size, detector gain) should stay the same throughout the imaging experiment. - Repeat the process at an additional five locations, spaced at least 2 FOVs away from the imaged locations.
- Open up the imaging software and set the excitation and emission configuration to capture NAD(P)H by clicking the Capture tab in the image acquisition software and positioning the NAD(P)H excitation and emission filter in the microscope turret.
- Image-level redox ratio data analysis
- Open the NAD(P)H and FAD intensity images in an image processing program.
- Set a threshold on the NAD(P)H to retain cytoplasm pixels and set background and nucleus pixels to 0.
- Calculate the redox ratio image by evaluating the equation FAD/(NAD(P)H+FAD) at each pixel using the thresholded NAD(P)H image.
- Calculate the mean value of the non-0 pixels.
NOTE: These steps can be performed in image analysis software or coded directly with scripts.
- Cell-level redox ratio analysis
- Follow steps 4.3.1-4.3.5 to obtain a mask image of the cells within each NAD(P)H image.
- Calculate the redox ratio image by evaluating the equation FAD/(NAD(P)H+FAD) at each pixel.
- Using the cell cytoplasm mask, average the redox ratio for all pixels for each cell within the image.
The epithelial breast cancer cell line, MCF-7, was cultured in DMEM supplemented with 10% fetal bovine serum (FBS) and 1% penicillin-streptomycin. For fluorescence imaging, the cells were seeded at a density of 4 × 10⁵ cells per 35 mm glass-bottom imaging dish 48 h before imaging. The cells were imaged before and after cyanide treatment using the protocols stated above. The goal of the cyanide experiment is to confirm spectral isolation of NAD(P)H and FAD fluorescence and validate the imaging system and analysis protocol for detecting metabolic changes in cells. Paired NAD(P)H and FAD fluorescence lifetime images were taken at five different locations before cyanide and five different locations after the addition of cyanide to the medium. Fluorescence lifetime parameters (optical redox ratio, NAD(P)H α1, NAD(P)H τ1, NAD(P)H τ2, NAD(P)H τm, FAD τ1, FAD τ2, FAD α1, FAD τ1, FAD τ2, and FAD τm) were calculated using the measured IRF from urea (Figure 2) and averaged across the pixels of the cytoplasm of each cell used for segmentation (Figure 3).
Multiphoton fluorescence lifetime imaging of NAD(P)H and FAD allows visualization of cell morphology and metabolism (Figure 4). The high resolution achieved with multiphoton microscopy allows for the identification of single cells. NAD(P)H and FAD are primarily located in the mitochondria and cytoplasm, while the nucleus, which lacks metabolic NAD(P)H and FAD, is dark in comparison23,53. The lifetime images provide visualization of the amplitude-weighted lifetimes of NAD(P)H and FAD throughout the cell and as a result of cyanide exposure (Figure 4).
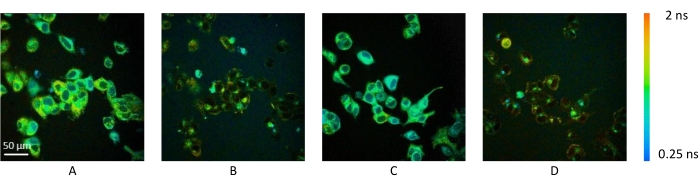
Figure 4: Representative fluorescence lifetime images of MCF7 cells before and after cyanide treatment. (A) NAD(P)H amplitude-weighted fluorescence lifetime image and (B) FAD amplitude-weighted fluorescence lifetime image before cyanide treatment. (C) NAD(P)H amplitude-weighted fluorescence lifetime image and (D) FAD amplitude-weighted fluorescence lifetime image after cyanide treatment. The amplitude-weighted fluorescence lifetime (indicated by the color bar) measures the time for which a fluorophore, in these cases NAD(P)H and FAD, is in an excited state. NAD(P)H lifetime decreases with cyanide treatment, whereas the FAD lifetime increases after cyanide treatment. NADH signal was imaged using 750 nm excitation at 5 mW for 60 s, and the FAD signal was imaged using 890 nm excitation at 7 mW for 60 s. Images acquired with a 40x water-immersion objective, numerical aperture = 1.1. Scale bar = 50 µm. Please click here to view a larger version of this figure.
Cyanide inhibits complex IV of the electron transport chain, which inhibits oxidative phosphorylation2,15. After cyanide exposure and prior to cell death, NAD(P)H accumulates within the mitochondria, and FAD decreases1,15. Due to these well-defined changes in NAD(P)H and FAD intensity due to cyanide inhibition of metabolism, the perturbation is a standard test to verify autofluorescence imaging and analysis protocols2,54. As expected, the optical redox ratio (FAD/(FAD+NAD(P)H)) of MCF-7 cells decreased after cyanide treatment (Figure 5, p = 0.044, Welch's t-test). The optical redox ratio is not a standardized formula, yet all intensity formulas have been shown to be equivalent20. FAD/(NAD(P)H+FAD) was chosen to define the optical redox ratio because the combined sum of NAD(P)H and FAD in the denominator provides a normalized value between 0 and 120,55. The opposite effect-an increase in optical redox ratio-is expected for cyanide perturbations with optical redox ratios calculated with NAD(P)H in the numerator.
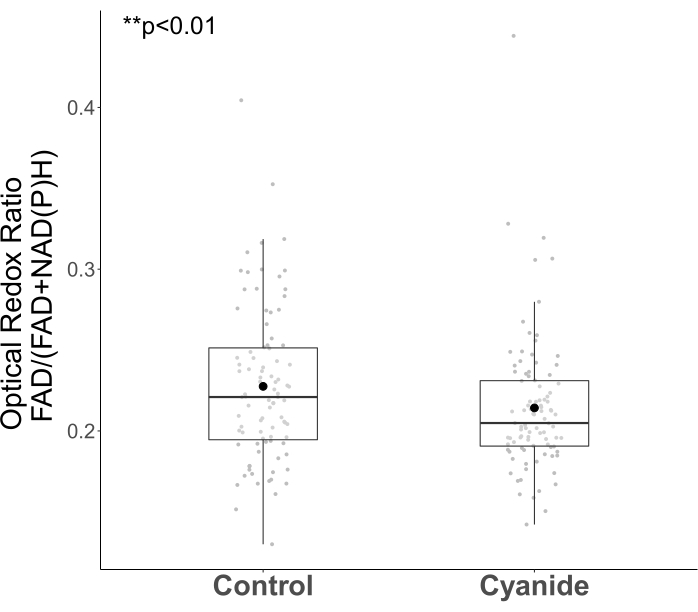
Figure 5: Optical redox ratio of MCF7 cells decrease with cyanide treatment. The boxplots show the median and the first and third quartiles calculated from the cell data. The mean is represented by the black dot symbol, and the median is represented by the black line inside the box. The gray data points overlaid on each boxplot represent the averaged value of all the cytoplasm pixels within each cell. The control group consisted of 91 cells from five different images, and the cyanide group consisted of 95 cells from five different images. p < 0.01, Welch's t-test. Please click here to view a larger version of this figure.
The amplitude-weighted NAD(P)H lifetime (τm) of MCF7 cells decreased with cyanide exposure (Figure 6A, p < 2.2 × 10⁻¹⁶, Welch's t-test). Both the short and long lifetimes decreased for NAD(P)H (Figure 6B,C) but increased for NAD(P)H α1 (Figure 6D). These changes in NAD(P)H fluorescence lifetimes, decrease in τm, increase in α1, and decrease in τ2 matched published values of cyanide perturbations40,56. The decrease in NAD(P)H amplitude-weighted fluorescence lifetime with cyanide exposure indicates increased quenching within the microenvironment of NAD(P)H. An increase in α1 indicates more free NAD(P)H, as expected from the increase of NAD(P)H due to the effects of cyanide on cellular metabolism21.
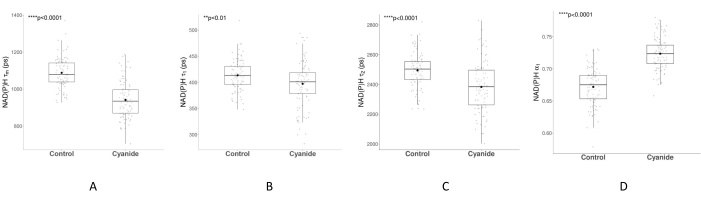
Figure 6: NAD(P)H fluorescence lifetime of MCF7 cells before and after cyanide treatment. The boxplots in panels A–D show the median and the first and third quartiles calculated from the cell-level data. The mean is represented by the black dot symbol, and the median is represented by the black line inside the box. The gray data points overlaid on each boxplot represent the averaged value of all the cytoplasm pixels within a cell. The control group consisted of 91 cells from five different images, and the cyanide group consisted of 95 cells from five different images. (A–D) exhibit the changes in NAD(P)H amplitude-weighted lifetime (τm), NAD(P)H short lifetime (τ1), NAD(P)H long lifetime (τ2), and NAD(P)H-proportional component of the short lifetime (α1) due to cyanide treatment. p-values were calculated using Welch's t-test. Please click here to view a larger version of this figure.
The amplitude-weighted FAD lifetime (τm) of MCF7 cells increased after cyanide exposure (Figure 7A, p = 3.688 × 10⁻¹², Welch's t-test). Both the short and long lifetimes increased for FAD (Figure 7B,C) but decreased for FAD α1 (Figure 7D). Changes in FAD fluorescence lifetimes, an increase in τm and τ2, and a decrease in α1 are consistent with published FAD fluorescence lifetime data of cyanide perturbation57. The change in lifetime values and α1 suggest metabolic changes within the cells, including an increased amount of free FAD21.
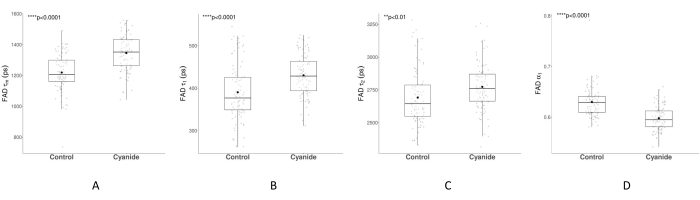
Figure 7: FAD fluorescence lifetime before and after cyanide treatment. The boxplots in A–D show the median, the first and third quartiles, and mean calculated from the cell-level data. The mean is represented by the black dot symbol, and the median is represented by the black line inside the box. The gray data points overlaid on each boxplot represent the averaged value of all the cytoplasm pixels within a cell. The control group consisted of 91 cells from five different images, and the cyanide group consisted of 95 cells from five different images. (A–D) exhibit the changes in FAD amplitude-weighted lifetime (τm), FAD short lifetime (τ1), FAD long lifetime (τ2), and FAD-proportional component of the short lifetime (α1) from cyanide treatment. p-values were calculated using Welch's t-test. Please click here to view a larger version of this figure.
