Detection and Quantification of Tunneling Nanotubes Using 3D Volume View Images
Summary
Tunneling nanotubes (TNTs) are primarily open-ended F-actin membrane nanotubes that connect neighboring cells, facilitating intercellular communication. The notable characteristic that distinguishes TNTs from other cell protrusions is the hovering nature of the nanotubes between cells. Here, we characterize TNTs by constructing a 3D volume view of confocal z-stack images.
Abstract
Recent discoveries have revealed that cells perform direct, long-range, intercellular transfer via nano-scale, actin-membrane conduits, namely "tunneling nanotubes" (TNTs). TNTs are defined as open-ended, lipid bilayer-encircled membrane extensions that mediate continuity between neighboring cells of diameters ranging between 50 nm and 1 µm. TNTs were demonstrated initially in neuronal cells, but successive studies have revealed the existence of TNTs in several cell types and diseases, such as neurodegenerative diseases, viral infections, and cancer. Several studies have referred to close-ended, electrically coupled membrane nanostructures between neighboring cells as TNTs or TNT-like structures.
The elucidation of ultrastructure in terms of membrane continuity at the endpoint is technically challenging. In addition, studies on cell-cell communication are challenging in terms of the characterization of TNTs using conventional methods due to the lack of specific markers. TNTs are primarily defined as F-actin-based, open-ended membrane protrusions. However, one major limitation is that F-actin is present in all types of protrusions, making it challenging to differentiate TNTs from other protrusions. One of the notable characteristics of F-actin-based TNTs is that these structures hover between two cells without touching the substratum. Therefore, distinct F-actin-stained TNTs can conveniently be distinguished from other protrusions such as filopodia and neurites based on their hovering between cells.
We have recently shown that the internalization of oligomeric amyloid-β1-42 (oAβ) via actin-dependent endocytosis stimulates activated p21-activated kinase-1 (PAK1), which mediates the formation of F-actin-containing TNTs coexpressed with phospho-PAK1 between SH-SY5Y neuronal cells. This protocol outlines a 3D volume analysis method to identify and characterize TNTs from the captured z-stack images of F-actin- and phospho-PAK1-immunostained membrane protrusions in oAβ-treated neuronal cells. Further, TNTs are distinguished from developing neurites and neuronal outgrowths based on F-actin- and β-III tubulin-immunostained membrane conduits.
Introduction
Tunneling nanotubes (TNTs) are F-actin-based, primarily open-ended membrane conduits and play a vital role in the intercellular transfer of cargo and organelles1. The unique characteristic of TNTs is that they connect neighboring cells without any contact with the substratum; they are over 10-300 µm in length and their diameters vary between 50 nm to 1 µm2,3. TNTs are transient structures, and their lifetime lasts between a few minutes to several hours. TNTs were first demonstrated in PC12 neuronal cells1; later, numerous studies showed their existence in several cell types in vitro and in vivo4,5. Several studies have revealed the pathological significance of TNTs in various disease models, such as neurodegenerative diseases, cancer, and viral infections6,7,8.
The structural heterogeneities of TNTs have been demonstrated by several studies in various cellular systems9. The differences are based on cytoskeleton composition, the mechanism of formation, and the cargo types transferred10. Primarily, the open-ended, F-actin-positive membrane continuity that hovers between two neighboring cells and transfers organelles is considered to consist of TNTs11. However, the lack of clarity or diversity observed in the formation of TNTs adds to the difficulty in developing TNT-specific markers. Thus, it is difficult to identify TNT structures by conventional detection methods and distinguish membrane nanotubes in terms of open-ended and close-ended protrusions12. However, the characteristic of TNTs to hover as F-actin membrane protrusions between two cells is relatively easier and more feasible to identify using conventional imaging techniques. Other actin-based cellular protrusions such as filopodia and dorsal filopodia cannot hover between two distant cells, particularly when cells are fixed. Of note, close-ended, electrically coupled, developing neurites are often termed TNT-like structures13.
It is known that F-actin plays an important role in TNT formation, and several studies have shown that the F-actin inhibitor cytochalasin D inhibits the formation of TNTs14,15. In contrast, inhibitors of microtubules do not have any effect on TNT formation16. The last 2 decades have seen several reports on the significant role that TNTs play in the spread of pathology and tumor resistance and therapy17. Therefore, there is a never-ending demand for better techniques for TNT characterization.
The lack of specific markers of TNTs and the diversity in morphology and cytoskeletal composition make it difficult to develop a unique method of characterization. Some studies have used automated image detection and TNT quantification techniques18,19. However, there are several advantages of the present 3D volume manual analysis method over automatic image analysis for the detection and quantification of TNTs. Often, trained human eyes can spot these hovering nano-structures more easily than an automated image detection method. Moreover, automatic detection methods could be difficult to implement in laboratories lacking algorithm expertise. The present method could be widely adopted by researchers due to its precision and reproducibility.
In a recent study, we showed that oAβ promotes the biogenesis of TNTs in neuronal cells via a PAK1-mediated, actin-dependent, endocytosis mechanism12. oAβ-induced TNTs also express activated PAK1 (or phospho-PAK1). We developed a 3D volume view image reconstruction method to distinguish oAβ-induced, F-actin- and phospho-PAK1-immunostained TNTs. β-III tubulin-positive, developing neurites often resemble TNT-like hovering structures20. Hence, we further distinguished F-actin-based TNTs from β-III tubulin-positive neurites and other TNT-like protrusions. 3D volume view images have been used to identify TNTs on the basis of their characteristics of hovering over the substratum and staying connected between two neighboring cells. This paper describes the identification and detection of actin-containing membrane conduits or TNTs using confocal z-stack images and, finally, manual quantification of the identified structures from 3D volume view reconstruction images. The presented method cannot distinguish open-ended proper TNTs from close-ended TNT-like structures; this method helps identify TNTs in in vitro 2D cell culture on a flat substratum. However, the method is easy to implement and reproduce and can be widely used for the precise quantification of only actin-based TNTs and to distinguish them from neurites and β-tubulin positive TNT-like structures.
Protocol
NOTE: SH-SY5Y cells cultured in DMEM/F-12 media were differentiated with 10 µM retinoic acid for 7 days and treated with 1 µM oAβ oligomers for 2 h at 37 °C (5% CO2). After treatment, the cells were fixed with Karnovsky's fixative solution and double-immunostained with phospho-PAK1 (Thr423)/PAK2 (Thr402) antibody and F-actin-binding phalloidin. Later, confocal z-stack images were taken using a confocal laser scanning microscope. The TNTs were quantified by manual counting and distinguished from other neurites/cell protrusions by constructing 3D volume view images and identifying the structures from their characteristic of hovering between two cells without touching the substratum (Figure 1).
1. Cell culture and differentiation
- Culture the SH-SY5Y neuronal cells in DMEM/F12 (Ham's) media 1:1 with 10% fetal bovine serum (FBS) and 1% penicillin-streptomycin-neomycin mixture (PSN). Seed the cells in a 35 mm imaging dish with a 14 mm well made up of a #1.5 coverslip at the center of the dish attached to the bottom. Seed the cells on the imaging dish at a concentration of 12,000 cells/cm2 and perform the experiments at 60%-70% confluency.
- Partially differentiate the cells with 10 µM retinoic acid (RA) from a 100 mM stock solution (5 mg of RA in 15 mL of dimethyl sulfoxide [DMSO]). Then, incubate the cells for 7 days at 37 °C (5% CO2) for differentiation with media change every 2 days.
NOTE: Be careful about maintaining the confluency (60%-70%) of the cells (both undifferentiated and partially differentiated cells). Cell density can influence the formation of TNTs between the cells.
2. Preparation of oligomers of amyloid-β1-42 (oAβ) to treat neuronal cells
- Dissolve Aβ1–42 (1 mg) in 200 µL of 1,1,1,3,3,3-hexafluoro-2-propanol and divide the solution into 20 aliquots, each containing 0.05 mg of peptides. Lyophilize and store the aliquots at −20 °C for later use.
- Prepare the stock solution (5 mM) of the lyophilized Aβ1–42 in DMSO by adding 2.2 µL of DMSO to 0.05 mg of lyophilized peptide. To carefully dissolve the peptides, vortex the solution and sonicate for 2 min in a water bath sonicator.
- Dilute the stock solution to a concentration of 100 µM in DMEM, pH 7.4, and vortex to convert the peptides to monomers, followed by incubation at 4 °C for 24 h to obtain oligomers of Aβ1–42 (oAβ)12,21,22.
- Characterize oAβ before the experiments as reported previously21,22 by transmission electron microscopy imaging.
- Treat the partially differentiated SH-SY5Y cells with 1 µM oAβ. Remove the medium before the treatments, and add fresh FBS-free DMEM. After the medium change, add previously prepared oAβ (100 µM) to the medium to a final concentration of 1 µM. Incubate the cells with 1 µM oAβ for 2 h at 37 °C (5% CO2). Include a negative control in the form of untreated cells.
3. Immunostaining of F-actin and activated-PAK1 for the characterization of TNTs
- Perform differential immunostaining by using phospho-PAK1 (Thr423)/PAK2 (Thr402) antibody and F-actin-binding phallotoxin phalloidin.
- Wash the control and oAβ-treated cells with 1x phosphate-buffered saline (PBS) for 2 x 2 min before fixation. Prepare the Karnovsky's fixative solution by using 2% formalin fixative and 2.5% glutaraldehyde dissolved in 0.1 M phosphate buffer, pH 7.2. Then, fix the cells in the imaging dish by adding Karnovsky's fixative solution (just enough to cover the cells) for 45 min at room temperature.
- Wash the fixed cells 2 x 2 min using incubation buffer. Prepare the incubation buffer (20x) by dissolving 0.1 g of saponin in 5 mL of FBS and dilute to 1x by adding 95 mL of 1x PBS.
- After fixation, add the first antibody against phopho-PAK1 at a dilution of 1:250 in the incubation buffer and incubate overnight at 4 °C in a dark moist chamber.
- The next day, after 24 h of incubation, wash the cells 2 x 2 min with the incubation buffer; then, add secondary antibody conjugated to Alexa Fluor 488 (1:1,000 dilution) and Phalloidin 555 (1:1,000 dilution). Incubate the cells in the dark moist chamber for 1.5 h at room temperature.
- After the incubation, wash the cells 2 x 2 min with incubation buffer. Stain the nucleus by adding 4',6-diamidino-2-phenylindole (DAPI) in a 1:2,000 dilution and incubate for 5 min to 10 min at room temperature in the dark.
- Prepare DABCO mounting medium using 25 mg of DABCO in 90% glycerol and 10% 1x PBS. To dissolve properly, adjust the pH to 8.6 using spectrophotometric grade, dilute HCl (diluted 1:20 with water) and keep the solution on a rocker for mixing.
- As an anti-bleaching agent, add the DABCO mounting medium directly onto the imaging dish containing the coverslip at the bottom. Wait for at least 1-2 h and directly proceed to perform confocal imaging.
NOTE: No adhesives are required to fix the coverslips.
4. Immunostaining of F-actin and β-III tubulin to distinguish TNTs from neurites
- Perform differential immunostaining with β-III tubulin antibody and F-actin-binding phallotoxin phalloidin.
- Wash the oAβ-treated cells 2x with 1x PBS before adding Karnovsky's fixative solution. Incubate the cells for 45 min at room temperature and wash the cells 2 x 2 min with incubation buffer.
- After fixation, add the antibody against β-III tubulin (TUBb3) at a dilution of 1:250 in the incubation buffer and incubate at 4 °C overnight in the dark moist chamber.
- The next day, wash the cells with incubation buffer (2 x 2 min), and add secondary antibody conjugated to Alexa Fluor 488 (1:1,000 dilution) and Phalloidin 555 (1:1,000 dilution) together to the same dish. Then, incubate the cells for 1.5 h at room temperature in the dark moist chamber.
- Wash the cells 2x with incubation buffer, and add nuclear-staining DAPI in a 1:2,000 dilution for 5-10 min at room temperature in the dark.
- Add anti-bleaching agent DABCO in mounting medium as mentioned above and wait for 2 h before imaging.
5. Imaging with confocal microscopy
- To identify TNTs, capture z-stack images of immunostained cells using a confocal laser scanning microscope. Take the images using 40x/1.40 Oil DIC objective with DAPI, fluorescein isothiocyanate (FITC), and tetramethylrhodamine (TRITC) filter sets.
- First, select the channels by clicking the required lasers sequentially in the windows Track 1, Track 2, and Track 3 in the confocal software. Click the option T-PMT below the Track 1 window to take the differential interference contrast (DIC) images with fluorescence channels.
NOTE: DIC images are captured by a different detector labeled as T-PMT. - Select the acquisition tab of the software, click on the Z-stack tab, and wait for a window to open. Then, click live scan to focus the cells at the bottom of the dish. Select that focused image as the first stack. Then, focus up to see the topmost part of the cell and select that as the last stack. Stop live scanning and click the number next to the optimal tab to fix the step size of the stacks. Step size determines the number of slices and the intervals based on the thickness of the cells.
NOTE: Step size will be selected based on Nyquist sampling to take enough slices and ensure there are no gaps between the two stacks. Nyquist sampling is determined on the basis of the objective and the wavelengths of the lights23. - Take sequential images of three channels of DAPI, FITC, and TRITC with 405 nm, 488 nm, and 561 nm lasers and capture with a pixel dwell time of 1.02 µs. Capture images in the DIC channel with fluorescence channels to observe the cell boundary.
- Capture a stack of images with the dimensions of x: 224.92 µm and y: 224.92 µm, with each pixel of 220 nm2 size and z-scaling of 415 nm.
- Take images capturing several z-stacks (15-22 stacks) from the bottom to the top of the cells. Acquire at least 10 images from the random field of the culture dish to get a total of ~200-300 cells.
- Analyze the captured images offline to identify the TNTs by 3D volume view analysis
6. Analysis of confocal z-stack images to identify and quantify TNTs
- Open the confocal images saved in .czi data format in Fiji software for analysis.
- Select the Hyperstack option to see each z-stack and channel of the image. Look for the hyperstacks of the z-stacks and channels, which open in a single window as shown in Figure 2. Scroll the channel (indicated by red and green arrows) and z-stack (indicated by blue arrows) scroll bars to select the exact stack of a particular channel of interest.
NOTE: In fixed cells, as the hovering TNTs or membrane conduits stay above the surface, the structures are not visible in the lower parts of the z-stacks. However, in fixed cells, neurites lie on the surface and are detectable in the lower parts of the z-stacks (z = 0 to 2). See Figure 2 for the identification steps. - As shown in Figure 2, select the F-actin-stained channel (indicated by red arrows) first by scrolling the channel bar. Then, manually scroll the z-stacks (indicated by blue arrows) to see each stack one by one. Identify the F-actin-stained structures that seem to be connecting cells, are visible in the lower parts of the z-stacks, and are close to the surface of the imaging dish (z = 2) as neurites (indicated by white arrows).
NOTE: The majority of the neurites are easy to identify as they appear as extended protrusions (indicated by pink arrows). - Identify the TNTs, the F-actin-positive, hovering cell-to-cell conduits, by scrolling the z-stacks toward the top (from z = 4 de Figure 2; indicated by yellow arrows). Look for neurites near the lower parts of the z-stacks toward the surface and observe that they start disappearing with the scrolling of z-stacks toward the top (at z = 6 de Figure 2; neurites are not clearly visible).
- Identify phospho-PAK1-positive TNTs similarly as F-actin-positive TNTs by analyzing the hovering nature of the conduits from the z-stacks. As phospho-PAK1 staining is weaker than F-actin staining, look for phopho-PAK1-stained TNTs at z = 4 (faintly visible)and at z = 6 (prominent).
- Further, observe the DIC images to verify that the F-actin- and phospho-PAK1-stained TNT structures are membrane conduits between cells (Figure 3). In addition, merge F-actin (red) and phospho-PAK1 (green) channels to verify that the identified TNTs are F-actin and phospho-PAK1 co-stained structures (Figure 3).
- To quantify the TNTs, count the total cell numbers and the identified TNTs manually and represent the numbers as percentages.
- To distinguish F-actin-positive TNTs and β-III tubulin (TUBb3)-positive, TNT-like hovering conduits from z-stack images, merge F-actin (red) and TUBb3 (green) channels (Figure 4). Then, analyze the z-stacks of the merged images.
- Look for exclusively F-actin-stained TNTs that are faintly visible at z = 3 and prominent at z = 6 and z = 9 (yellow arrows). Similarly, identify F-actin and β-III tubulin (TUBb3) double-positive, TNT-like hovering conduits at z = 6 and z = 9 (cyan arrows). Identify other F-actin- and β-III tubulin-stained, non-hovering protrusions from the lower parts of the z-stacks (white arrows).
- Measure the diameter of the TNTs using the line tool in Fiji. Verify the scale of measurement by clicking Analyze | Set Scale so that "distance in pixels" is set automatically from the .czi images. Measure the diameters of the TNTs at the xy-plane.
NOTE: Most of the diameters are between 1 pixel and 4 pixels (i.e., 220-880 nm); each pixel is 220 nm. See Figure 5 for a summary of the protocol for the analysis of z-stack confocal images.
7. 3D reconstruction of z-stack images to characterize TNTs
- Use the volume viewer plugin in Fiji, which allows 3D reslicing and threshold-enabled 3D visualization (Figure 6).
- Split the z-stack images into individual channels. Then, crop the single-channel (F-actin channel) z-stack images to use 3D reconstruction view to highlight one or two TNTs or neurites at a time. Enable the volume view plugin to visualize xy, yz, and xz views.
- Pin a single TNT or neurite in the xy plane (white arrows represent neurites in Figure 6A; yellow arrows represent TNTs in Figure 6B) and mark xz (red) and yz (green) axis cross-sections. Observe the neurites at the bottom of the xz plane in the xz and yz planes (white arrows, Figure 6A) and the TNTs in the upper z-stacks (yellow arrows, Figure 6B).
- Select the individual TNT or neurite to reconstruct the 3D volume view in the xz-plane (Figure 6C, D). In the 3D reconstruction, observe the neurites at the bottom of the z-plane (white arrows, Figure 6C) and the TNTs appearing as hovering structures connecting two cells without touching the bottom z-plane (yellow arrows, Figure 6D).
Representative Results
Here, we identify and characterize oAβ-induced TNTs in SH-SY5Y neuronal cells by constructing 3D volume views from confocal z-stack images (Figure 1). The cells were double-immunostained with F-actin and phospho-PAK1. Confocal z-stack images of immunostained cells were analyzed to identify TNTs (Figure 2). Further, DIC images were analyzed to verify that the F-actin- and phospho-PAK1-stained TNT structures were membrane conduits between cells (Figure 3). Further, the cells were double-immunostained with F-actin and β-III tubulin (Figure 4). The TNT-like F-actin and β-III tubulin double-positive membrane conduits were distinguished from only F-actin-positive TNTs (Figure 4). The TNTs coexpressed with phospho-PAK1 (or activated PAK1) and F-actin were distinguished from other neurites/cell protrusions by constructing 3D volume view images based on their characteristic of hovering between two cells without touching the substratum (Figure 6). The identified TNTs were manually spotted, and the percentage of TNTs was calculated precisely from the 3D volume view images. The diameter and the length of the TNTs were also determined by analyzing the individually identified TNTs.
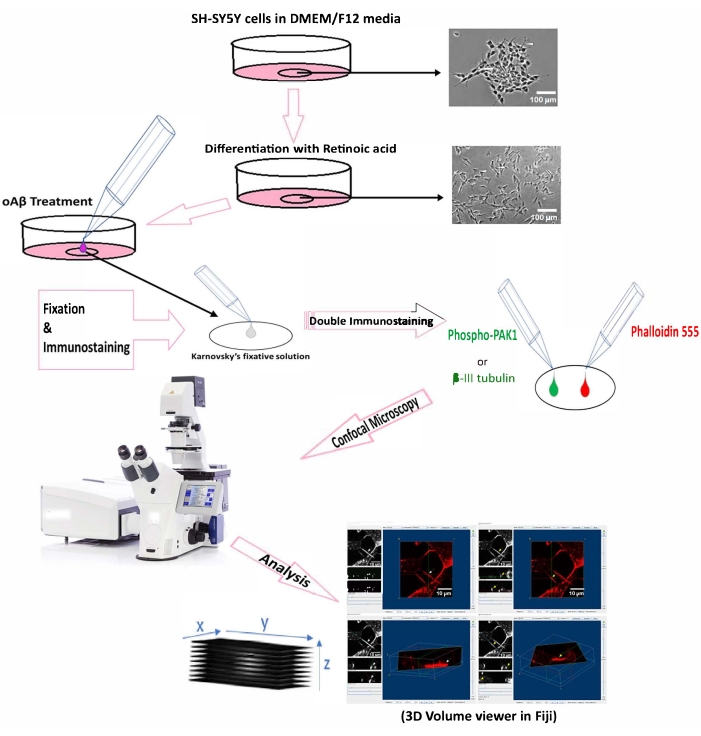
Figure 1: Schematic diagram representing the protocol summary of the detection method of TNTs. Scale bar = 100 µm for microscopy images (top); 10 µm (3D volume views). Abbreviations: oAβ = oligomeric amyloid-β1-42; PAK1 = p21-activated kinase-1. Please click here to view a larger version of this figure.
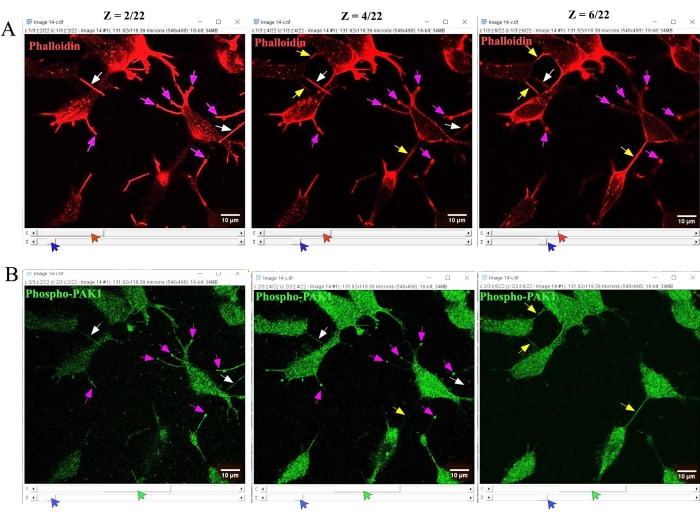
Figure 2: Analysis of confocal z-stack images to identify and quantify TNTs. Confocal z-stack images were analyzed in Fiji software. Hyperstacks of z-stacks and channels opened in a single window showing (A) F-actin and (B) phospho-PAK1. By scrolling the channel (indicated by red and green arrows) and z-stack (indicated by blue arrows) scroll bars, the individual stacks of a particular channel of interest were analyzed. (A) The F-actin-stained structures connecting cells, visible in the lower parts of the z-stacks, and considered to be close to the surface of the image dish (z = 2) were identified as neurites (indicated by white arrows). In contrast, hovering cell-to-cell-connected conduits visible at higher parts of the z-stacks were identified as TNTs (indicated by yellow arrows). (B) Similarly, phospho-PAK1-stained neurites and TNTs were identified. Other F-actin-positive short protrusions that are not connected to neighboring cells are indicated by pink arrows. Scale bars = 10 µm. Abbreviations: TNT = tunneling nanotubes; PAK1 = p21-activated kinase-1. Please click here to view a larger version of this figure.
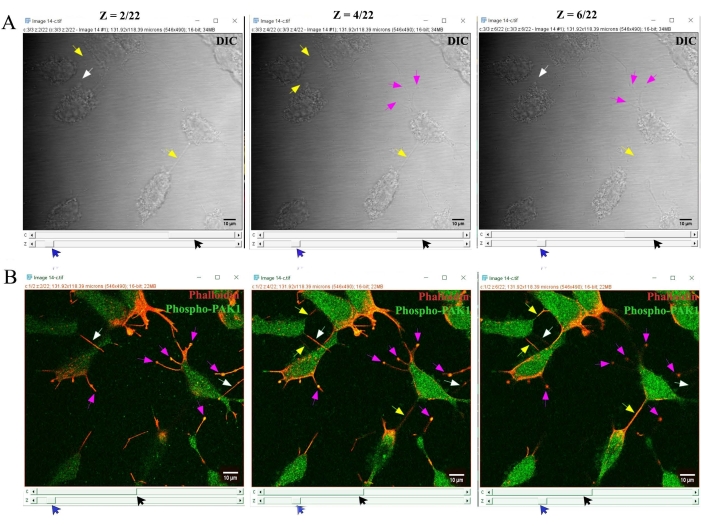
Figure 3: Analysis of DIC images to confirm TNTs. (A) DIC images were observed to verify that the F-actin- and phospho-PAK1-stained TNTs and neurite protrusions were indeed membrane conduits. (B) In addition, F-actin (red) and phospho-PAK1 (green) channels were merged to verify that the identified, oAβ-induced TNTs were F-actin and phospho-PAK1 co-stained structures. Scale bars = 10 µm. Abbreviations: TNT = tunneling nanotubes; DIC = differential interference contrast; PAK1 = p21-activated kinase-1. Please click here to view a larger version of this figure.
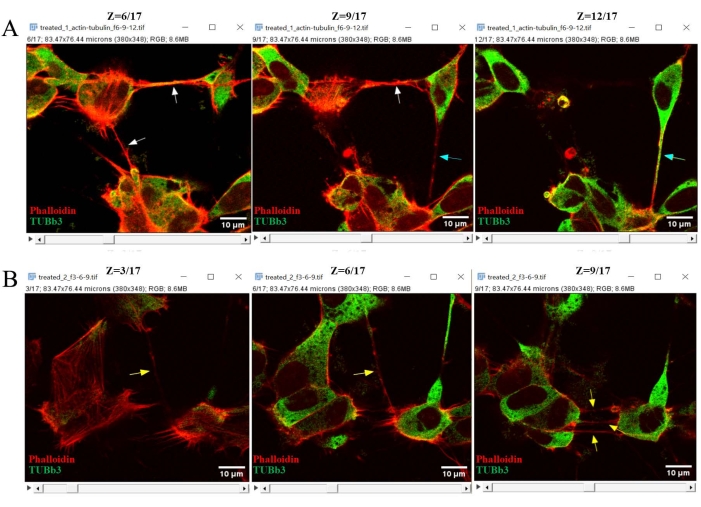
Figure 4: Confocal z-stack images analyzed using Fiji software to distinguish only F-actin-stained TNTs from β-III tubulin and F-actin double-stained, TNT-like hovering conduits. First, the F-actin (red) and TUBb3 (green) channels of the hyperstacks were merged. Then, the merged images were opened in a single window. By scrolling the z-stack scroll bars, F-actin-stained TNTs were exclusively identified; these were faintly visible at z = 3 and prominent at z = 6 and z = 9 (yellow arrows, B). Similarly, F-actin and TUBb3 double-positive, TNT-like hovering conduits were detectable at z = 6 and z = 9 (cyan arrows, A). Other F-actin- and β-III tubulin-stained, non-hovering protrusions were identified from the lower parts of the z-stacks (white arrows). Scale bars = 10 µm. Abbreviations: TNTs = tunneling nanotubes; TUBb3 = β-III tubulin. Please click here to view a larger version of this figure.
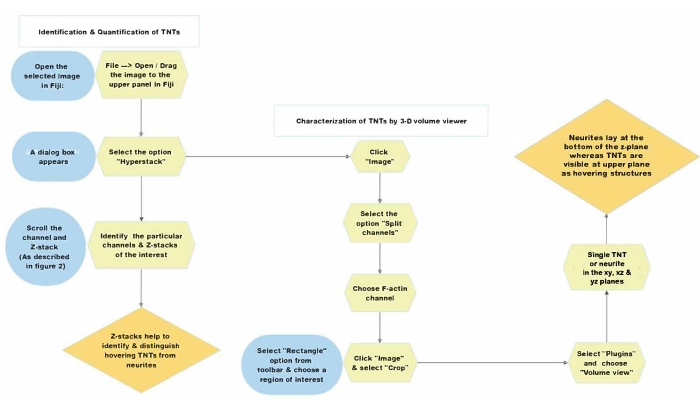
Figure 5: Schematic summary representing the detailed protocol for the analysis of z-stack confocal images. Abbreviation: TNTs = tunneling nanotubes. Please click here to view a larger version of this figure.
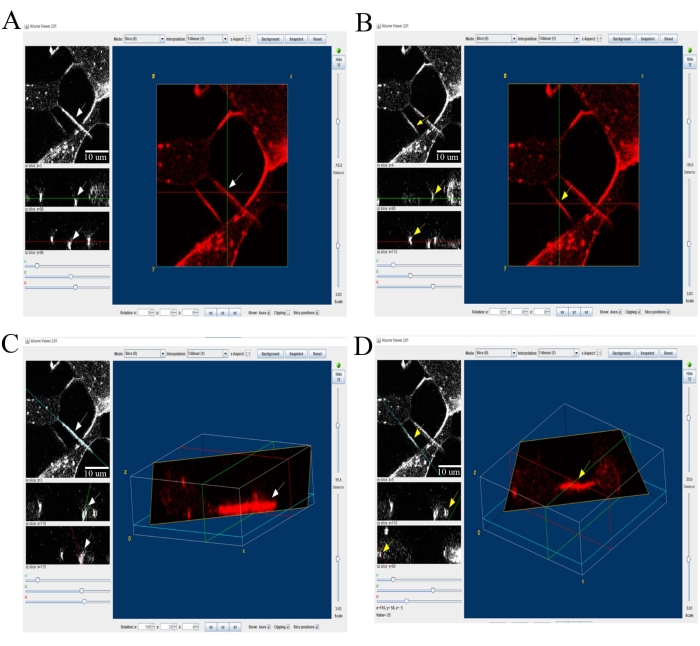
Figure 6: 3D reconstruction view to highlight one or two TNTs or neurites at a time. The "volume view" plugin in Fiji is used to visualize xy, yz, and xz views. The 3D reconstruction shows neurite lying at the bottom of the z-plane (white arrows in the panels A and C), while TNTs appear as hovering structures that connect two cells without touching the bottom z-plane (yellow arrow in the panels B and D). Scale bars = 10 µm. Abbreviation: TNTs = tunneling nanotubes. Please click here to view a larger version of this figure.
Discussion
Several researchers in the past 2 decades have been trying to understand and characterize the structure of TNTs18. The lack of specific markers hinders progress, and there is an increasing demand for a convenient, standardized method that can be used to identify, characterize, and quantify TNTs. TNTs are defined as F-actin-based membrane conduits that hover between two cells. Studies have shown that β-tubulin-positive, close-ended, developing neurites hover between two distant cells and resemble TNT-like structures12,13. Therefore, TNTs are identified and distinguished from neurites and other TNT-like structures based on their positivity for only actin and for being membrane conduits that hover between two distant cells. Researchers often find it challenging to obtain intact TNT structures during fixation before imaging24. To overcome this problem, we used a modified fixative solution with 2.5% glutaraldehyde (Karnovsky’s fixative) to fix the SH-SY5Y neuronal cells used in this protocol25.
A critical step of every immunohistochemistry/immunocytochemistry experiment is the fixation of the sample, which relies on the selection of the appropriate fixative agent. Imperfect fixation of the sample may lead to rapid proteolytic degradation of the target proteins and a reduction in the specific immunoreactivity. Overfixation causes masking of the epitope and uncertainty in specific labeling caused by the non-specific background. Method, timing or duration, temperature, and pH also influence the proper fixation of the cells26.
Paraformaldehyde is extensively used as a fixative agent in the immunostaining of cells. The disadvantages of using paraformaldehyde as a fixative agent include the loss of antigenicity and changes in morphology. Glutaraldehyde has a lower osmotic pressure, is more stable in solution, and crosslinks easily, thus giving better results27. A combination of formaldehyde-glutaraldehyde (in phosphate buffer) fixative results in exceptional fixation of a wide range of tissue/cell samples. This combination enables rapid stabilization of the cell’s ultrastructure by formaldehyde, followed by a permanent fixation by the slower penetrating action of glutaraldehyde28.
TNTs that are positive for F-actin and phospho-PAK1 are distinguished from neurites based on their characteristic of hovering between two cells in in vitro 2D cell culture on a flat substratum. The identified TNTs were manually spotted with 3D volume view analysis, and the percentages of TNTs formed were calculated by manual counting. The manual method makes the quantification of large amounts of data difficult since it requires immense manpower19. However, trained eyes can spot TNTs efficiently and distinguish them from neurites with better precision than automatic detection methods. The existing automatic detection methods are also difficult to implement in every laboratory without the available expertise to develop an algorithm and/or change the existing algorithm as required for the experimental setup. The manual 3D volume view analysis method makes it easier to identify the membrane structures lying between cells in the lower parts of the z-stacks and those hovering in the middle and higher parts of the z-stacks to clearly distinguish between neurites and TNTs.
TNTs can be distinguished from other membrane protrusions such as neurites or tumor microtubes. However, it is difficult to distinguish between open-ended and close-ended, nano-size, diameter-membrane tubes, which raises the following question: are they TNTs or TNT-like structures? Since the last decade, a huge amount of data has been accumulated to show the inevitable role of TNTs in the spread of pathology, cancer resistance, and therapy17. Therefore, researchers are looking for the development of specific makers that will change the field of direct, long-distance intercellular communication. Until then, reproducible imaging methods of characterization are in high demand to pave the way for continuous progress in the field.
Divulgations
The authors have nothing to disclose.
Acknowledgements
D.K.V and A.R thank the Manipal Academy of Higher Education for the TMA Pai fellowship. We thank the Science and Engineering Research Board of India for SERB-SRG (#SRG/2021/001315), as well as the Indian Council of Medical Research of India (#5/4-5/Ad-hoc/Neuro/216/2020-NCD-I) and the Intramural fund of Manipal Academy of Higher Education, Manipal, India. We thank JNCASR's (Jawaharlal Nehru Centre for Advanced Scientific Research, India) confocal facility and B. Suma for the confocal microscopy in JNCASR.
Materials
| 35 mm dish with 14 mm well size made of #1.5 cover slip | Cellvis | D35-14-1.5-N | Imaging dish used to seed cells for staining experiments |
| Aβ (1-42) 1 mg | AnaSpec | #64129 | Oligomers of amyloid beta to treat the cells |
| Alexa flour 488 Goat Anti-rabbit IgG (H+L) | Invitrogen | A11070 | Secondary antibody for phospho-PAK1 |
| Biological Safety Cabinet | Thermo Scientific (MSC Advantage) | 51025411 | Provide aspetic conditions duirng cell culture |
| CO2 Incubator | Thermo Electron Corporation (Heraeus Hera Cell 240) | 51026556 | For growing cells at or near body temperature |
| Confocal Laser Scanning Microscope | ZEISS (Carl Zeiss) | LSM 880 | Able to generate three-dimensional images of large specimen at super-resolution |
| DABCO [1,4-Diazobicyclo-(2,2,2) octane] | Merck | 8034560100 | Anti-bleaching reagent |
| DAPI (4′,6-diamidino-2-phenylindole) | Sigma | D9542-1MG | Neuclear stainer |
| DMEM media | Gibco | 11965092 | Used for the preparation of 100uM of Aβ (1-42) |
| DMEM/F12 (1:1 mixture of DMEM and Ham’s F12) | Gibco | 12500062 | Culture media for SH-SY5Y |
| DMSO (Dimethyl sulphide) Cell culture grade | Cryopur | CP-100 | Cell culture grade used as dissolving agent for Retinoic acid |
| DMSO (Dimethyl sulphide) Molecular grade | Himedia | MB058 | Used as one of the dissolving agent for the lyophilized Aβ (1-42) |
| Fetal Bovine Serum | Gibco | 16000044 | Major supplement for Culture media (US origin) |
| Formalin Fixative (Neutral buffered 10%) | Sigma Aldrich | HT5014-120ML | Component in the Karnovsky's fixative solution |
| Glutaraldehyde (Grade I, 25% in H2O) | Sigma | G5882 | Component in the Karnovsky's fixative solution |
| HFIP (1,1,1,3,3,3-hexafluoro-2-propanol ) solution | TCI | H024 | Used to dissolve Aβ (1-42) 1 mg |
| Image Processing/ Analysis Software: FIJI (ImageJ) | National Institute of Health (NIH) | Used to process/analyze the images and to differentiate the TNTs from neurites using its plugin named "volume viewer". | |
| Lyophilizer | Christ, Alpha | 2.4 LDplus | 0.05 mg aliquots of Aβ (1-42) can be stored in -20 °C after lyophilization only |
| Penicillin-Streptomycin-Neomycin Mixture | Thermo fisher Scientific | 15640055 | Antibiotic mixture |
| Phalloidin-iFlor 555 | Abcam | ab176756 | F-actin binding stain |
| Phospho-PAK1 (Thr423) /PAK2 (Thr402) [Rabbit] | CST | #2601 | Primary antibody |
| Polyclonal Antibody to Tubulin Beta 3 (TUBb3) | Cloud clone | PAE711Hu01 | Primary antibody |
| Retinoic acid | Sigma-Aldrich | R2625-50MG | Differentiating reagent |
| Saponin | Merck | 8047-15-2 | Detergent used in the Incubation buffer in immunostaining |
| Water bath sonicator (Quart, Drain valve Heater) | Ultrasonic Cleaner | 3.0 L/3.2 | Sonicator used to dissolve Aβ (1-42) stock, after DMSO adding to it during the preparation of 100 µM Aβ (1-42) |
| ZEN Microscopy software | ZEISS (Carl Zeiss) | Imaging software to acquire confocal microscopy images with smart automation |
References
- Rustom, A., Saffrich, R., Markovic, I., Walther, P., Gerdes, H. H. Nanotubular highways for intercellular organelle transport. Science. 303 (5660), 1007-1010 (2004).
- Desir, S., et al. Chemotherapy-induced tunneling nanotubes mediate intercellular drug efflux in pancreatic cancer. Scientific Reports. 8, 9484 (2018).
- Cordero Cervantes, D., Zurzolo, C. Peering into tunneling nanotubes-The path forward. The EMBO Journal. 40 (8), 105789 (2021).
- Dieriks, B. V., et al. α-synuclein transfer through tunneling nanotubes occurs in SH-SY5Y cells and primary brain pericytes from Parkinson’s disease patients. Scientific Reports. 7, 42984 (2017).
- Chen, J., Cao, J. Astrocyte-to-neuron transportation of enhanced green fluorescent protein in cerebral cortex requires F-actin dependent tunneling nanotubes. Scientific Reports. 11, 16798 (2021).
- Mittal, R., et al. Cell communication by tunneling nanotubes: Implications in disease and therapeutic applications. Journal of Cellular Physiology. 234 (2), 1130-1146 (2019).
- Polak, R., de Rooij, B., Pieters, R., den Boer, M. L. B-cell precursor acute lymphoblastic leukemia cells use tunneling nanotubes to orchestrate their microenvironment. Blood. 126 (21), 2404-2414 (2015).
- Panasiuk, M., Rychlowski, M., Derewonko, N., Bienkowska-Szewczyk, K. Tunneling nanotubes as a novel route of cell-to-cell spread of herpesviruses. Journal of Virology. 92 (10), 00090 (2018).
- Austefjord, M. W., Gerdes, H. H., Wang, X. Tunneling nanotubes: Diversity in morphology and structure. Communicative & Integrative Biology. 7 (1), 27934 (2014).
- Han, X., Wang, X. Opportunities and challenges in tunneling nanotubes research: How far from clinical application. International Journal of Molecular Sciences. 22 (5), 2306 (2021).
- Zurzolo, C. Tunneling nanotubes: Reshaping connectivity. Current Opinion in Cell Biology. 71, 139-147 (2021).
- Dilna, A., et al. Amyloid-beta induced membrane damage instigates tunneling nanotube-like conduits by p21-activated kinase dependent actin remodulation. Biochimica et Biophysica Acta (BBA)- Molecular Basis of Disease. 1867 (12), 166246 (2021).
- Chang, M., et al. Formation of cellular close-ended tunneling nanotubes through mechanical deformation. Science Advances. 8 (13), (2022).
- Bukoreshtliev, N. V., et al. Selective block of tunneling nanotube (TNT) formation inhibits intercellular organelle transfer between PC12 cells. FEBS Letters. 583 (9), 1481-1488 (2009).
- Zhang, J., et al. Direct observation of tunneling nanotubes within human mesenchymal stem cell spheroids. The Journal of Physical Chemistry B. 122 (43), 9920-9926 (2018).
- Hanna, S. J., et al. The role of Rho-GTPases and actin polymerization during Macrophage Tunneling Nanotube Biogenesis. Scientific Reports. 7, 8547 (2017).
- Raghavan, A., Rao, P., Neuzil, J., Pountney, D. L., Nath, S. Oxidative stress and Rho GTPases in the biogenesis of tunnelling nanotubes: Implications in disease and therapy. Cellular and Molecular Life Sciences. 79, 36 (2021).
- Abounit, S., Delage, E., Zurzolo, C. Identification and characterization of tunneling nanotubes for intercellular trafficking. Current Protocols in Cell Biology. 67, 11-21 (2015).
- Hodneland, E., et al. Automated detection of tunneling nanotubes in 3D images. Cytometry A. 69 (9), 961-972 (2006).
- Wang, X., Bukoreshtliev, N. V., Gerdes, H. H. Developing neurons form transient nanotubes facilitating electrical coupling and calcium signaling with distant astrocytes. PLoS One. 7 (10), 47429 (2012).
- Nath, S., et al. Spreading of neurodegenerative pathology via neuron-to-neuron transmission of beta-amyloid. Journal of Neuroscience. 32 (26), 8767-8777 (2012).
- Domert, J., et al. Spreading of amyloid-beta peptides via neuritic cell-to-cell transfer is dependent on insufficient cellular clearance. Neurobiology of Disease. 65, 82-92 (2014).
- Pawley, J. B., Pawley, J. B. Points, Pixels, and Gray Levels: Digitizing Image Data. Handbook Of Biological Confocal Microscopy. , 59-79 (2006).
- Pontes, B., et al. Structure and elastic properties of tunneling nanotubes. European Biophysics Journal. 37 (2), 121-129 (2008).
- Haimovich, G., Gerst, J. E. Detection of mRNA transfer between mammalian cells in coculture by single-molecule fluorescent in situ hybridization (smFISH). Methods in Molecular Biology. 2038, 109-129 (2019).
- Janardhan, K. S., Jensen, H., Clayton, N. P., Herbert, R. A. Immunohistochemistry in investigative and toxicologic pathology. Toxicologic Pathology. 46 (5), 488-510 (2018).
- Qin, Y., et al. The combination of paraformaldehyde and glutaraldehyde is a potential fixative for mitochondria. Biomolecules. 11 (5), 711 (2021).
- Graham, R. C., Karnovsky, M. J. The histochemical demonstration of monoamine oxidase activity by coupled peroxidatic oxidation. Journal of Histochemistry & Cytochemistry. 13 (7), 604-605 (1965).
