We present a standardized protocol for the quantification of T2* relaxation times of tumors using external software. Multi-echo gradient echo images are acquired and fed into the software to create tumor T2* maps and measure tumor T2* relaxation times.
T2* relaxometry is one of the established methods to measure the effect of superparamagnetic iron oxide nanoparticles on tumor tissues with magnetic resonance imaging (MRI). Iron oxide nanoparticles shorten the T1, T2, and T2* relaxation times of tumors. While the T1 effect is variable based on the size and composition of the nanoparticles, the T2 and T2* effects are usually predominant, and T2* measurements are the most time-efficient in a clinical context. Here, we present our approach to measuring tumor T2* relaxation times, using multi-echo gradient echo sequences, external software, and a standardized protocol for creating a T2* map with scanner-independent software. This facilitates the comparison of imaging data from different clinical scanners, different vendors, and co-clinical research work (i.e., tumor T2* data obtained in mouse models and patients). Once the software is installed, the T2 Fit Map plugin needs to be installed from the plugin manager. This protocol provides step-by-step procedural details, from importing the multi-echo gradient echo sequences into the software, to creating color-coded T2* maps and measuring tumor T2* relaxation times. The protocol can be applied to solid tumors in any body part and has been validated based on preclinical imaging data and clinical data in patients. This could facilitate tumor T2* measurements for multi-center clinical trials and improve the standardization and reproducibility of tumor T2* measurements in co-clinical and multi-center data analyses.
Noninvasive quantification of tumor T2* relaxation times in various tissues of the body with magnetic resonance imaging (MRI) is widely established1. The rationale for this article is to provide a protocol for the measurement of tumor T2* relaxation times which is independent of scanner software like Osirix2. This will allow uniform analyses of imaging data from different centers, different scanners, and different vendors. Indeed, thousands of users could potentially use the same approach, thereby increasing the standardization of tumor T2* measurements. T2* measurements are used for different purposes by neuroradiologists, cardiac imaging experts, and abdominal imaging experts, among others. MRI pulse sequences for measurements of tissue T2* relaxation times have been applied and optimized for the assessment of intracranial bleeds3, hepatic iron content1,4, and cardiac iron content5,6, among others. Other investigators have used T2* measurements to generate quantitative estimates of iron oxide nanoparticle accumulations in malignant tumors7,8. However, many of these previous approaches utilized institutional software or specific scanner software, which would be limited to use at a specific institution or for processing data obtained on a specific scanner. Here, we describe a universally applicable approach for generating tumor T2* maps and tumor T2* relaxation times based on preclinical or clinical MRI data from any scanner that can generate multi-echo gradient echo images. The required gradient echo sequence should have very short first echo times and close inter-echo spacing9,10. The multi-echo gradient echo images are then fed into the external software, tumor T2* maps are calculated, and tumor T2* relaxation times are measured. The T2 Fit Map plugin in the external models' T2* decay curves as a monoexponential fit to S(t) = Soe-t/T2* 11 where S(t) represents the signal or process value at a given time t; S0 is the initial value of the signal or process at t = 0; t denotes time; T2*, also known as the apparent transverse relaxation time, characterizes the decay rate of the signal or process; and e is the base of the natural logarithm (approximately equal to 2.71828). The equation describes an exponential decay, where the signal or process decreases over time as a function of the decay rate T2*. The larger the value of T2*, the slower the decay rate, and vice versa. The same software can also be used to input multi-echo spin echo images and generate tumor T2 values by fitting the T2 decay curve to S(t) = Soe-t/T2. The curve fitting was performed using external software, without incorporating a constant offset. Both decay curves exhibit single exponential behavior, with T2* demonstrating a shorter duration compared to T2.
In patients with hemosiderosis and hemochromatosis, the quantification of liver iron content by tissue biopsy is the gold standard, whereas noninvasive MR imaging is the point of care for establishing baseline values and monitoring changes over time noninvasively12,13. While generating T2* maps for liver iron quantification is well established4, there is no standardized protocol to measure tumor T2* relaxation times. While T2* maps can also be generated by scanner software, it is limited to a specific scanner and vendor. In the field of oncology, serial imaging studies of a given patient often occur on different scanners, and multicenter MRI data are acquired based on imaging studies from different scanners and different vendors. In addition, co-clinical imaging research is being increasingly implemented and requires the comparison of MRI data of patients and mouse models that simulate their tumor. The purpose of this protocol is to provide a protocol for the measurement of tumor T2* relaxation times that are independent of the scanner software. This will allow uniform analysis of imaging data from different centers and different scanners. Indeed, thousands of users could potentially use the same approach, thereby increasing the standardization and reproducibility of tumor T2* measurements. Our protocol utilizes external software, which can be downloaded from the internet. Multi-echo gradient echo images are fed into the software and fit to a formula for monoexponential decay to generate a T2* map, on which tumor T2* relaxation times can be measured using operator-defined regions of interest (ROIs)5. Iron oxide nanoparticles can be infused at different doses14, In our study, the patient received a Ferumoxytol injection (30 mg/mL) containing 510 mg of elemental iron in a 17 mL volume, at a dosage of 5 mg elemental iron per kg body weight. Subsequently multi-echo gradient echo sequences were obtained15 using set sequence parameters for data acquisition.
This protocol has been generated for a prospective clinical trial and co-clinical research. The study was compliant with the Health Insurance Portability and Accountability Act (HIPAA) and approved by the Stanford University institutional review board (IRB). All patients or their legally authorized representative signed a written informed consent, and all children between 7 and 18 years of age signed an assent form.
1. Installing and starting the T2 Fit Map plugin
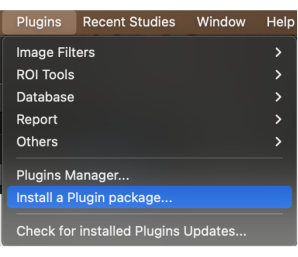
Figure 1: Selecting 'Install a plugin package' from the drop-down menu. Please click here to view a larger version of this figure.
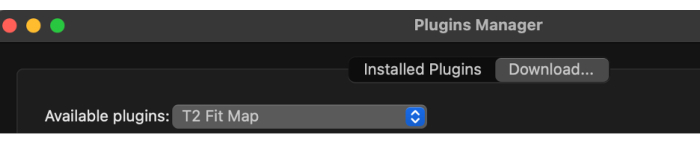
Figure 2: Selecting 'T2 Fit Map' from the available plugins. Please click here to view a larger version of this figure.
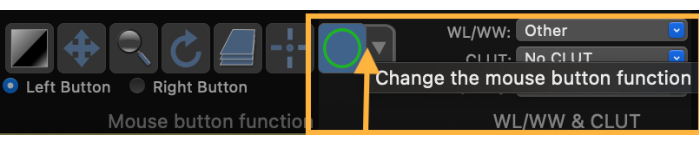
Figure 3: Screenshot demonstrating how to change the mouse button function to draw a region of interest (ROI). Please click here to view a larger version of this figure.
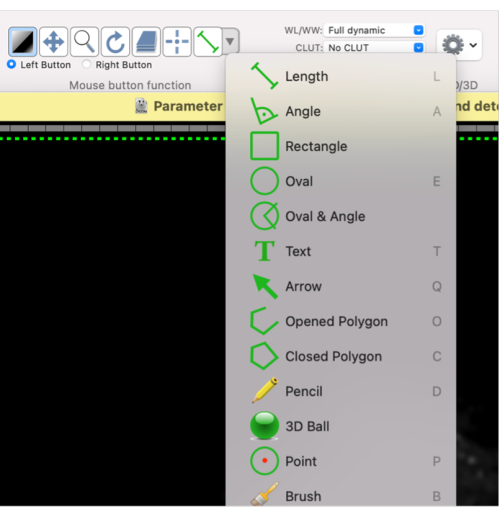
Figure 4: Screenshot showing how to select different shapes for the ROI. Please click here to view a larger version of this figure.
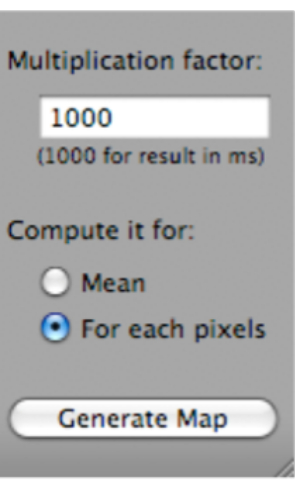
Figure 5: Screenshot showing how to select 'Generate Map' after selecting 'T2 Fit Map'. Please click here to view a larger version of this figure.
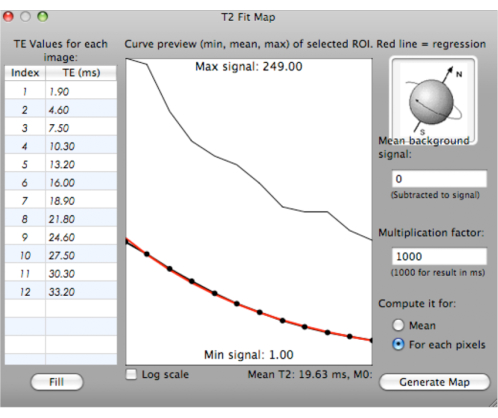
Figure 6: Screenshot showing the generation of a fitting curve for T2* values. Please click here to view a larger version of this figure.
2. Exclusion of noise using the definition of mask
NOTE: To define a mask on the first echo of the T2map_MSME data used to calculate the parametric maps, set a lower first-echo signal threshold for T2* value calculation (the T2* map volume will now exclude the pixels with signals too low for accurate calculation at the first multi-spin multi-echo (MSME) echo. The threshold can be increased to exclude more pixels, or decreased to include more pixels).
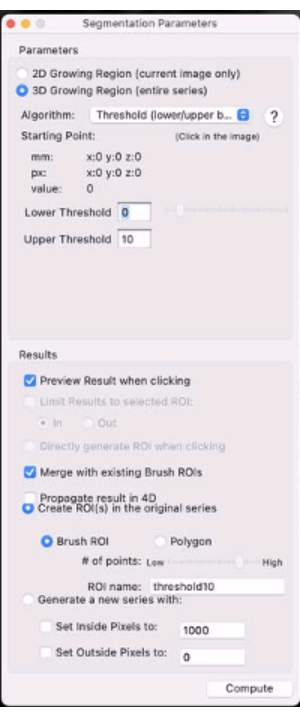
Figure 7: Screenshot showing the segmentation parameters. Please click here to view a larger version of this figure.
Figure 8: Screenshot showing how to select "Save All ROIs of this Series…". Please click here to view a larger version of this figure.
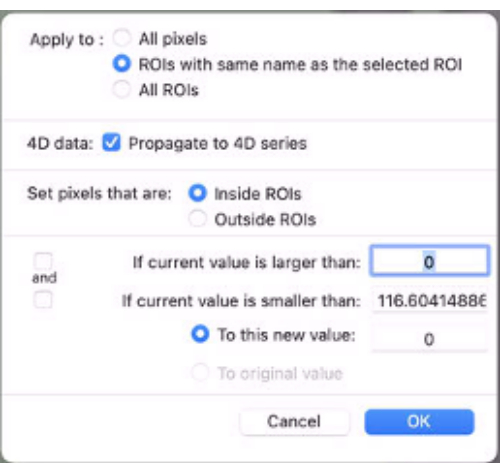
Figure 9: Screenshot showing the values to be inputted in "Set Pixel Values To". Please click here to view a larger version of this figure.
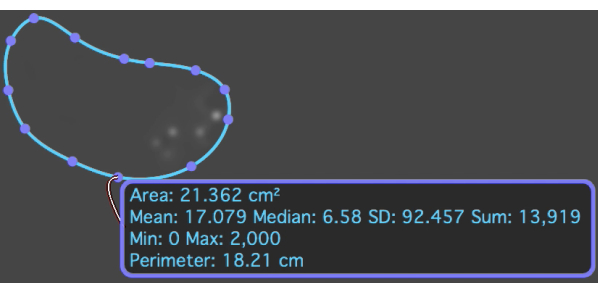
Figure 10: The T2* map with an ROI overlaid on the metastatic osteosarcoma lesion which shows the mean and standard deviation T2* value. Please click here to view a larger version of this figure.
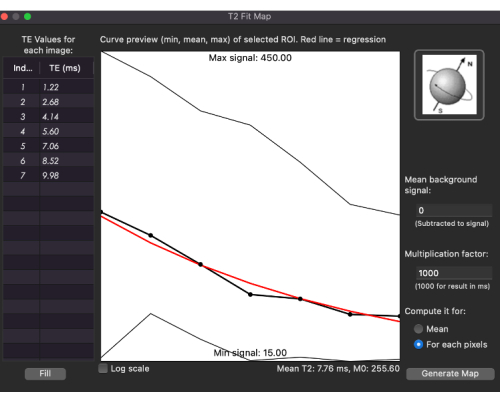
Figure 11: Fitting curve for T2* values for the T2* map in a patient with metastatic osteosarcoma. Please click here to view a larger version of this figure.
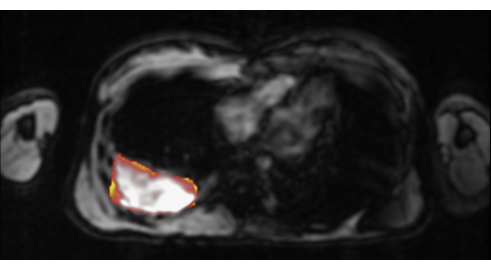
Figure 12: The T2* map overlaid on a T1-weighted image in this patient with metastatic osteosarcoma. Please click here to view a larger version of this figure.
The MRI scan was performed on a commercial scanner. An axial slice through the chest was imaged using a multi-echo single breath-hold gradient echo sequence with a range of TEs (1.22-9.98 ms). T2* was measured using this protocol from the ROI covering the whole tumor in all slices, avoiding the surrounding tissues. The T2* measurements were performed by two different observers. The mean of the measurements from all the slices were calculated for each observer. The tumor T2* relaxation rate was measured by placing an ROI to include the entire tumor tissue on a representative axial slice through the middle of the tumor tissue (Figure 10). Figure 11 shows a fitting curve generated with minimum, mean, and maximum T2* values for the selected ROIs with various TEs (ms) for this patient. The tumor T2* relaxation rate for our patient scan was 6.8 ms. For visual representation, the color-encoded T2* maps were merged with a contrast-enhanced T1-weighted gradient echo image for anatomical orientation (Figure 12). A positive result for this protocol will represent the T2* value in the specific tissue (Figure 10 and Figure 11).
Our protocol allows us to measure tumor T2* relaxation times based on multi-echo gradient-echo sequences, an external software, and a plugin for creating T2* maps. The critical steps within the protocol are the inclusion of the multi-echo gradient-echo sequence with very short TEs into the scanning protocol, and the monoexponential fit of the multi-echo gradient-echo images using external software. It is important to arrange the input multi-echo gradient-echo images according to their acquisition times. This can be achieved by sorting the imaging data series by acquisition time in the external software under the Preferences: Database drop-down menu.
The software we use applies a monoexponential fit to input a multi-echo gradient-echo with no constant offset for T2* fitting. This approach can be inadequate for tissues with a very high iron overload level (T2* < 2-3 ms), where due to the low T2* value, the MR signal reaches a "plateau" equal to the rectified Rician MR noise. This is usually not the case after intravenous injection of iron oxide nanoparticles. However, if marked nanoparticle accumulation in the tumor tissue should be observed, then the use of a pure-exponential model can lead to an important diagnostic error, which can be addressed by the monoexponential offset method5 or the R2 monoexponential truncation method5 to get more accurate T2* results. The truncation method can be easily applied by reducing the number of DICOM files in the fitting process. We also propose a new approach in the software, as described in protocol 2; for tumors with marked iron oxide nanoparticle accumulation and significantly shortened T2* values that are close to zero, we define a mask on the parametric magnitude images or another series to set a lower signal threshold for the T2* value analysis. This reduces misregistrations and errors in the T2* fitting process. The relative and absolute quantity of pixels with near-zero T2* values can also be measured with this approach. This approach has been tested on preclinical data with potential translation to clinical patients.
Our protocol offers wide-ranging applicability since it doesn't necessitate programming language knowledge, unlike the linear least squares method that requires using 3D Slicer16, 17. However, the number of available features for T2* and T2 mapping in the free version of the software is limited compared to the paid version. Another limitation of using this software is its dependability on the MacOS system. A practical problem can be the absence of creating a T2* map with the software. As troubleshooting, if there is no T2* map generation, it is recommended to use the ROI tool to check the TEs. If the multi-echo gradient echo images are not arranged in the order of their TEs, there will be an error in the generation of T2* maps. Therefore, it is highly recommended to arrange the multi-echo gradient echo images according to their TEs and troubleshoot the process.
A benefit of this protocol compared to other existing software16,18,19 is the relative ease of use due to the lack of requirement of programming knowledge. This protocol also allows for quality assurance and quality improvement projects, as it allows for quick assessment of multiple measurements, which in turn allows for reproducibility and repeatability measurements.
Further validation and standardization of our protocol will enable widespread use for tumor T2* measurements of data from different scanners, different manufacturers, and different institutions. This will facilitate longitudinal evaluations of patients who undergo T2* measurements at different sites. In addition, a standardized protocol will help to analyze tumor T2* measurements for multi-center clinical trials. Another potential clinical application of this protocol is the depiction of hemosiderin in tumor tissues20. Other possible clinical applications include the evaluation of tumor patients with immune-targeted therapy with high levels of tumor associated macrophages, monitoring the tumor response to these treatments in these individuals21,22, and depicting the enhancement of hepatic lesions using the superparamagnetic iron oxide contrast agent23,24 and ferucarbotran25,26.
The authors have nothing to disclose.
This work was in part supported by a grant from the National Cancer Institute, grant number U24CA264298. We thank Dawn Holley, Kim Halbert, and Mehdi Khalighi from the PET/MRI Metabolic Service Center for their assistance with the acquisition of PET/MRI scans at the Lucas Research Center at Stanford. We thank the members of the Daldrup-Link lab for valuable input and discussions regarding this project.
OsiriX | Pixmeo SARL | https://www.osirix-viewer.com/ | |
3T GE MR 750 | GE Healthcare, Chicago, IL | ||
FERAHEME (ferumoxytol injection) | AMAG Pharmaceuticals, Inc. 1100 Winter Street Waltham, MA 02451 |