- 00:00Vue d'ensemble
- 01:28Principles of Soil Nutrient Analysis
- 04:12Extraction of Nutrients
- 06:21Analyzing Samples for Nitrate
- 07:52Analyzing Samples for Phosphate
- 09:16Analyzing Samples for Potassium
- 11:13Applications
- 13:08Summary
ניתוח חומרים מזינים בקרקע: חנקן, זרחן ואשלגן
English
Diviser
Vue d'ensemble
מקור: מעבדות של מרגרט וורקמן וקימברלי פריי – אוניברסיטת דפול
בניסוי זה, שלושה macronutrients הקרקע מופקים כימית, בשילוב עם ריאגנטים מבוססי צבע, ולאחר מכן מנותח באמצעות צבע כדי לקבוע את הריכוז התזונתי הנוכחי בדגימת הקרקע.
חנקן, זרחן ואשלגן הם המרכיבים העיקריים של דשן הקרקע. שיטות אלה לבודד כל מ בחומרים מזינים מהאדמה לתוך פתרון שניתן לנתח באמצעות עכוז וצבע כדי לקבוע את הריכוז של חומרים מזינים נוכחים בדגימת הקרקע. ידיעת הריכוז הנוכחי מודיעה למדענים סביבתיים על מחסור בחומרים מזינים או עודף בקרקעות המשמשות לתמיכה בייצור צמחים, ומספקת גם תובנה כללית על מחזורים ביו-גיאוכימיים בסיסיים של מערכת אקולוגית.
Principles
כאשר מבודד כימית מהאדמה, חומרים מזינים ניתן לזהות באמצעות טכניקה זו. חנקן וזרחן, בדרך כלל נמצא בצורה של חנקות ופוספטים, מופקים עם תמצית כימית כי יהיה לקשור את החומרים המזינים של עניין. לאחר שחולצו מהאדמה, כל חומר ממזון יכול להיות משולב עם ריאגנט ידוע שגורם לתמיסה המזינה להשתנות לצבע ספציפי לחומרים מזינים במערכת יחסים ליניארית, עם צבע כהה יותר המציין ריכוז מוגבר של החומרים המזינים. כדי לנתח את הריכוז של כל חומר ממזון, ריאגנט כימי ישמש לצביעת כל מדגם עם עלייה בעוצמת הצבע המציין ריכוז מוגבר של החומרים המזינים.
בבדיקות חנקתיות גבוהות ובינוניות, מתכת קדמיום משמשת להפחתת חנקות (NO3–) לניטריטים (NO2–). קדמיום כלול כריות אבקת Nitraver 5 שנרכשו (טווח גבוה ובינוני) ו Nitraver 6 (טווח נמוך) אבקת כריות.
NO3– + תקליטור + 2 H+ → מס ‘2– + תקליטור2 + H2O
יונים Nitrite ואז להגיב עם חומצה סולפנילית (במדיום חומצי הכלול אבקת NitraVer 5) כדי ליצור מלח דיאזוניום ביניים. בשילוב עם חומצה גנטיזית (הכלול גם NitraVer 5), פתרון בצבע ענבר נוצר. עוצמת הצבע של תרכובת זו היא פרופורציונלית ישירות לריכוז החנקות של דגימת המים וניתן לכמת באמצעות תיבת משווה הצבעים החנקתית עם דיסק צבע ענבר חנקתי רציף.
עבור זרחן, נתרן מולידיאט ואשלגן pyrosulfate אבקת ריאגנט זרחן 3 שנרכשה מגיבים עם פוספטים תגובתי מסיס כדי ליצור קומפלקס פוספו מוליבאדט.
H2PO4– + 12 Na2Moo4 + → PMo12O403-
לאחר מכן, הקומפלקס מצטמצם על ידי חומצה אסקורבית (הכלולה גם באבקת PhosVer 3) ליצירת צבע כחול מוליבדן. הצבע הכחול מכמת באמצעות תיבת משווה צבעים פוספט עם דיסק צבע כחול פוספט רציף.
תיבת השוואת צבעים משמשת עבור שיטה זו. כלי זה פועל על סמך עוצמות צבע ידועות עבור כל ריכוז בין 0-50 מ”ג / ליטר. דיסק צבע בתיבה מופעל עד שהצבע בשני חלונות התצוגה (ריקים ודוגמיים) תואם. לאחר התאמת הצבעים, הריכוז התזונתי המתאים (mg/L) יוצג בחלון תחתון נפרד בתיבת השוואת הצבעים. תיבות אלה חזקות מספיק כדי לשמש עם סטודנטים בכל רמה עד קורסי מבוא במכללה וניתן להעביר אותם בקלות כחלק מערכת בדיקת קרקע שדה שניתן להשתמש בה במקום דגימה. שיטות אלה מאפשרות בדיקות תזונתיות בסיסיות במעבדה בכיתה מבלי להזדקק לציוד יקר שייתכן שלא יהיה זמין. כדי להבטיח דיוק בדיקה, ניתן להשתמש בפתרונות סטנדרטיים של חנקות ופוספט במקום מדגם בהליכים לפני נסיעה לאתר שדה או תחילת ניתוח של דגימות קרקע במעבדה.
בבדיקות האשלגן, יונים אשלגן לשלב עם נתרן טטרפנילבוראט הכלול אבקת אשלגן 3 ריאגנט שנרכש כדי ליצור אשלגן טטרפנילבוראט, משקעים לבנים. המשקעים נשארים השעיה בדגימות, גרימת עלייה בעומת.
NO3– + CD + 2 H+ NaB (C6H5)4 + K+ → KB (C6H5)4 + Na+
דיפסטיק למדידת אשלגן משמש לכימות כמות העקש המומרת לריכוז אשלגן. לדיפסטיק יש נקודה שחורה בקצה אחד שממוקמת במדגם עד שהנקודה כבר לא נראית דרך המשקעים הלבנים. הדיפסטיק מסומן בהדרגה כדי לציין סולם של ראות כי הוא מומר לאחר מכן לריכוז אשלגן עם תרשים המרה. שיטה זו היא הליך זול עם ציוד מינימלי שניתן להעביר לאתר דגימה חיצוני וחזק מספיק כדי לשמש עם סטודנטים בכל רמה עד קורסי מבוא במכללה.
Procédure
Résultats
Each nutrient analysis will result in a concentration reported in mg/L.
Nitrate and Phosphate concentrations will be determined with the color comparator boxes and display the result in the window.
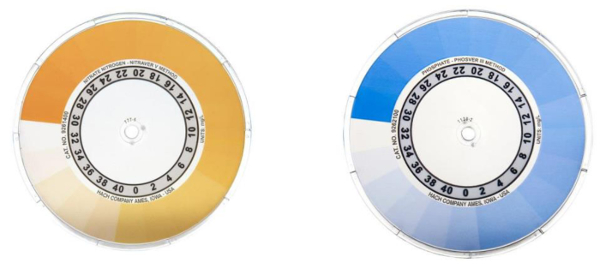
Figure 1. Example color disks for nitrate (left) and phosphate (right) color comparator boxes. Color intensities are on the outer edge of the disks and nutrient concentration (mg/L) are on the inner edge of the disks.
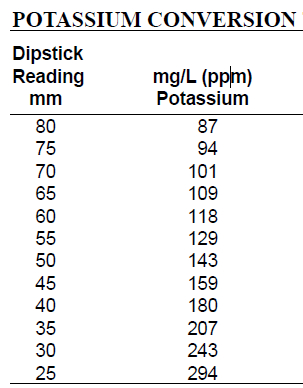
Table 1. Potassium Conversion Table used to convert dipstick potassium reading into mg/L. Locate the dipstick reading on the left column and record the corresponding mg/L concentration on the right column.
| Nitrogen | Phosphorus | Potassium | |
| Nutrient level range in ppm | |||
| Low | 0-15 | 0-25 | 0-60 |
| Medium | 15-30 | 25-50 | 60-100 |
| High | 30+ | 50+ | 100+ |
Table 2. Table of nutrient ranges arranged by categories.
Applications and Summary
Determining the nutrient concentrations for nitrate, phosphates, and potassium can reveal how a soil is functioning in regards to its intended use and how nutrients are cycling through a soil. A nutrient test provides a report of average nutrient concentration (mg/L) for all nutrients tested. In an agricultural setting, knowing the concentration of nutrients can help food producers know when to add fertilizer, how much to add, and which nutrients need supplemented and in what amount. Consistently high nitrogen soils, for instance, would be good for growing nitrogen-demanding crops such as soy and corn. High nitrogen levels are also particularly useful for non-flowering plants because nitrogen is required for any green part of plants. High nitrogen levels can suppress flowering however, if they remain higher than phosphorus levels. Phosphorus controls flowering in plants and is important to any plant production involving flowering or fruiting plants and phosphorus is often added to soils or directly to plants before and during flowering and fruiting life-cycle stages to increase agricultural yields in larger crop size and increased amounts of fruit production per plant. Potassium is involved in catalyzing many chemical reactions required to support plant life including drought tolerance and moisture regulation. Low potassium soils will likely need to be irrigated if soil amendment is not possible. Nutrient concentration can also inform of nutrient deficiencies or surpluses that can be detrimental to plant growth. If a nutrient is too high, amendments can be performed to reduce a surplus, such as adding mulch or tilling the soil. If nutrients are too low to support plant production, fertilization can be used to add nutrients in an amount needed for a specific crop. Low nutrient soil may also have more applicable uses to land managers for recreational or developed (paved surfaces or building construction) spaces.
Transcription
Soil nutrient analyses can be carried out to extract three major soil macronutrients, nitrogen, phosphorus, and potassium, and combine them with color-based reagents to determine their concentration.
Nitrogen, phosphorus, and potassium are major components of soil fertilizer. Knowing their concentration in soils can inform environmental scientists of nutrient deficiency or surplus in soils used to support plant production, and provide a general insight into the basic biogeochemical cycles of an ecosystem.
Soil nutrient analysis can be carried out using chemicals to bind the macronutrient of interest. For nitrogen or phosphorus, reagents are added which react to the presence of the specific macronutrient and produce colored products. Potassium concentration is determined by forming precipitates in an amount proportional to potassium concentration.
These methods are simple, inexpensive, require minimal equipment, and can be carried out in a field setting if desired. This video will illustrate the techniques used to extract and quantify these common soil macronutrients.
To begin analysis, macronutrients are first extracted from collected soil samples. Nitrogen is extracted using calcium sulfate; phosphorus and potassium are extracted using Mehlich 2 solution, a solution of acetic acid, ammonium chloride, hydrochloric acid, hydrofluoric acid, and demineralized water.Boundmacronutrients present in suspension can then be separated from the remaining solid soil components by vacuum filtration.
Once macronutrients have been extracted, their concentration can be determined. For nitrogen, cadmium metal is used to reduce nitrates to nitrites. This cadmium is present in pre-packaged pillows that are added to the soil filtrate. The nitrite ions react with sulfanilic acid to form diazonium salt. This couples with gentisic acid and an amber solution is formed.
For phosphorus, sodium molybdate reacts with the soluble reactive phosphate to form a phospho-molybdate complex. This is then reduced by ascorbic acid to form a molybdenum blue color.
The color intensity of both solutions is proportional to the nutrient concentration. Color comparator boxes are used for analysis of nitrate and phosphate. Samples are compared to a blank, and the color disk is turned until both viewing windows match. The corresponding nutrient concentration in mg/L will be displayed in a separate window. The color intensity of both solutions is proportional to the nutrient concentration.
To quantify potassium, the ions from the soil filtrate combine with sodium tetraphenylborate to form potassium tetraphenylborate, a white precipitate. The precipitate remains in suspension, causing an increase in turbidity.
A potassium dipstick is used to quantify turbidity caused by the precipitate. The dipstick is placed in the sample and lowered until the black dot at the end is no longer visible. The stick is incrementally marked, and readings on this scale can be converted to potassium concentration using a conversion chart.
Now that we are familiar with the principles behind extraction and quantification of soil macronutrients, let’s take a look at how the procedures are carried out in the laboratory.
Once the soil samples have been collected, correctly transported, and stored, they can be brought into the laboratory for analysis, beginning with the nitrogen extraction. First, turn on the balance, set a weigh boat on top, and tare.
Using a spatula, weigh out 10 g of dried, sieved soil sample and transfer to a labeled 100-mL beaker. Next, weigh 0.1 g of calcium sulfate and transfer it to the beaker.
Measure out 20 mL of deionized water with a graduated cylinder and transfer to the beaker. Thoroughly mix the contents of the beaker with a stirring rod. Repeat these additions for each test soil sample. Secure samples on a tabletop shaker and agitate for 1 min.
To begin extraction of phosphorus and potassium from the soils, use a spatula to weigh out 2 g of dried, sieved soil sample, and transfer to a labeled 100-mL beaker. With a graduated cylinder, measure 20 mL of Mehlich 2 soil extractant and transfer to the beaker. Thoroughly mix the contents of the beaker with a stir rod. Secure samples on a tabletop shaker and agitate for 5 min. After extraction, all three nutrient sample sets should be vacuum filtered using a vacuum flask and Büchner funnel.
First, turn on the vacuum jet and slowly pour the soil extract solution into the funnel. Extract should drain from the funnel, into the flask. Pour the filtrate into a clean, labeled 50-mL beaker. Remove the funnel, discard filter paper, and rinse funnel and flask with deionized water. Use an air jet to dry the funnel and flask.
Now the nutrient samples have been filtered, content analysis can begin. For each nutrient test, begin by labeling a color viewing tube with an “S”, for sample. Label a second with a “B” for blank.
Thoroughly rinse both color viewing tubes with deionized water, then shake to remove the remaining rinse water. Add the sample extract to a depth of ¼ inch in the color viewing tube marked “S”. Cap the tube with a rubber stopper and shake for 3 s, then discard the solution.
Next, add the sample extract to both tubes until the meniscus is even with the 5-mL mark on the tubes, at the bottom of the frosted area. Add the contents of one nitrogen reagent pillow to the tube marked “S”. Cap and shake the tube vigorously for 1 min. Immediately place both tubes into the comparator, with tube “B” in the outside hole, and tube “S” on the inside. Leave for 5 min.
Hold the comparator up to a light source and rotate the disc until the color in the window for tube “B” matches that in the window for tube “S”. Record the concentration value displayed in the lower window of the color comparator box.
Samples can also be analyzed for phosphate content using the color comparator. Using a dropper, add 2.5 mL of the filtered phosphorus sample extract to a 25 mL graduated cylinder. Add deionized water to the 25 mL mark, cap with a stopper, and invert to mix. Add the diluted sample extract to about ¼ inch deep in the color viewing tube marked “S” to rinse the tube. Cap with a rubber stopper, and shake for a few seconds before discarding the solution.
Into both tubes, add the sample extract until the meniscus is even with the 5 mL mark. Add the contents of one phosphorus reagent pillow to the “S” tube, cap, and shake vigorously for 1 min. Immediately place the color tubes into the color comparator, with the blank tube in the outside hole, and the sample tube in the inside hole. Leave for 3 min. Hold the comparator up to a light source, and rotate the disc until the window for tube “B” matches the color in the window for tube “S”. Record the value displayed in the window.
Finally, samples can be analyzed for potassium content. Using a dropper, add 3 mL of potassium sample extract to a 25 mL cylinder. Add deionized water to the 21 mL mark on the cylinder, cap firmly with a rubber stopper, and invert. Next, add one potassium 2 reagent pillow to the cylinder. Add 3 mL of an alkaline EDTA solution to the cylinder, cap with a rubber stopper, and invert several times to mix. Let the solution stand for 3 min. Add the contents of one potassium reagent pillow, cap the cylinder and shake vigorously for 10 s. Allow the solution to stand for 3 min as a white turbidity develops.
Looking straight down into the cylinder, slowly insert the potassium dipstick vertically into the solution until the black dot is no longer visible from above. Hold the dipstick in position and rotate the cylinder to view the scale. Record the number on the dipstick scale where the surface of the sample meets the dipstick. Refer to the potassium conversion table to determine the concentration of samples in mg/L. Locate the dipstick reading in the left hand column, and record the corresponding mg/L concentration reported in the right hand column.
Once concentrations are obtained, a table of nutrient ranges can be used to assess sample quality and determine whether sampled soil needs nutrient amendment, and if so, how much. Nutrient amendment can be carried out by application of specific fertilizers.
The ability to analyze the soil nutrient composition of soils has a wide variety of applications, with potential implications for human populations or agricultural ecosystems.
Different crop plants will have different potential nutrient requirements for optimal growing. For example, high nitrogen levels are needed for growing nitrogen-demanding crops, such as soy and corn. High levels of phosphorus can stimulate and enhance flower or fruit production. The ability to measure soil nutrient composition in an intended crop growing area can therefore allow farmers or land managers to supplement the soil with necessary nutrients to grow their intended crop successfully.
The composition of soil can also have implications for its ability to retain water, which can in turn influence its ability to support different flora or fauna. For example, low potassium soils have poor drought tolerance, and may require nutrient amendment, by fertilization of the soil with appropriate amounts of the missing nutrient. Alternatively, irrigation may be necessary to grow any plants that do not display high drought tolerance.
Soil composition and nutrient quality can also help inform land managers to designate appropriate land-use. In areas where the soil has poor nutrient quality, that would require heavy modification or supplementation to grow crop plants, setting aside land for development of buildings or structures may be more appropriate. Alternatively, areas with ideal composition for intended crop growing can be earmarked and set aside, protected from development.
You’ve just watched JoVE’s introduction to Soil Nutrient Analysis. You should now understand the importance of soil macronutrients, how to extract them from soils, and how to determine their concentrations. Thanks for watching!


