- 00:00Vue d'ensemble
- 01:28Principles of Soil Nutrient Analysis
- 04:12Extraction of Nutrients
- 06:21Analyzing Samples for Nitrate
- 07:52Analyzing Samples for Phosphate
- 09:16Analyzing Samples for Potassium
- 11:13Applications
- 13:08Summary
토양 영양소 분석: 질소, 인 및 칼륨
English
Diviser
Vue d'ensemble
출처: 마가렛 노동자와 킴벌리 프라이의 실험실 – 데폴 대학
본 실험에서, 3개의 토양 다량 영양소는 화학적으로 추출되고, 색계 시약과 결합한 다음, 토양 샘플에 존재하는 영양소 농도를 결정하기 위해 색상을 사용하여 분석한다.
질소, 인 및 칼륨은 토양 비료의 주요 구성 요소입니다. 이러한 방법은 토양 샘플에 존재하는 영양소의 농도를 결정하기 위해 탁도 및 색상을 사용하여 분석 할 수있는 용액으로 토양에서 각 영양소를 분리합니다. 현재의 농도를 아는 것은 환경 과학자들에게 식물 생산을 지원하는 데 사용되는 토양에서 영양 결핍이나 잉여를 알리고 생태계의 기본적인 생화학 적 주기에 대한 일반적인 통찰력을 제공합니다.
Principles
화학적으로 토양에서 분리될 때, 이 기술을 사용하여 영양소를 검출할 수 있습니다. 질소와 인은 일반적으로 질산염과 인산염의 형태로 발견되며 관심 영양소를 결합하는 화학 추출물로 추출됩니다. 토양에서 추출되면, 각 영양소는 영양소 용액이 선형 관계에서 영양소 별 색으로 변경되는 알려진 시약과 결합될 수 있으며, 더 어두운 색으로 영양소의 농도가 증가합니다. 각 영양소의 농도를 분석하기 위해, 화학 시약은 영양소의 농도증가를 나타내는 색 강도의 증가와 함께 각 시료의 색을 착색하는 데 사용될 것이다.
고중범위 질산염 테스트에서 카드뮴 금속은 질산염(NO3-)을아질산염(NO2-)으로줄이는 데 사용된다. 카드뮴은 구입한 니트라버 5(고중레인지) 및 니트라버 6(저거리) 파우더 베개에 포함되어 있습니다.
NO3– + Cd + 2 H+ → NO2– + Cd2+ + H2O
아질산 이온은 황자닐산(NitraVer 5 분말에 함유된 산성 배지)과 반응하여 중간 디아조늄 염을 형성합니다. 젠트리시스산(NitraVer 5에 함유됨)과 결합하면 호박색 용액이 형성됩니다. 이 화합물의 색상 강도는 물 샘플의 질산염 농도에 직접 비례하며 연속 질산염 호박색 디스크를 사용하여 질산염 색상 비교기 상자를 사용하여 정량화 될 수 있습니다.
인의 경우, 몰리다테 나트륨, 및 칼륨 피로술파테의 구입인 3 시약 분말은 수용성 반응성 인산염과 반응하여 인 몰리비데이트 복합체를 형성한다.
H2PO4– + 12 Na2MoO4 + → PMo12O403-
복합체는 몰리브덴 블루 컬러를 형성하기 위해 아스코르브산(포스버 3 분말에 함유됨)에 의해 감소된다. 블루 컬러는 연속 인산염 블루 컬러 디스크가 있는 인산염 색상 비교기 상자를 사용하여 정량화됩니다.
이 메서드에 색상 비교기 상자가 사용됩니다. 이 도구는 0-50 mg/L 사이의 각 농도에 대해 알려진 색상 강도에 따라 작동합니다. 상자의 색상 디스크는 창(빈 및 샘플)의 색상이 일치할 때까지 설정됩니다. 색상이 일치하면 해당 영양소 농도(mg/L)가 색상 비교기 상자의 별도의 하부 창에 표시됩니다. 이 상자는 소개 대학 과정까지 모든 수준에서 학생들과 함께 사용할 수있을만큼 견고하며 샘플링 위치에서 사용할 수있는 필드 토양 테스트 키트의 일부로 쉽게 운반 할 수 있습니다. 이러한 방법을 사용하면 사용하지 못할 수 있는 고가의 장비가 필요하지 않고 교실 실험실에서 기본적인 영양소 테스트를 할 수 있습니다. 시험 정확도를 보장하기 위해 질산염 및 인산염 표준 솔루션은 현장 현장으로 이동하거나 실험실의 토양 샘플 분석을 시작하기 전에 절차의 샘플 대신 사용할 수 있습니다.
칼륨 테스트에서 칼륨 이온은 구입한 칼륨 3 시약 분말에 함유 된 테트라페닐보산나트륨과 결합하여 칼륨 테트라페닐보레이트, 백색 침전물을 형성합니다. 침전은 샘플의 현탁액에 남아 탁도가 증가합니다.
NO3– + Cd + 2 H+ NaB (C6H5)4 + K+ → KB (C6H5)4 + Na+
칼륨 측정 딥스틱은 칼륨 농도로 변환되는 탁도의 양을 정량화하는 데 사용됩니다. 딥스틱은 한쪽 끝에 검정점이 있어 점이 더 이상 흰색 침전을 통해 볼 수 없을 때까지 샘플에 배치됩니다. 딥스틱은 점진적으로 표시되어 전환 차트를 사용하여 칼륨 농도로 변환되는 가시성 의 척도를 나타냅니다. 이 방법은 야외 샘플링 사이트로 운반 할 수있는 최소한의 장비와 입문 대학 과정까지 모든 수준에서 학생들과 함께 사용할 수있을만큼 강력한 저렴한 절차입니다.
Procédure
Résultats
Each nutrient analysis will result in a concentration reported in mg/L.
Nitrate and Phosphate concentrations will be determined with the color comparator boxes and display the result in the window.
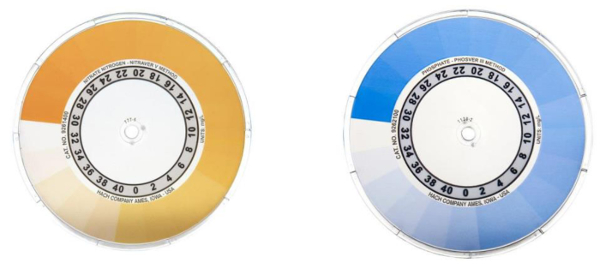
Figure 1. Example color disks for nitrate (left) and phosphate (right) color comparator boxes. Color intensities are on the outer edge of the disks and nutrient concentration (mg/L) are on the inner edge of the disks.
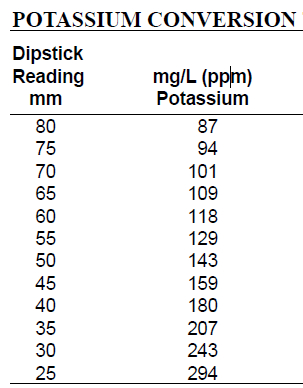
Table 1. Potassium Conversion Table used to convert dipstick potassium reading into mg/L. Locate the dipstick reading on the left column and record the corresponding mg/L concentration on the right column.
| Nitrogen | Phosphorus | Potassium | |
| Nutrient level range in ppm | |||
| Low | 0-15 | 0-25 | 0-60 |
| Medium | 15-30 | 25-50 | 60-100 |
| High | 30+ | 50+ | 100+ |
Table 2. Table of nutrient ranges arranged by categories.
Applications and Summary
Determining the nutrient concentrations for nitrate, phosphates, and potassium can reveal how a soil is functioning in regards to its intended use and how nutrients are cycling through a soil. A nutrient test provides a report of average nutrient concentration (mg/L) for all nutrients tested. In an agricultural setting, knowing the concentration of nutrients can help food producers know when to add fertilizer, how much to add, and which nutrients need supplemented and in what amount. Consistently high nitrogen soils, for instance, would be good for growing nitrogen-demanding crops such as soy and corn. High nitrogen levels are also particularly useful for non-flowering plants because nitrogen is required for any green part of plants. High nitrogen levels can suppress flowering however, if they remain higher than phosphorus levels. Phosphorus controls flowering in plants and is important to any plant production involving flowering or fruiting plants and phosphorus is often added to soils or directly to plants before and during flowering and fruiting life-cycle stages to increase agricultural yields in larger crop size and increased amounts of fruit production per plant. Potassium is involved in catalyzing many chemical reactions required to support plant life including drought tolerance and moisture regulation. Low potassium soils will likely need to be irrigated if soil amendment is not possible. Nutrient concentration can also inform of nutrient deficiencies or surpluses that can be detrimental to plant growth. If a nutrient is too high, amendments can be performed to reduce a surplus, such as adding mulch or tilling the soil. If nutrients are too low to support plant production, fertilization can be used to add nutrients in an amount needed for a specific crop. Low nutrient soil may also have more applicable uses to land managers for recreational or developed (paved surfaces or building construction) spaces.
Transcription
Soil nutrient analyses can be carried out to extract three major soil macronutrients, nitrogen, phosphorus, and potassium, and combine them with color-based reagents to determine their concentration.
Nitrogen, phosphorus, and potassium are major components of soil fertilizer. Knowing their concentration in soils can inform environmental scientists of nutrient deficiency or surplus in soils used to support plant production, and provide a general insight into the basic biogeochemical cycles of an ecosystem.
Soil nutrient analysis can be carried out using chemicals to bind the macronutrient of interest. For nitrogen or phosphorus, reagents are added which react to the presence of the specific macronutrient and produce colored products. Potassium concentration is determined by forming precipitates in an amount proportional to potassium concentration.
These methods are simple, inexpensive, require minimal equipment, and can be carried out in a field setting if desired. This video will illustrate the techniques used to extract and quantify these common soil macronutrients.
To begin analysis, macronutrients are first extracted from collected soil samples. Nitrogen is extracted using calcium sulfate; phosphorus and potassium are extracted using Mehlich 2 solution, a solution of acetic acid, ammonium chloride, hydrochloric acid, hydrofluoric acid, and demineralized water.Boundmacronutrients present in suspension can then be separated from the remaining solid soil components by vacuum filtration.
Once macronutrients have been extracted, their concentration can be determined. For nitrogen, cadmium metal is used to reduce nitrates to nitrites. This cadmium is present in pre-packaged pillows that are added to the soil filtrate. The nitrite ions react with sulfanilic acid to form diazonium salt. This couples with gentisic acid and an amber solution is formed.
For phosphorus, sodium molybdate reacts with the soluble reactive phosphate to form a phospho-molybdate complex. This is then reduced by ascorbic acid to form a molybdenum blue color.
The color intensity of both solutions is proportional to the nutrient concentration. Color comparator boxes are used for analysis of nitrate and phosphate. Samples are compared to a blank, and the color disk is turned until both viewing windows match. The corresponding nutrient concentration in mg/L will be displayed in a separate window. The color intensity of both solutions is proportional to the nutrient concentration.
To quantify potassium, the ions from the soil filtrate combine with sodium tetraphenylborate to form potassium tetraphenylborate, a white precipitate. The precipitate remains in suspension, causing an increase in turbidity.
A potassium dipstick is used to quantify turbidity caused by the precipitate. The dipstick is placed in the sample and lowered until the black dot at the end is no longer visible. The stick is incrementally marked, and readings on this scale can be converted to potassium concentration using a conversion chart.
Now that we are familiar with the principles behind extraction and quantification of soil macronutrients, let’s take a look at how the procedures are carried out in the laboratory.
Once the soil samples have been collected, correctly transported, and stored, they can be brought into the laboratory for analysis, beginning with the nitrogen extraction. First, turn on the balance, set a weigh boat on top, and tare.
Using a spatula, weigh out 10 g of dried, sieved soil sample and transfer to a labeled 100-mL beaker. Next, weigh 0.1 g of calcium sulfate and transfer it to the beaker.
Measure out 20 mL of deionized water with a graduated cylinder and transfer to the beaker. Thoroughly mix the contents of the beaker with a stirring rod. Repeat these additions for each test soil sample. Secure samples on a tabletop shaker and agitate for 1 min.
To begin extraction of phosphorus and potassium from the soils, use a spatula to weigh out 2 g of dried, sieved soil sample, and transfer to a labeled 100-mL beaker. With a graduated cylinder, measure 20 mL of Mehlich 2 soil extractant and transfer to the beaker. Thoroughly mix the contents of the beaker with a stir rod. Secure samples on a tabletop shaker and agitate for 5 min. After extraction, all three nutrient sample sets should be vacuum filtered using a vacuum flask and Büchner funnel.
First, turn on the vacuum jet and slowly pour the soil extract solution into the funnel. Extract should drain from the funnel, into the flask. Pour the filtrate into a clean, labeled 50-mL beaker. Remove the funnel, discard filter paper, and rinse funnel and flask with deionized water. Use an air jet to dry the funnel and flask.
Now the nutrient samples have been filtered, content analysis can begin. For each nutrient test, begin by labeling a color viewing tube with an “S”, for sample. Label a second with a “B” for blank.
Thoroughly rinse both color viewing tubes with deionized water, then shake to remove the remaining rinse water. Add the sample extract to a depth of ¼ inch in the color viewing tube marked “S”. Cap the tube with a rubber stopper and shake for 3 s, then discard the solution.
Next, add the sample extract to both tubes until the meniscus is even with the 5-mL mark on the tubes, at the bottom of the frosted area. Add the contents of one nitrogen reagent pillow to the tube marked “S”. Cap and shake the tube vigorously for 1 min. Immediately place both tubes into the comparator, with tube “B” in the outside hole, and tube “S” on the inside. Leave for 5 min.
Hold the comparator up to a light source and rotate the disc until the color in the window for tube “B” matches that in the window for tube “S”. Record the concentration value displayed in the lower window of the color comparator box.
Samples can also be analyzed for phosphate content using the color comparator. Using a dropper, add 2.5 mL of the filtered phosphorus sample extract to a 25 mL graduated cylinder. Add deionized water to the 25 mL mark, cap with a stopper, and invert to mix. Add the diluted sample extract to about ¼ inch deep in the color viewing tube marked “S” to rinse the tube. Cap with a rubber stopper, and shake for a few seconds before discarding the solution.
Into both tubes, add the sample extract until the meniscus is even with the 5 mL mark. Add the contents of one phosphorus reagent pillow to the “S” tube, cap, and shake vigorously for 1 min. Immediately place the color tubes into the color comparator, with the blank tube in the outside hole, and the sample tube in the inside hole. Leave for 3 min. Hold the comparator up to a light source, and rotate the disc until the window for tube “B” matches the color in the window for tube “S”. Record the value displayed in the window.
Finally, samples can be analyzed for potassium content. Using a dropper, add 3 mL of potassium sample extract to a 25 mL cylinder. Add deionized water to the 21 mL mark on the cylinder, cap firmly with a rubber stopper, and invert. Next, add one potassium 2 reagent pillow to the cylinder. Add 3 mL of an alkaline EDTA solution to the cylinder, cap with a rubber stopper, and invert several times to mix. Let the solution stand for 3 min. Add the contents of one potassium reagent pillow, cap the cylinder and shake vigorously for 10 s. Allow the solution to stand for 3 min as a white turbidity develops.
Looking straight down into the cylinder, slowly insert the potassium dipstick vertically into the solution until the black dot is no longer visible from above. Hold the dipstick in position and rotate the cylinder to view the scale. Record the number on the dipstick scale where the surface of the sample meets the dipstick. Refer to the potassium conversion table to determine the concentration of samples in mg/L. Locate the dipstick reading in the left hand column, and record the corresponding mg/L concentration reported in the right hand column.
Once concentrations are obtained, a table of nutrient ranges can be used to assess sample quality and determine whether sampled soil needs nutrient amendment, and if so, how much. Nutrient amendment can be carried out by application of specific fertilizers.
The ability to analyze the soil nutrient composition of soils has a wide variety of applications, with potential implications for human populations or agricultural ecosystems.
Different crop plants will have different potential nutrient requirements for optimal growing. For example, high nitrogen levels are needed for growing nitrogen-demanding crops, such as soy and corn. High levels of phosphorus can stimulate and enhance flower or fruit production. The ability to measure soil nutrient composition in an intended crop growing area can therefore allow farmers or land managers to supplement the soil with necessary nutrients to grow their intended crop successfully.
The composition of soil can also have implications for its ability to retain water, which can in turn influence its ability to support different flora or fauna. For example, low potassium soils have poor drought tolerance, and may require nutrient amendment, by fertilization of the soil with appropriate amounts of the missing nutrient. Alternatively, irrigation may be necessary to grow any plants that do not display high drought tolerance.
Soil composition and nutrient quality can also help inform land managers to designate appropriate land-use. In areas where the soil has poor nutrient quality, that would require heavy modification or supplementation to grow crop plants, setting aside land for development of buildings or structures may be more appropriate. Alternatively, areas with ideal composition for intended crop growing can be earmarked and set aside, protected from development.
You’ve just watched JoVE’s introduction to Soil Nutrient Analysis. You should now understand the importance of soil macronutrients, how to extract them from soils, and how to determine their concentrations. Thanks for watching!


