测量与基于体素的形态计量学的灰质分歧: 音乐的大脑
English
Diviser
Vue d'ensemble
资料来源: 乔纳斯 · 卡普兰和莎拉一、 贝尔实验室 — — 南加利福尼亚大学
经验塑造大脑。众所周知,我们的大脑是不同学习的结果。虽然许多经验相关的变化体现自己在微观的层次,例如由行为中的单个神经元的神经化学调整,我们也可能检查到宏观一级大脑结构的解剖学变化。这种变化的一个著名例子来自伦敦出租车司机,他和学习的城市复杂的路线在海马,被称为在导航内存中发挥作用的大脑结构中显示较大音量的一例。1
许多传统方法检测脑解剖所需煞费苦心的查寻的解剖区域的利益衡量他们的大小。然而,使用现代影像学的技术,我们现在可以比较大脑的解剖跨组使用自动的算法的人。尽管这些技术也不去利用自己的人类解剖学可能带到任务的先进知识,它们是快速,敏感到很小的差异,在解剖。在脑结构的磁共振图像,每个体积像素或像素、 强度涉及该区域灰质的密度。例如,在 T1 加权磁共振成像扫描,非常明亮的体素在位置找到那里有白质纤维束,而暗像素对应的灰质,神经元的胞体所在。 量化和比较大脑结构基于体素的体素的技术被称为基于体素的形态或 VBM。2在 VBM,我们第一次注册所有的大脑到一个共同的空间,平滑解剖的任何严重分歧。然后,我们比较素以确定本地化、 小尺度差异在灰质密度的强度值。
在这个实验中,我们将展示 VBM 技术通过对比音乐家与那些非音乐家的大脑。音乐家参与激烈的行动、 视觉和声学培训。还有证据从多个渠道获悉,那些已经通过音乐训练的人的大脑功能和结构不同于那些没有的人。在这里,我们跟随格萨尔和 Shlaug3和贝穆德斯et al。4在使用 VBM 来标识这些音乐家的大脑在结构上的差异。
Procédure
Résultats
The VBM analysis revealed significant localized increases in gray matter density in musicians' brains compared with non-musician controls. These differences were found in the superior temporal lobes on both sides. The largest, most significant cluster was on the right side and includes the posterior portion of Heschl's gyrus (Figure 2). Heschl's gyrus is the location of the primary auditory cortex, and the surrounding cortices are involved in complex auditory processing. Thus, these results are consistent with previous findings of morphological differences between musicians and non-musicians in auditory brain regions.
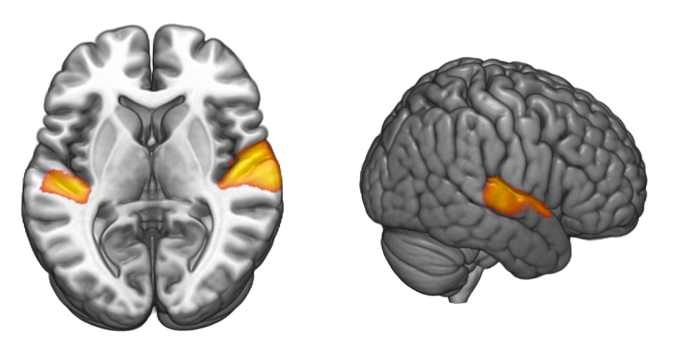
Figure 2: Gray matter differences between groups. Musicians showed significantly higher gray matter density in the superior temporal lobe on both sides, with the greatest differences on the right side. This region includes part of Heschl's gyrus, the primary auditory cortex.
Applications and Summary
The VBM technique has the potential to demonstrate localized differences in gray matter between groups of people, or in association with a measurement that varies across a group of people. In addition to finding structural differences that relate to different forms of training, this technique may reveal anatomical differences that are associated with wide ranging neuropsychological conditions such as depression,5 dyslexia,6 or schizophrenia.7
It is important to note that there are multiple explanations for the existence of between-group differences in brain anatomy. For example, in the case of musicians, there could be a self-selection bias. We may find such differences if people with a certain brain anatomy are more likely to become musicians. In order to establish that structural differences between groups of people are the result of experience, the most definitive way is to employ a longitudinal study that follows people over time.
References
- Maguire, E.A., et al. Navigation-related structural change in the hippocampi of taxi drivers. Proc Natl Acad Sci U S A 97, 4398-4403 (2000).
- Ashburner, J. & Friston, K.J. Voxel-based morphometry–the methods. Neuroimage 11, 805-821 (2000).
- Gaser, C. & Schlaug, G. Brain structures differ between musicians and non-musicians. J Neurosci 23, 9240-9245 (2003).
- Bermudez, P., Lerch, J.P., Evans, A.C. & Zatorre, R.J. Neuroanatomical correlates of musicianship as revealed by cortical thickness and voxel-based morphometry. Cereb Cortex 19, 1583-1596 (2009).
- Bora, E., Fornito, A., Pantelis, C. & Yucel, M. Gray matter abnormalities in Major Depressive Disorder: a meta-analysis of voxel based morphometry studies. J Affect Disord 138, 9-18 (2012).
- Richlan, F., Kronbichler, M. & Wimmer, H. Structural abnormalities in the dyslexic brain: a meta-analysis of voxel-based morphometry studies. Hum Brain Mapp 34, 3055-3065 (2013).
- Zhang, T. & Davatzikos, C. Optimally-Discriminative Voxel-Based Morphometry significantly increases the ability to detect group differences in schizophrenia, mild cognitive impairment, and Alzheimer's disease. Neuroimage 79, 94-110 (2013).
Transcription
Our brains are shaped by experiences, resulting in changes in cortical volume.
For instance, certain proficiencies, like learning and mastering a second language, have been shown to increase the density of gray matter, where cell bodies reside, particularly in structures such as the frontal lobe.
Before modern advances, to measure a particular area’s size, scientists would have to painstakingly trace the region of interest—a very tedious task. Now, more sensitive neuroimaging techniques—known as voxel-based morphometry, VBM—exist to capture small volumetric differences in neuroanatomy.
Based on previous work of Gaser and Shlaug, as well as Bermudez and colleagues, this video demonstrates how to collect structural magnetic resonance images and use VBM to identify the intensity values of voxels in the brains of individuals with different experiences—expert musicians compared to those with very limited training—as well as in other cases of expertise, such as chess playing.
In this experiment, two groups of participants—formally trained musicians and controls with no such training—are asked to lie in an MRI scanner while structural images of their brains are collected.
Particular regions can then be defined using an automated approach, based on the intensity of volumetric pixels, called voxels. For instance, very bright clusters indicate the location of white-matter fiber bundles, while darker voxels correspond to areas with dense gray matter.
Following this segmentation for each brain, the images are transformed—registered to a standard atlas, which is a common space to allow for between-subject comparisons.
Often times, this registration process can stretch out an image, which makes some structures seem like they have more gray matter than they really do.
Therefore, the template must be multiplied by a measure of how much warping has been done, called a Jacobian determinant, to compensate for the repeated stretching, and then all gross differences in anatomy are smoothed out.
After the transformations are applied, the dependent variable is calculated as the differences in gray matter density between musicians’ brains compared to non-musician controls.
Due to the increased use of complex auditory processing in skillful musicians, it is expected that this group will show increased gray matter density in auditory brain regions, such as the superior temporal lobe and Heschl’s gyrus, compared to the control group.
Prior to the experiment, recruit 40 musicians who actively practice any instrument 1 hr a day and have at least 10 years of formal musical training, as well as 40 non-musician controls who have little to no proper training.
On the day of their scan, greet each participant in the laboratory and verify that they meet the safety requirements as they complete the necessary consent forms.
Please refer to another fMRI project in this collection for more details on how to prepare individuals to enter the scanning room and scanner bore.
Now, instruct the participant to lie still in the scanner, and begin scanning the whole brain by collecting a high-resolution, T1-weighted anatomical sequence such as Magnetization Prepared-Rapid Gradient Echo with 1 mm isotropic voxels.
Following the image-collection protocol, dismiss the participant and start the analysis.
To begin preprocessing, isolate the brain from the skull for each scan and check the quality of the stripping.
For this study, create a specific gray matter template by first segmenting each subject’s brain into white and gray matter and cerebral spinal fluid, CSF, based on the intensity of each voxel. Note, the software automatically distinguishes bright voxels as white matter, dark voxels as gray matter, and areas within the ventricles as CSF.
Perform a linear affine transformation with 12° of freedom, to register each subject’s brain to a standard atlas space. Warp each subject’s gray matter image into this space, and average them all together.
Next, mirror this left to right, and once again, average the images together to produce the initial gray matter template.
Then, perform a non-linear transformation to re-register each subject’s brain to the gray matter figure, and average these together. Create a mirrored copy of this new image, and once again average the two together to produce a final, study-specific, gray matter template.
Now register each subject’s brain to the last gray matter figure using a non-linear transformation, and multiply by a Jacobian measure of how much warping has been done to compensate for the amount each brain structure has been stretched to fit the template space.
Subsequently, smooth the data using a Gaussian kernel with a Full-Width Half Maximum of 10 mm to increase the overlap of similar brain voxels across all subjects.
With preprocessing completed, model each group of brains with a separate regressor. Compute a contrast that compares the two groups to generate statistical maps that quantify the likelihood of differences at each voxel.
Finally, perform a multiple comparisons correction technique, such as a False Discovery Rate with a q value of 0.01, to control for the thousands of simultaneous statistical tests performed. This value will estimate the rate of false positives above a threshold of 1%.
Here, the VBM analysis revealed significant bilateral increases in gray matter density in the superior temporal lobe of the musicians’ brains compared to the controls. The greatest difference was shown on the right side, and this included the posterior portion of Heschl’s gyrus, the location of the primary auditory cortex.
Now that you are familiar with how to use VBM to study neuroanatomy, let’s look how researchers use this technique to study structural differences in other populations.
While many tasks involving intense training and experience are associated with increases in gray matter volume, this enlargement is not always the case for all types of learned skill-sets, like in the brain of an experienced chess player.
When compared to controls, gray matter volume was reduced in the occipito-temporal junction, an area important for object recognition. Such findings result in an interesting anomaly that may help scientists further understand how cortical volume relates to performance in demanding tasks.
Individuals who are blind from birth often have smaller gray matter volume in their visual cortex compared to controls. Interestingly, through the use of VBM, researchers have discovered significant enlargement in areas of the brain not responsible for vision, such as the auditory cortex, which was twice the size found in sighted controls.
These structural differences may serve as an anatomical foundation to explain why other senses are heightened in blind individuals.
Furthermore, structural MRI and VBM analysis on medication-naïve patients with major depressive disorder also indicate differences in gray matter volumes compared to controls.
Scientists found that these patients had decreased gray matter volume in the frontal cortex and insula, which may explain why depressed patients have difficulty with cognitive control over negative feelings toward themselves and others.
You’ve just watched JoVE’s video on voxel-based morphometry. Now you should have a good understanding of how to collect anatomical images using MRI as well as how to analyze and interpret differences in gray matter intensity in regions of the auditory cortex. You should have also learned that not all areas of expertise lead to increases in cortical density.
Thanks for watching!