JoVE Science Education
Aeronautical Engineering
Un abonnement à JoVE est nécessaire pour voir ce contenu.  Connectez-vous ou commencez votre essai gratuit.
JoVE Science Education Aeronautical Engineering
Flow Visualization in a Water Tunnel: Observing the Leading-edge Vortex Over a Delta Wing
  • 00:01Concepts
  • 02:34Observing Vortex Flow Over a Delta Wing in a Water Tunnel
  • 05:37Résultats

Strömungsvisualisierung in einem Wassertunnel: Beobachtung des Vorderkantenwirbels über einem Deltaflügel

English

Diviser

Vue d'ensemble

Der Delta-Flügel, dargestellt in Abbildung 1D, ist ein beliebtes Design in Hochgeschwindigkeitsflugzeugen aufgrund seiner hervorragenden Leistung in transonischen und Überschall-Flugregimen. Diese Art von Flügel hat ein kleines Seitenverhältnis und einen hohen Sweep-Winkel, der den Luftwiderstand bei hohen Unterschall-, Transononik- und Überschall-Flugregimen reduziert. Das Seitenverhältnis ist definiert als die Flügelspanne geteilt durch den durchschnittlichen Akkord.

Ein wichtiger Vorteil des Deltaflügels ist sein hoher Stallwinkel. Der Stall eines Deltaflügels verzögert sich im Vergleich zum Stall eines Flügels mit hohem Seitenverhältnis. Denn der Auftrieb eines Deltaflügels wird durch den spitzen Wirbel über dem Flügel verstärkt.

Eine effektive Möglichkeit, dieses Wirbelflussphänomen zu beobachten und den Wirbelabbau in einem Deltaflügel zu untersuchen, besteht darin, den Fluss in einem Wassertunnel zu visualisieren. Durch das Einspritzen von Farbstoff enden in den Fluss, der ein Modell von Farbstoffports an der Vorderkante umgibt, kann die Wirbelentwicklung und -aufschlüsselung beobachtet und ihre Position gemessen werden. Die Daten können auch verwendet werden, um den Stallwinkel zu schätzen.

Abbildung 1. Typische Flügelplanformformen: A) Rechteckig, mit konstantem Akkord entlang der Spannweite, B) elliptisch, C) verjüngt, mit variablem Akkord entlang der Spannweite, und D) Deltaflügel, ein achtgeschwungener Flügel mit Null-Kegelverhältnis.

Principles

Procédure

1. Vorbereitung des Wassertunnels Besorgen Sie sich drei 500-ml-Behälter und füllen Sie jeden Behälter mindestens halbvoll mit Farbstoff. Es sollte einen Behälter mit blauem Farbstoff geben, einen mit grünem Farbstoff und einen mit rotem Farbstoff. Die Konzentration ist nicht wichtig, da die Färbegeschwindigkeit entsprechend angepasst wird. Installieren Sie den Deltaflügel auf seiner Stütze im Wassertunnel. Befestigen Sie die C-Strut-Stütze mit Schrauben am Wassertunnel, wobe…

Résultats

From the experiment, we can identify the vortex breakdown, as illustrated in Figure 4. The distance from the wing apex to the vortex breakdown can be measured using the scale drawn in the wing (Figure 4B). During the experiment, the angle of attack of the wing was incrementally increased, and the vortex breakdown location, lb, with respect to the wing apex, was measured. The breakdown location, x/c, with respect to the wing trailing edge was graphed against the angle of attack, as shown in Figure 5. When α ≈ 10°, the time-averaged position of the leading-edge vortex breakdown is located at the trailing edge of the delta wing. Along with an increase in the angle of attack, the location of the vortex breakdown gradually moved upstream. When α ≈ 40°, the vortex breakdown occurred at 96% chord location from the trailing edge, almost at the apex of the delta wing. At this attitude, the delta wing experiences a full stall, a total loss of lift.

Figure 4
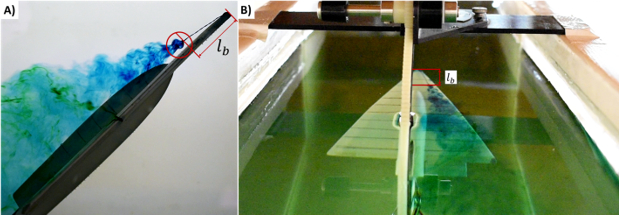
Figure 4. Vortex breakdown identification. A) Side view of vortex breakdown and the distance of vortex breakdown from wing apex lb. B) Top view of the vortex breakdown and the distance from the wing apex lb.

Figure 5
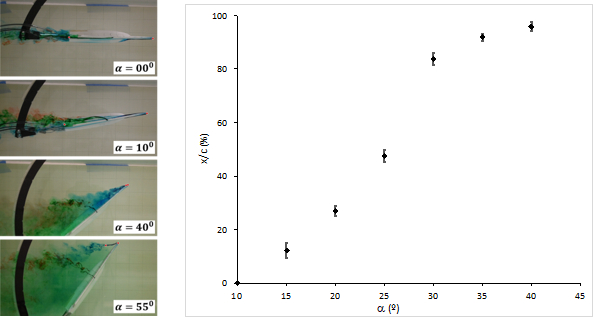
Figure 5. Vortex breakdown location. For angles of attack < 10°, the vortex breakdown occurred downstream of the wing. For angles of attack >40°, the flow separates at the wing tip.

Applications and Summary

By using flow visualization in a water tunnel, the vortex breakdown locations for various angle of attacks in a delta wing were identified. Flow visualization in a water tunnel is performed by injecting dye into specific locations of the flow field. The dye follows the flow, which enables us to observe the flow streaklines. This method is similar to the smoke visualization technique that is used in a wind tunnel. However, the ability to use multiple different dye colors allowed easy visualization of the flow structures and interactions. Another advantage of this method is that it is a low cost technique that supplies 3D information of the flow field.

Dye injection for flow visualization is a classical method with numerous applications. For example, the famous Reynolds experiment on turbulence in pipe flow was executed using dye for the visualization, and it identified laminar and turbulent flow regions in circular pipes. This technique can be used not only to identify the turbulent regions but can also be used to study the mixing that is promoted by turbulence to study other flow structures.

Flow structures, such as vortices and separation bubbles, provide important information about the physics governing phenomena, including the vortex lift. Therefore, this method can be used for flow visualization to aid in the design and optimization of devices affected by flow fields, such as automobiles, ships, tall buildings, and long bridges.

Name Company Catalog Number Comments
Equipment
University Desktop Water Tunnel Rolling Hills Research Corporation Model 0710 Test section 7" x 10" x 18" (WxHxL)
Down Stream Window 7" x 9.5" (WxH)
Flow Velocity 2 to 5 in./sec.
Red dye
Green dye
Blue dye
Video camera
Delta wing SDSU

Transcription

Airplane wings, and their design, are essential to defining performance characteristics of an aircraft. The delta wing is a popular design in high-speed airplanes due to its excellent performance in transonic and supersonic flight regimes.

The delta wing has a small aspect ratio, which is defined as the wingspan divided by the average cord length. For a delta wing, this is 1/2 the root cord length. Other common wing designs, like the rectangular wing and the swept-tapered wing, have higher aspect ratios.

The delta wing also has a high sweep angle, which is defined as the angle between the 25% chord line and the lateral axis. These wing characteristics reduce drag at high subsonic, transonic, and supersonic flight regimes. Importantly, the delta wing has a high stall angle as compared to high aspect ratio wings.

In aerodynamics, the stall angle is the point at which the angle of attack is too high, causing lift to decrease. The high stall angle of a delta wing is due to enhanced lift by a leading-edge vortex over the wing, called vortex lift. Vortex lift occurs when a delta wing is subjected to higher angles of attack, which causes flow separation to take place at the leading edge of the wing, instead of occurring downstream near the trailing edge, as it would for a rectangular wing.

The roll up of the leading-edge vortices induces low pressure on the upper surface of the wing. This pressure differential enhances lift. These vortices start from the wing apex, and progress downstream. At some point, they burst, called vortex breakdown, due to the high adverse pressure gradient.

Once vortex breakdown happens, the vortex cannot induce low pressure anymore. At low angles of attack, the vortex breakdown occurs downstream of the trailing edge. However, as the angle of attack increases, the location of the vortex breakdown moves upstream until a point where the breakdown occurs over most of the wing surface. This reduces lift and causes the wing to stall.

In this experiment, we will use a water tunnel with dye to visualize these vortex patterns on a delta wing model and track the location of vortex breakdown at different angles of attack.

To conduct this experiment, you will need access to a water tunnel. First, obtain three 500-mL containers and fill each at least half full with dye. Use one container for blue dye, another one for green dye, and the last one for red dye.

The delta wing model used in our experiment has tubing already connected to the three dye containers. It also has three dye injection taps, which will disperse a different color dye at three different regions of the wing. Distance measurements are marked on the wing using 1-cm tick marks. The delta wing should already be attached to a C-strut support. Connect it to the tunnel with screws, keeping the yaw angle as close to 0 as possible.

Once the delta wing is in place, fill the water tunnel with water. Make sure you attach a paper with tick marks to provide a reference for the side view. Then, position a camera to capture the top view of the wing. Position a second camera to capture the side view. Now press ‘Record’ on each camera to capture footage of the dye injection and the subsequent vortices.

Manually set the angle of attack to 0 by adjusting the angle on the C-strut. Then, set the water tunnel flow speed to 4 in/s. Once the flow has stabilized, supply pressure to the dye reservoirs using the manual pump.

Observe the streaks of dye, then adjust the dye flow rate using the three knobs to generate a continuous streak. Applying all three colors at once enables us to view the vortex interactions at different regions of the wing. Observe the vortex interactions and identify the vortex roll up and the primary vortex core.

After you’ve recorded at least 10 seconds of the vortex, change the angle of attack to five degrees. Wait for the flow and streak lines to stabilize and record the vortices for at least 10 s.

Repeat the measurement by increasing the angle of attack in 5° increments up to 55°. Record at least 10 s of the streakline vortex pattern each time.

If the water becomes too murky, causing the streak lines to appear dull, close the dye supply and turn off the tunnel. Drain the water and replace it with fresh water before proceeding.

When all of the trials are finished, turn off the camera and close the dye supply. Then turn off the tunnel and drain the water. Be sure to wash the dye off of the tunnel when you are finished.

From the experiment, we can identify vortex breakdowns at different angles of attack. The distance from the wing apex to the vortex breakdown, labeled as LB, is measured, as shown. For simplicity, we reference this distance as a percentage of the chord length from the trailing edge.

Now let’s look at the distance from the trailing edge to the vortex breakdown for each angle of attack. As shown here, the vortex breakdown location gradually moves upstream as the angle of attack increases. When the angle of attack equals 40°, the vortex breakdown occurs at 96% of chord location from the trailing edge. In other words, almost up to the apex of the wing. At this attitude, the delta wing experiences a full stall. In other words, it experiences a total loss of lift.

In summary, we learned how the low aspect ratio and high sweep angle of a delta wing contribute to its vortex lift and delayed stall. We then observed the vortex flow phenomenon on a model delta wing in a water tunnel, and used the vortex breakdown to estimate the stall angle.

Tags

Cite This
JoVE Science Education Database. JoVE Science Education. Flow Visualization in a Water Tunnel: Observing the Leading-edge Vortex Over a Delta Wing. JoVE, Cambridge, MA, (2023).