Metallic and magnetic nanoparticles are widely being used as nanocarriers for drug delivery. And their biodistribution in tissues is essential to evaluate their therapeutic efficacy and safety. Nanocarriers are submicron particles, usually limited to less than 200 nanometers, that can be loaded with therapeutic agents. Because of their size they are able to access many sites and organs in the body. Where the particles end up in the body, called their biodistribution, is an important parameter used to evaluate safety, optimize dosing and improve drug targeting.
In this video the basic principles of targeted drug delivery will be described and a method to evaluate biodistribution using high-resolution imaging techniques will be demonstrated. Other applications of nanoparticle-based carriers will also be discussed.
Let us begin by discussing the fundamentals of nanoparticles and understand why they are being developed as drug carriers.
First, nano-scale particles, which can be either polymeric, liposomal, or metallic are usually biocompatible, meaning they are not harmful or reactive to living tissue and do not elicit an immune response. However nanotoxicology studies must be performed in order to understand how the materials and particle size affect biodistribution in the body.
Second, their small size allows their extravasation through the endothelium at inflammatory sites, such as in tumors, and results in efficient cellular uptake. As cancer cells divide, a vascular supply is needed to supply nutrients and oxygen and support tumor growth. These blood vessels form rapidly and therefore are usually abnormal and effective, containing large gaps in their endothelial lining, resulting in a leaky vasculature and an increase in permeability. The nanoparticles are then able to escape from the bloodstream and accumulate within the tumor microenvironment. This is called passive targeting where the nanocarrier reaches the target organ through a phenomenon known as the EPR effect or the enhanced permeability and retention affect.
Finally, these nanoparticles have a large surface area that can be functionalized with specific ligands such as antibodies or proteins. In active targeting, these ligands can then recognize and bind to receptors that are overexpressed by cells in the tumor site. Specific interactions between the ligands on the nanocarrier surface and the cell receptors triggers receptor-mediated endocytosis and facilitate cellular uptake.
Now that we understand the basics of nanoparticle drug delivery, let’s see a demonstration that uses high-resolution imaging to determine the biodistribution of metallic nanoparticles in a mouse model.
First, prepare the nanoparticles that will be injected into the mouse. Here 30-nanometer barium and titanium particles were used. After the mouse has been anesthetized inject the nanoparticles intravenously via the tail vein. Allow the mouse to recover while they passively target the organs over one, four, and eight weeks.
At the appropriate postinjection time point humanely euthanize the mice according to a AVMA guidelines. Then open the body cavity and surgically remove the organs of interest such as the spleen, kidney, liver, and lungs. And store the organs in 10% phosphate-buffered formalin until analysis.
Now use forceps to transfer the mouse tissue from the fixative into phosphate-buffered saline. Rock the sample for 30 minutes replacing the PBS every 10 minutes to remove excess fixative. Then remove the tissue from the shaker. Add optimal cutting temperature compound which contains water-soluble glycols and resins to a labeled plastic mold.
Dry the tissue with a Kimwipe and then place it in the plastic mold. Fill the mold with OCT compound covering the tissue and place in a plastic bag. Set the bag in a bucket containing dry ice and move to a minus 80-degree Celsius freezer overnight.
The next day remove the sample from the freezer and place on dry ice while transporting to the cryostat. Set the chamber temperature to minus 23 degrees and then transfer the sample to the cryostat. Label slides with the organ type and nanoparticle size of the sample you will be sectioning. Then activate the cryostat. Next cover the cryostat chuck with OCT. Then remove the sample from the mold and place it on top of the chuck. Mount the chuck onto the specimen holder and orient and adjust so the blade will cut straight across the frozen sample. Now bring the sample closer to the blade and set the thickness to 30 micrometers for rough facing. Rotate the hand wheel to slice 30-micrometer thick sections and continue sectioning until an even tissue slice is cut. For fine facing, set the section thickness to seven to eight micrometers and slice the sample.
Collect the sections by pressing a labeled glass slide on the slice. Then add the slides to the rack and air dry at room temperature. Once dry, repeatedly dip the slide rack in 50% ethanol for three minutes to remove the OCT. Transfer the rack to 80% ethanol and dip for three minutes. Then move the rack to a one-to-one ratio of cold methanol to acetone and place in a freezer at minus 20 degrees Celsius. After 10 minutes, remove the slide rack from the freezer and drain it on a paper towel. When dry, place the slides in a slide box and store at minus 20 degrees Celsius until use.
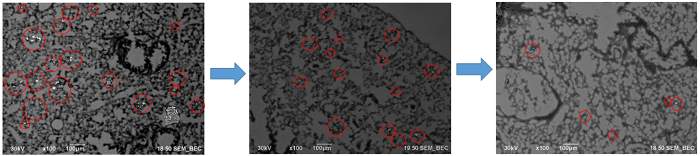
Now let’s image mouse lung tissue that was collected one week postinjection with 30-nanometer barium and titanium particles to determine their biodistribution. To begin, first mount a prepared slide onto the SEM stage. To learn how to sputter coat and prepare your sample, please watch the previous video in this collection. Then load the stage into the SEM chamber. Once the sample is in the field of view, move the sample vertically to a working distance of approximately five millimeters. Turn the electron beam on and select the detector for secondary electrons. Then set the beam accelerating voltage to 25 kiloelectron volts. To begin imaging, zoom in on the sample to a magnification of approximately 1,000 to 2,000X. At this magnification the structure that contains the nanoparticles should be visible even though the nanoparticles are not. This is called the secondary image.
Now engage the backscatter electron detection mode in the SEM module to visualize the nanoparticles. Move the stage in the Z direction to attain the same five-millimeter working distance used above. Adjust the configuration of the backscatter detector and use different voltage biases for the detection panels until the image is crisp. Regions of high contrast, the nanoparticles, should now be visible. This is the backscattered image. Capture and save the image.
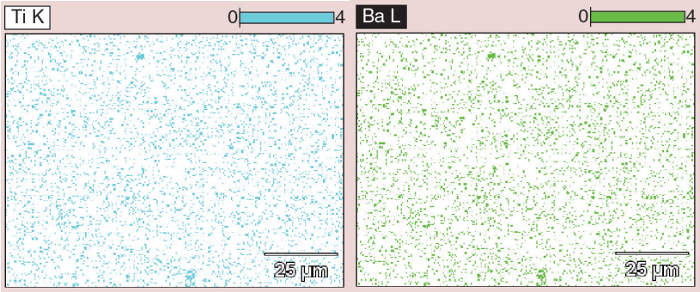
Next, attain energy dispersive X-ray spectroscopy or EDS data of the sample. Zoom in on the high contrast area of a clump of nanoparticles. Then open the second camera in the chamber and lower the EDS into the system. Watch the camera screen to ensure that the EDS approaches, but does not touch the BSD or the electron gun. Then open the microanalysis software and acquire an image. Use the mouse to select a region of interest for further analysis. An X-ray spectrum for that area is then displayed. Here the peaks represent barium and titanium confirming the presence of metallic nanoparticles in the sample. Now open qualitative data analysis software and map the borders of the organ on the slide. Then select and run the appropriate protocol from the menu to create a mosaic image of the organ. This may take several hours.
Once complete, export it as a TIF file and open the file in ImageJ. Adjust the contrast threshold values to highlight areas of very high contrast, the nanoparticles. Then select Analyze Particles to obtain the average number of nanoparticles in the organ and the area percentage of the organ containing nanoparticles.
Repeat all steps in this procedure for remaining tissue samples from other time points and organs. Once all data is collected, compile it into a biodistribution graph.
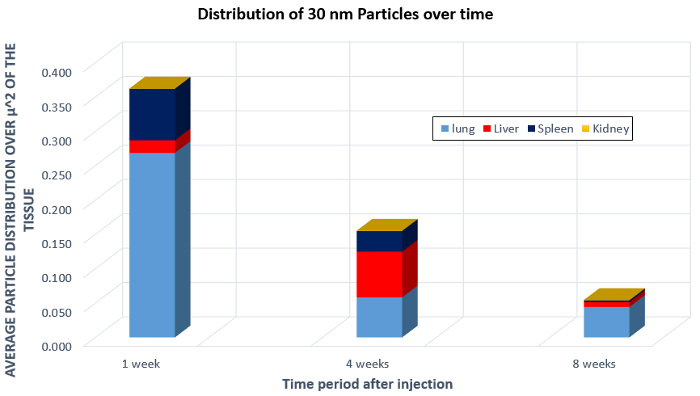
Now let’s analyze the images to determine the biodistribution and learn how the body processed the nanoparticles. First plot the measured particle distribution as a function of time for all samples analyzed. This is the distribution of 30-nanometer size nanoparticles in various mouse organs over time. There is an overall decrease in nanoparticles after eight weeks which indicates clearance of the nanoparticle from the body.
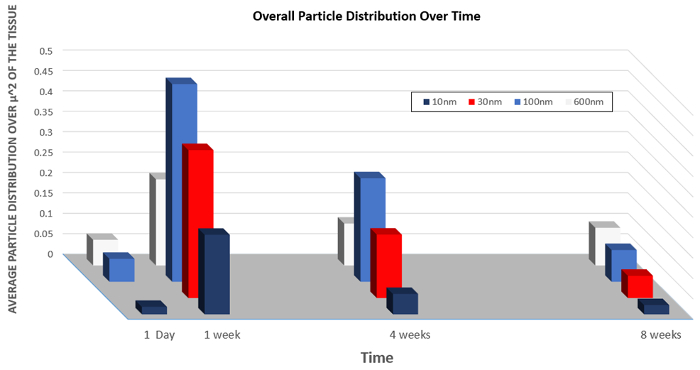
However, there is an increase nanoparticle concentration in the liver after four weeks. This suggests that the body may be processing the 30-nanometer barium and titanium nanoparticles used in this study as a toxin. This analysis can also be performed to evaluate how the size of the nanoparticle affects its biodistribution in the body. Changing the size of the nanoparticles affected the rate of overall cellular uptake and the rate of clearance.
Nanoparticles and nanocarriers are widely used in biomedical research and have applications as imaging, diagnostic and therapeutic agents. Nanoparticles are being developed for use in vaccine delivery against a wide variety of infectious diseases because they protect vaccine components from degradation and maximize immune stimulation. Inter-bilayer cross-linked multi-lamellar vesicles, or ICMVs, are being developed for the induction of antigen-specific CD8 positive T cell responses.
These ICMVs specifically localize in the lymph nodes of mice for efficient vaccine delivery and have elicited robust immune responses against malarial antigens and tumor cells. Metallic nanoparticles are often used as contrast agents in magnetic resonance imaging to visualize tissue structure and function for early disease detection. Iron oxide nanoparticles are useful diagnostic probes. When synthesized with a bisphosphonate moiety, these nanoparticles quickly and selectively accumulate in atherosclerotic plaques and allow their visualization within one hour for a rapid diagnosis.
Recently, loaded nanocarriers have been developed as a strategy to simultaneously detect early-stage cancer and deliver chemotherapeutic agents. These nanocarriers are called theranostics because they integrate diagnostic and therapeutic abilities.
You’ve just watched JoVE’s video on determining the biodistribution of nanodrug carriers. You should now know the basic principles of nanodrug carriers, how to detect nanocarriers in tissue samples using high-resolution SEM, and determine their biodistribution, and some applications of nanoparticles in biomedical engineering.
Thanks for watching.