免疫荧光显微镜:石蜡内嵌组织部分的免疫荧光染色
English
Diviser
Vue d'ensemble
资料来源:托马斯·查菲1,托马斯·格里菲斯2,3,4,凯瑟琳·施韦特费格1,3,4
1明尼苏达大学明尼阿波利斯分校实验室医学和病理学系,MN 55455
2明尼苏达大学泌尿科,明尼阿波利斯,MN 55455
3共济会癌症中心,明尼苏达大学明尼阿波利斯分校,MN 55455
4明尼苏达大学明尼阿波利斯分校免疫学中心,MN 55455
组织部分的病理分析可用于更好地了解正常组织结构,并有助于我们了解疾病机制。组织活检,无论是从患者还是从实验性体内模型,通常通过固定在甲醛或甲醛和嵌入石蜡中来保存。这允许长期存储和组织被分割。使用微缩图,将组织切成薄(5 μm)部分,并且这些截面粘附在玻璃玻片上。组织部分可以沾染抗体,从而检测组织部分的特定蛋白质。与荧光素(也称为氟铬)结合的抗体染色 – 当激光激发时以特定波长发出光的化合物 – 称为免疫荧光。检测部分内蛋白质的能力可以提供信息,如细胞类型异质性在组织内,激活特定信号通路,和生物标志物的表达。根据所使用的荧光光和可用于分析的显微镜类型,可以使用多种颜色,从而可以多路分析目标。
以下协议概述了石蜡嵌入式组织部分的免疫荧光染色所涉及的基本步骤。需要注意的是,该协议将不包括关于组织固定、石蜡嵌入过程或组织切片的任何细节。一旦组织被分割并放置在玻璃幻灯片上,它们就会通过一系列分级乙醇(EtOH)孵育物进行补水。这些部分用阻塞试剂孵育,以减少抗体与组织部分的非特异性结合。然后,用可能或可能不会直接标记荧光剂的原抗体孵育这些部分。如果原抗体没有直接标记,则用标有荧光剂的次级抗体孵育这些部分。不同的抗体可能需要不同的染色条件,因此包括优化抗体的建议。洗涤后去除所有未结合的抗体后,将幻灯片与含有DAPI的介质安装,以荧光标记细胞核。安装介质干燥后,可以使用显微镜使用激光对幻灯片进行成像,激光可以检测不同的荧光道。
Procédure
Résultats
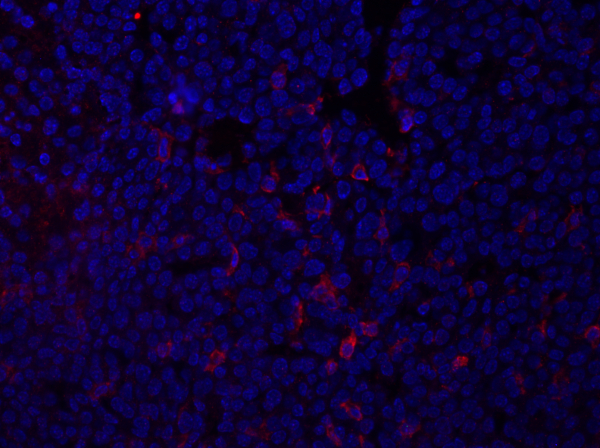
Figure 1: F4/80 staining of a mammary tumor section. Following fixation, a mouse mammary tumor was sectioned and stained with anti-F4/80 and mounted using a DAPI-containing mounting media. Staining is shown by cell surface F4/80 staining in red. Please click here to view a larger version of this figure.
The data obtained from the imaging will provide information regarding the intensity and localization of expression of the protein-of-interest within the tissue section. Depending upon the protein being examined, these data could also provide information regarding the frequency of specific cell populations within the tissue section. This can be quantified by counting the number of positively stained cells and comparing with total cell population.
Applications and Summary
Immunofluorescence allows for the investigation of protein expression and localization within the context of a tissue section. This technique can be used to understand how tissues change in the context of disease by examining protein localization or cell number in normal and diseased tissues. Changes in localization or in expression patterns can be determined and linked to specific attributes of the samples.
References
- Im K, Mareninov S., Diaz MFP, Yong WH. An Introduction to Performing Immunofluorescence Staining. Yong W. (eds) Biobanking. Methods in Molecular Biology. 1897, Humana Press, New York, NY (2019)
- Ramos-Vara JA. Principles and Methods of Immunohistochemistry. Gautier JC. (eds) Drug Safety Evaluation. Methods in Molecular Biology. 1641, Humana Press, New York, NY (2017)
- Donaldson JG. Immunofluorescence Staining. Current protocols in Cell Biology. 69 (1):1 4.3.1-4.3.7. (2015)
Transcription
The function of a protein in a cell is largely dependent on its proper localization within the cell. Immunofluorescence microscopy is a method by which a protein can be visualized inside cells using fluorescent dyes. A fluorescent dye is a fluorophore, that is a molecule that absorbs light energy at a specific wavelength by a process called excitation, and then immediately releases the energy at a different wavelength, known as emission.
Fluorescent dyes are conjugated to a target-specific antibody and introduced into cultured cells or tissue by immunostaining. When this primary antibody binds to the protein of interest, the protein gets labeled with the fluorescent dye. Alternatively, the fluorescent dye can be conjugated to a secondary antibody, instead of the primary antibody, and the secondary antibody binds to the protein primary antibody complex to label the target. After that, the sample is sealed in an antifade mounting medium to preserve the fluorescence labeling and is then ready for imaging on a fluorescence microscope.
A fluorescence microscope is equipped with a powerful light source. The light beam first passes through an excitation filter, which allows only the light at the excitation wavelength to pass through. The excitation light then reaches a specialized mirror, called a dichroic mirror or a beam splitter, which is designed to selectively reflect the excitation wavelength towards an objective lens. The lens then focuses the light onto a small region in the sample. Upon reaching the sample, the light excites the fluorophores, which then emit the light energy at a different wavelength. This light is transmitted back through the objective lens to the dichroic mirror. Since the emission wavelength is different from the excitation wavelength, the dichroic mirror allows the emission light to pass through. Then, it goes through a second filter, called the emission filter, which eliminates light from any other wavelengths that may be present. After that, the light rays now reach the eyepiece or camera, where they present a magnified image created from the emitted light from the specific fluorophores. This image represents the location of the protein of interest within the cell.
DNA binding fluorescent dyes are often used along with immunostaining to label nuclei as a point of reference within the cells. Multiple different fluorophores, with different excitation emission wavelengths, can be used for different proteins within the same sample to compare localization of the proteins.
This video demonstrates the procedure for immunofluorescent staining of a protein of interest in a tissue sample followed by imaging the sample on a fluorescence microscope.
Before beginning the staining process, the sections, which were dehydrated during the embedding process, need to be rehydrated. To do this, first, place the slides into a slide holder and then completely submerge the slides in 100% Xlene isomers. Allow the slides to incubate for three minutes. Then, remove the slides from the container, wipe off any excess Xylene with a paper towel, and place them into a new Xylene bath in a fresh container, for a further three minutes. Repeat this incubation each time in a new container with fresh Xylene and wiping down the slides with paper towels before transferring to the new container, for a total of three incubations. Next, incubate the sections in a series of graded ethanol solutions, starting with 100% ethanol for two minutes. Wipe off the slide rack with a paper towel, and transfer the slides to a new container of 100% ethanol for another two minutes. Continue the cycle of washing, wiping excess ethanol with a paper towel, and transferring the slides to a new bath, following the indicated concentrations of ethanol for the specified time. After the final ethanol wash, shake off the excess solution and incubate the slides in 1X PBS for five minutes.
To begin the staining process, first, circle the sections with a PAP pen to identify the minimal area that the buffers need to cover. Once the sections are clearly marked on the slide, add 100 microliters of blocking buffer to each slide, making sure to cover the entire section surface. After the tissues are covered in blocking buffer, place the slides in a humidified chamber. Leave the slides to incubate for one hour at room temperature.
Following the desired incubation time, remove the blocking buffer by draining it off the slide. Next, dilute the primary antibody in blocking buffer. For a 1:100 dilution, add 990 microliters of blocking buffer to a 1.5 milliliter centrifuge tube, followed by 10 microliters of the primary antibody to the same tube. Label one slide as a control and then add 100 microliters of blocking buffer. This control will help identify any non-specific binding of the secondary antibody. Now, add 100 microliters of primary antibody buffer to the remaining slides. Incubate the sections overnight in a humidified chamber at four degrees celsius, in the dark.
Following the overnight incubation, remove the sections from the chamber and drain the primary antibody off each slide and the blocking buffer from the control. Place the slides into a slide rack and then wash them three times in 1X PBS for ten minutes each. While the slides are washing in 1X PBS, dilute the secondary antibody in blocking buffer. For a 1:200 dilution, add 995 microliters of blocking buffer to a 1.5 milliliter tube, followed by five microliters of the secondary antibody to the same tube. Add the secondary antibody to all of the sections, including the control, and incubate them for one hour in a humidified chamber protected from light. When the timer sounds, remove the slides from the incubator. Drain the secondary antibody off the sections. Once the secondary antibody is removed, place the slides in a slide rack and then completely submerge the slides in 1X PBS for 10 minutes, protected from light. Repeat this wash three times, using fresh 1X PBS for each wash. Following the washes, add two to three drops of mounting media containing DAPI to each slide and place a glass coverslip on the samples. Allow the slides to dry overnight in a dark place before imaging the sections using a fluorescent scope.
During imaging, the details of image capture will depend upon the specific microscope and software available. However, in this particular example, the software Leica Application Suite, Version 3. 8, is used to perform the analysis. Using this program, click on the Acquire tab and in Image Overlay Acquisition mode, enable both DAPI and RFP. Next, adjust the Exposure, Gain, and Gamma for both DAPI and RFP, by taking an initial using the default settings defined by the software, and then optimizing for brightness by modifying the exposure time and the gain, keeping in mind that minimal optimal settings are desirable to avoid image saturation and photobleaching of the samples. Gamma can be modified to optimize darker areas of an image.
Once the settings are adjusted, press the Acquire Overlay button to create overlay images of the DAPI and RFP exposures. This example image, captured using the demonstrated technique, shows a mouse mammary tumor section, stained with the antibody F4/80, which detects an antigen, depicted in red, on macrophages and other myeloid cells. Since DAPI-containing mounting media was used, nuclei are shown in blue. The data from the imaging will provide information regarding the intensity and localization of the protein within the tissue section.
For example, in the image of the tumor stained with F4/80, cell surface staining of this antigen is observed. These data can also provide information regarding the frequency of specific cell populations within the tissue section. This can be quantified by counting the number of positively stained cells, here shown in red, and comparing that with the total cell population, shown in blue, and calculating the frequency using the following equation.