Un abonnement à JoVE est nécessaire pour voir ce contenu.  Connectez-vous ou commencez votre essai gratuit.
Confocal Fluorescence Microscopy: A Technique to Determine the Localization of Proteins in Mouse Fibroblasts
  • 00:01Concepts
  • 03:52Preparing Cells for the Antibody Staining
  • 05:35Antibody Staining
  • 06:52Mounting Coverslips
  • 07:47Confocal Imaging
  • 11:07Résultats

מיקרוסקופיית פלואורסצנטיות קונפוקלית: טכניקה לקביעת לוקליזציה של חלבונים בפיברובלסטים של עכברים

English

Diviser

Vue d'ensemble

מקור: דומיניק ר. בולינו1, אריק א. לגנצוב2, טוניה ג’יי ווב1
1 המחלקה למיקרוביולוגיה ואימונולוגיה, בית הספר לרפואה של אוניברסיטת מרילנד ומרכז הסרטן המקיף מרלן וסטיוארט גרינבאום, בולטימור, מרילנד 21201
2 המרכז להנדסה וטכנולוגיה ביו-רפואית, בית הספר לרפואה של אוניברסיטת מרילנד, בולטימור, מרילנד 21201

מיקרוסקופיית פלואורסצנטיות קונפוקלית היא טכניקת הדמיה המאפשרת רזולוציה אופטית מוגברת בהשוואה למיקרוסקופיה אפיפלואורסצנטית קונבנציונלית “רחבת שדה”. מיקרוסקופים קונפוקליים מסוגלים להשיג רזולוציה אופטית משופרת x-y באמצעות “סריקת לייזר” – בדרך כלל קבוצה של מראות מבוקרות מתח (מראות גלוונומטר או “גלבו”) המכוונות את תאורת הלייזר לכל פיקסל של הדגימה בכל פעם. חשוב מכך, מיקרוסקופים קונפוקליים משיגים רזולוציה z-צירית מעולה באמצעות חור סיכה כדי להסיר מאורת מיקוד שמקורה במיקומים שאינם במישור z נסרקים, ובכך מאפשרים לגלאי לאסוף נתונים ממישור z שצוין. בגלל רזולוציית z גבוהה בר השגה במיקרוסקופיה קונפוקלית, ניתן לאסוף תמונות מסדרה של z-planes (המכונה גם z-stack) ולבנות תמונה תלת-ממדית באמצעות תוכנה.

לפני דיון במנגנון של מיקרוסקופ קונפוקלי, חשוב לשקול כיצד מדגם אינטראקציה עם אור. האור מורכב מפוטונים, חבילות של אנרגיה אלקטרומגנטית. פוטון הפוחת במדגם ביולוגי יכול לקיים אינטראקציה עם המולקולות המרכיבות את המדגם באחת מארבע דרכים: 1) הפוטן אינו מתקשר ועובר דרך המדגם; 2) הפוטן משתקף / מפוזר; 3) הפוטון נספג על ידי מולקולה והאנרגיה הנספגת משתחררת כחום באמצעות תהליכים הידועים בשם ריקבון לא-רעיקטיבי; ו-4) הפוטן נספג והאנרגיה נספגת במהירות כפוטון משני בתהליך המכונה פלואורסצנטיות. מולקולה שהמבנה שלה מאפשר פליטת פלואורסצנטיות נקראת פלואורופור. רוב הדגימות הביולוגיות מכילות פלואורופורים אנדוגני זניחים; לכן פלואורופורים אקסוגניים חייבים לשמש כדי להדגיש תכונות של עניין במדגם. במהלך מיקרוסקופיית פלואורסצנטיות, המדגם מואר באור של אורך הגל המתאים לספיגה על ידי הפלואורופור. עם ספיגת פוטון, פלואורופור הוא אמר להיות “נרגש” ואת תהליך הקליטה מכונה “עירור”. כאשר פלואורופור מוותר על אנרגיה בצורה של פוטון, התהליך מכונה “פליטה”, והפוטון הנפלט נקרא פלואורסצנטיות.

קרן האור המשמשת לרגש פלואורופור מתמקדת בעדשה האובייקטיבית של מיקרוסקופ ומתכנסת ב”נקודת מוקד “שבה היא ממוקדת באופן מקסימלי. מעבר לנקודת המוקד האור שוב מתפצל. ניתן לדמיין את הקורות הנכנסות והיוצאות כצמד קונוסים הנגעים בנקודת המוקד (ראו איור 1, החלונית השמאלית). תופעת עקיפה מטילה מגבלה על מידת ההדוקה של קרן אור יכולה להיות ממוקדת – הקרן מתמקדת למעשה בנקודה בגודל סופי. שני גורמים קובעים את גודל נקודת המוקד: 1) אורך הגל של האור, ו -2) את יכולת איסוף האור של העדשה האובייקטיבית, המאופיינת בצמצם המספרי שלה (NA). המוקד “ספוט” משתרע לא רק במישור x-y, אלא גם בכיוון z, והוא למעשה נפח מוקד. הממדים של אמצעי אחסון מוקדי זה מגדירים את הרזולוציה המרבית הניתנת להשגה על-ידי הדמיה אופטית. למרות שמספר הפוטונים הוא הגדול ביותר בנפח המוקד, נתיבי האור החרוטיים מעל ומתחת למוקד מכילים גם צפיפות נמוכה יותר של פוטונים. כל פלואורופור בנתיב האור יכול אפוא להתרגש. במיקרוסקופיה אפיפלואורסצנטית קונבנציונלית (רחבת-שדה), פליטה מפלואורופורים מעל ומתחת למישור המוקד תורמת פלואורסצנטיות מחוץ לפוקוס (“רקע מעורפל”), מה שמפחית את רזולוציית התמונה ואת הניגודיות, כפי שמדגים באיור 1, כאשר הקובייה האדומה מייצגת את פליטת הפלורופור מעל המישור המוקדי (כוכב אדום) שגורמת לפלאורסצנטיות מחוץ לפוקוס (מימין למעלה). בעיה זו משופכת במיקרוסקופיה קונפוצלית, עקב ניצול של חור סיכה. (איור 2, מימין למטה). כפי שמתואר באיור 3, חור הסיכה מאפשר לפליטות שמקורן במוקד להגיע לגלאי (משמאל), תוך חסימת הפלואורסצנטיות מחוץ לפוקוס (מימין) מלהגיע לגלאי, ובכך לשפר הן את הרזולוציה והן את הניגודיות.

Figure 1
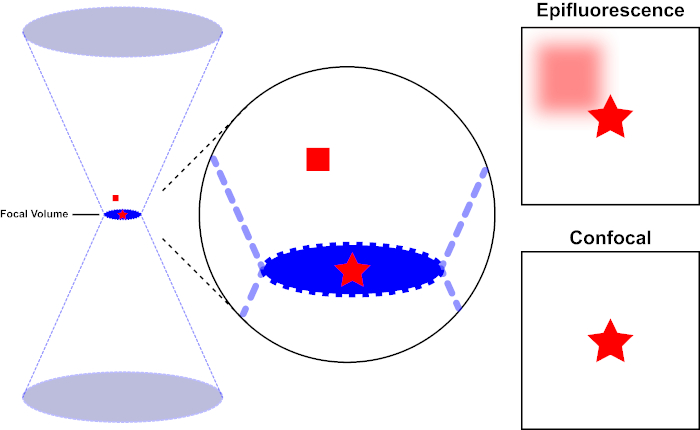
איור 1. רזולוציה אופטית של אפיפלואורסצנטיות לעומת מיקרוסקופיה קונפוקלית. אנא לחץ כאן כדי להציג גירסה גדולה יותר של איור זה.

קרן האור המשמשת לרגש פלואורופור מתמקדת בעדשה האובייקטיבית של מיקרוסקופ ומתכנסת בנפח מוקד ואז מתפצלת (משמאל). הכוכב האדום מייצג את מישור המוקד של דגימה שתמונה בעוד הריבוע האדום מייצג פליטת פלואורופור מעל מישור המוקד. בעת לכידת תמונה של מדגם זה באמצעות מיקרוסקופ אפיפלואורסצנטי, הפליטה מהכיכר האדומה מחוץ לפוקוס תהיה גלויה ותתרום ל”רקע מעורפל ” (מימין למעלה). למיקרוסקופים קונפוקליים יש חור סיכה המונע גילוי אור הנפלט מחוץ למישור המוקד, ומבטל את “הרקע המעורפל” (מימין למטה).

Figure 1
איור 2. אפקט חור הסיכה במיקרוסקופיה קונפוקלית. אנא לחץ כאן כדי להציג גירסה גדולה יותר של איור זה.

למרות שהעוצמה הגבוהה ביותר של אור העירור נמצאת במוקד העדשה (שמאל, אליפסה אדומה), חלקים אחרים של המדגם שאינם במוקד (ימין, כוכב אדום) יקבלו אור ופלואורסצ’ה. כדי למנוע אור הנפלט מאזורים אלה מחוץ לפוקוס כדי להגיע לגלאי, מסך עם חור סיכה נמצא מול הגלאי. רק האור בפוקוס (משמאל) הנפלט ממטוס המוקד מסוגל לנוע דרך חור הסיכה ולהגיע לגלאי. האור מחוץ לפוקוס (מימין) נחסם עם חור הסיכה ואינו מצליח להגיע לגלאי.

Figure 1
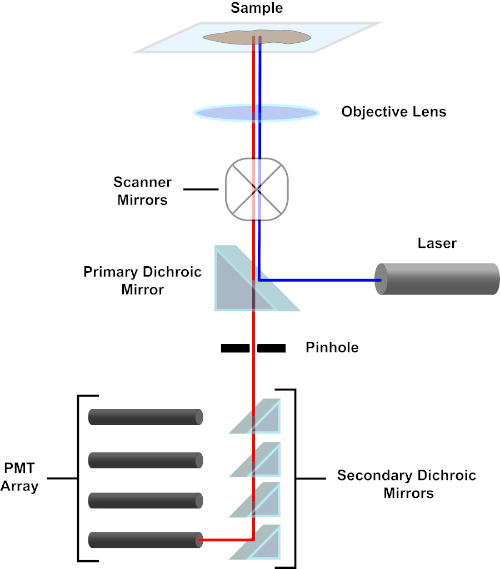
איור 3. רכיבים עיקריים של מיקרוסקופ סריקת לייזר קונפוקלי. אנא לחץ כאן כדי להציג גירסה גדולה יותר של איור זה.

למען הפשטות, התיאור המכניסטי של מיקרוסקופ קונפוקל יהיה מוגבל לזה של ניקון אקליפס Ti A1R. למרות ייתכנו הבדלים טכניים קלים בין מיקרוסקופים קונפוקליים שונים, A1R משמש היטב כמודל טוב לתיאור פונקציית מיקרוסקופ קונפוקלית. קרן אור העירור, המיוצרת על ידי מערך של לייזרי דיודה, משתקפת על ידי המראה הדיכרואית העיקרית אל המטרה, הממקדת את האור על הדגימה המצולמת. המראה הדיכרואית הראשית משקפת באופן סלקטיבי את אור העירור ומאפשרת לאור באורכי גל אחרים לעבור דרכם. לאחר מכן, האור נתקל במראות הסריקה שסוחפות את קרן האור על פני הדגימה באופן x-y, ומאירות פיקסל יחיד (x,Y) בכל פעם. פלואורסצנטיות הנפלטת על ידי פלואורופורים בפיקסל המואר נאספה על ידי העדשה האובייקטיבית ועוברת דרך המראה הדיכרואית הראשית כדי להגיע למערך של צינורות פוטומולטיפלייר (PMTs). מראות דיכרואיות משניות מכוונות את נורית הפליטה אל ה-PMT המתאים. אור העירור הפזור על ידי המדגם בחזרה למטרה משתקף על ידי המראה הדיכרואית הראשית בחזרה לכיוון הדגימה, ובכך נמנע מלהיכנס לנתיב אור הזיהוי ולהגיע ל-PMTs (ראו איור 3). זה מאפשר את הפלואורסצנטיות החלשה יחסית להיות כימות ללא זיהום על ידי אור מפוזרים מן קרן אור העירור, שהוא בדרך כלל סדרי גודל אינטנסיביים יותר מאשר פלואורסצנטיות. מכיוון שחור הסיכה חוסם אור מחוץ לנפח המוקד, האור המגיע לגלאי מגיע ממטוס zצר ונבחר. לכן, ניתן לאסוף תמונות מסדרה של מטוסי zסמוכים; סדרת תמונות זו מכונה לעתים קרובות ‘z-stack’. באמצעות התוכנה המתאימה, z-stack ניתן לעבד כדי ליצור תמונה 3D של הדגימה. יתרון מסוים של מיקרוסקופיה קונפוקלית הוא היכולת להבחין בין לוקליזציה תת-תאית של כתמים. לדוגמה, ההבחנה בין מכתים ממברנה מכתמים תאיים, וזה מאוד מאתגר עם מיקרוסקופיה אפיפלואורסצנטית קונבנציונלית (1, 2, 3).

הכנת מדגם היא היבט חשוב של הדמיה קונפוקלית. חוזק של טכניקות מיקרוסקופיה אופטית הוא הגמישות לתמונה של תאים חיים או קבועים. בעת ניסיון לייצר תמונות תלת-ממד, בגלל מספר התמונות שיש לרכוש עבור z-stack, הקושי לשמור על בריאות התא, ואת התנועה של תאים חיים organelles שלהם, השימוש בתאים קבועים אופייני. ההליך לתיקון והכתמת תאים לפלואורסצנטיות קונפוצלית דומה לזה המשמש באופן קונבנציונלי באימונופלואורסצנטיות. לאחר תרבית בשקופיות הקאמריות או על כיסויים, התאים קבועים באמצעות paraformaldehyde כדי לשמר את המורפולוגיה התאית. כריכת נוגדנים לא ספציפית נחסמת באמצעות אלבומין בסרום בקר, חלב או סרום רגיל. על מנת לשמור על הספציפיות של הנוגדנים המשניים, הפתרון המשמש לא צריך להיות מאותו מין שבו נוצרו הנוגדנים העיקריים. התאים דוגרים בנוגדנים ראשוניים שקושרים את האנטיגן של עניין. בעת סימון מספר מטרות תאיות, הנוגדנים העיקריים חייבים להיגזר כל אחד ממין אחר. נוגדנים המתייגים אנטיגן קשורים לאחר מכן בנוגדנים משניים מצומדים פלואורופור. נוגדנים משניים מצומדים פלואורופור יש לבחור כך שהם תואמים לאורכי הגל של עירור לייזר זמין במיקרוסקופ הקונפוקלי. כאשר מדמיינים אנטיגנים מרובים, ספקטרום העירור/ הפליטה של הפלורופורים צריך להיות שונה מספיק, כך האותות שלהם ניתן להפלות על ידי ניתוח מיקרוסקופי. הדגימה המוכתמת מותקנת לאחר מכן על שקופית להדמיה. מדיום הרכבה משמש למניעת התייבשות של פוטו-דגימות. אם תרצה, ניתן להשתמש במדיום הרכבה המכיל כתם נגד גרעיני (למשל DAPI או Hoechst) (4).

בפרוטוקול הבא, פיברובלסטים עכבר transfected כדי לבטא CD1d (LCD1) היו מוכתמים בנוגדנים המזהים CD1d ו CD107a (LAMP-1). CD1d הוא קומפלקס היסטו-תאימות גדול 1 (MHC 1)דמוי קולטן נוכח על פני השטח של אנטיגן מציג תאים המציגים אנטיגנים שומנים בדם. LAMP-1 (חלבון ממברנה הקשורים ליזומלית-1) הוא חלבון טרנס-מברן הנמצא בעיקר בממברנות ליזומליות. עבור מצגת אנטיגן נכונה, CD1d נסחר דרך תא ליסומלי pH נמוך, כך LAMP-1 משמש כסמן של התא הליסומלי עבור פרוטוקול זה. על ידי בדיקות תאי LCD1 עם אנטי CD1d ו- ANTI-LAMP-1 שיוצרו במינים שונים, נוגדנים משניים עם פלואורופורים ייחודיים יכולים לשמש כדי לקבוע את לוקליזציה של כל חלבון בתא והאם CD1d קיים בתאים ליזוזום חיובי LAMP-1.

Procédure

1. חומרים מאגרי חוצץ כביסה: 1 X תמיסת מלח סטרילית חוצצת פוספט (PBS) ללא סידן או מגנזיום מאגר קיבעון: 1% paraformaldehyde ב- PBS מאגר פרמזביליזציה: 0.1% טריטון X-100 ב- PBS חוסם חוצץ: 1% אלבומין סרום בקר ב- PBS בינוני לצמיחת תאים: DMEM בתוספת סרום בקר עוברי 10% (…

Résultats

In this experiment, mouse fibroblasts expressing the surface glycoprotein gene CD1d were fixed, immunostained and imaged on a confocal microscope. A representative image obtained using the above protocol is shown in Figure 4. In the top panel of A, single-channel images showing the staining pattern of each individual target are presented. These images comprise a single section (slice) of the z-stack captured. The right panel shows DAPI staining of nuclei of the cells. The center panels show CD1d stained in red and LAMP-1, a lysosomal marker, stained in green. The left panel is a composite image where the three different channels are merged. The appearance of yellow results from overlap of the red and green channels, and indicates an area where CD1d and LAMP-1 are co-localized. The results of the staining confirm that CD1d is localized in the LAMP-1+ endosomal compartments. There are also areas where only one color is present, which indicates the presence of CD1d or LAMP-1 without co-localization. The bottom panel of A shows a 3D rendering of the cells constructed from images captured in the z-stack.

Panel B shows a slice out of the z-stack at 100x magnification demonstrating the expression patterns of these two proteins in greater detail. The pink outlined box on the right side of the image displays the cross section of the x-coordinate designated by the pink line in the image, which represents the side view at the pink line. Similarly, the blue outlined box on the bottom of the image shows the cross section of the y-coordinate designated by the blue line in the image, which represents the front view at the blue line. The 3D rendering of the z-stack image enables users to view the image in 3D, visualizing all the x, y and z planes.

Figure 4
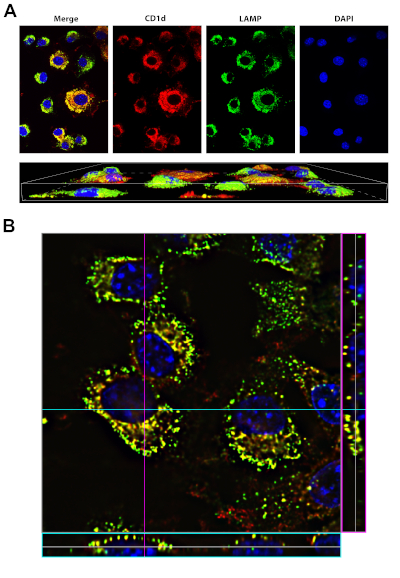
Figure 4: Staining of CD1d and LAMP1. Please click here to view a larger version of this figure.

A, top panel: LCD1 cells were fixed, permeabilized and stained with antibodies to CD1d (red) and LAMP-1 (green, a marker of the lysosomal compartment). DAPI (blue, was used to visualize the nucleus). The merge (left panel) shows that CD1d is localized in the LAMP-1 positive late endosomal/lysosomal compartment (yellow).
A, bottom panel: 3D rendering of the same cells in top panel. Images were acquired using a 40x oil-immersion objective on the Nikon Eclipse Ti, using the NIS Elements Advanced Research software.
B: 100x image of LCD1d cells stained as in A, with stack information for a particular y-coordinate (denoted by the blue line) on the bottom of the image (blue box). The stack information for a particular x-coordinate (denoted by the pink line) is shown on the right side of the image (pink box).

Applications and Summary

Confocal fluorescent staining is a relatively simple procedure that results in extremely high-quality images of specimens that are prepared in a similar way as for conventional fluorescence microscopy. In brief, samples are fixed, permeabilized, then blocked. Primary antibodies against a protein or proteins of interest are allowed to bind, then fluorophore-conjugated secondary antibodies are used to visualize the staining. Confocal fluorescence microscopy has applications in many areas of research. For example, by staining for markers of sub-cellular organelles along with a protein of interest, confocal microscopy can be used to determine the subcellular locations of diverse proteins. Compared to conventional fluorescence microscopy, confocal imaging can more effectively distinguish between cell surface and intracellular location of a protein. In addition, confocal imaging can also be used to determine whether two proteins co-localize within the cell. Although not outlined in this protocol, confocal fluorescence microscopy also can be performed on live cells to detect dynamic changes.

Video 1
Video 1: Video created in NIS Elements Advanced Research software, highlighting the ability to move through the 3D rendering of the images. Please click here to view this video (Right click to download).

References

  1. Claxton, N. S., Fellers, T. J. and Davidson, M. W. Laser scanning confocal microscopy. Department of Optical Microscopy and Digital Imaging, National High Magnetic Field Laboratory, Florida State University, 37 p., Unpublished (2010). Available at- http://www.vertilon.com/pdf/PP6207.pdf.
  2. Ojcius, D. M., Niedergang, F., Subtil, A., Hellio, R. and Dautry-Varsat, A. Immunology and the confocal microscope. Research in Immunology, 147 (3),175-88 (1996).
  3. Paddock, S. W. and Eliceiri K. W. Laser scanning confocal microscopy: history, applications, and related optical sectioning techniques. Methods in Molecular Biology, 1075, 9-47 (2014).
  4. Hoff. F. How to prepare your specimen for immunofluorescence microscopy. Philipps University Marburg, Institute of Cytobiology and Cytopathology, Germany. (2015) Available at- http://www.leica-microsystems.com.

Transcription

Confocal fluorescence microscopy is a specialized imaging technique for localization of a protein or antigen of interest in a cell or tissue sample by labeling the antigen with an antibody-conjugated fluorescent dye and detecting the fluorescent signal. It offers higher spatial resolution than wide-field fluorescence microscopy, with the help of two pinholes placed at the focal planes of the objective lens, giving it the name confocal. It enables users to visualize the staining at a subcellular level, such as the differentiation between surface membrane staining from intracellular staining.

A confocal microscope follows a similar basic principle as a classic fluorescence microscope. The beam from a light source, usually a laser for confocal, is reflected by a dichroic mirror and focused by an objective lens on the sample. This light excites the fluorophores to emit a different wavelength, which travels back through the objective lens and dichroic mirror to a camera or eyepiece.

The enhanced resolution of a confocal microscope is mainly due to the presence of two pinholes, which are very small holes for light to pass through on the excitation and emission light paths. The pinholes are strategically placed at the focal plane of the objective lens. Now, let’s switch to a side view schematic of the microscope arrangement to review the light path. After passing through the excitation pinhole, the excitation light beam has the effect of originating from a focal point, which enables the objective lens to then focus the light to a point on the sample as well. The emission beam from this focal point converges at the emission pinhole, which allows it to pass through. Now during excitation, fluorophores within the light path, above and below the focal point, are also slightly excited. While the emission light originating from the focal point passes through the pinhole, the emissions from the out-of-focus points converge before or after the emission pinhole, and are hence blocked, resulting in reduced background fluorescence.

The excitation-emission-detection cycle needs to be repeated for each imaging point in the region of interest, which can be done in a few different ways. For example, laser scanning confocal uses galvanometer scanning mirrors, which deflect the excitation light at different angles. Hence, sweeping the light beam across the specimen in the XY plane. Spinning disc confocal uses a disc with an array of pinholes, which rotates to shift the arrangement of the pinholes. This enables users to illuminate multiple small imaging points in the sample each time, gradually covering the whole area as the disc rotates. As a result of the pinholes, the XY image at the detector represents a narrow Z plane. Therefore, images can be collected from a series of consecutive Z planes, often referred to as a Z stack. From these images, an appropriate software can generate a 3D depiction of the fluorescence signal pattern in the sample.

In this protocol, you will observe immunostaining of mouse fibroblasts, followed by imaging on a confocal microscope to differentially visualize a cell surface protein and a lysosomal protein.

To begin, using sterile techniques, resuspend the cells of interest in 500 microliters of growth media per well, and then seed them into the wells of a four-well chamber slide. Here, we are using mouse fibroblasts that were transfected to express the antigen-presenting molecule, CD1d. To allow cells to adhere to the glass, place the chamber slide in a 5% carbon dioxide incubator at 37 degrees Celsius, and incubate overnight. In the morning, aspirate the media from each well, and then wash the cells once with 500 microliters of PBS for a few seconds.

To fix the cells, add 500 microliters of 1% paraformaldehyde solution into each well, and incubate for 15 minutes at room temperature. After the incubation, collect the paraformaldehyde into an appropriate hazardous liquid waste container, and then remove any remnants of the fixative by washing the cells three times with PBS for a few seconds.

To allow antibody penetration into the cells, add 500 microliters of permeabilization buffer to each well, and incubate on the bench for 15 minutes at room temperature. After permeabilization, wash the cells briefly three times with 500 microliters of PBS. Next, add 500 microliters of blocking buffer to each well, and incubate for one hour at four degrees Celsius to prevent nonspecific antibody binding.

Prepare the primary antibodies, anti-CD1d and anti-LAMP-1, at appropriate working concentrations. Then, aspirate the buffer from the wells and cover the cells in each well with 500 microliters of diluted primary antibody solution and then incubate the slide on a flat surface overnight at four degrees Celsius. The next morning, dilute the secondary antibodies, in this case an anti-mouse and anti-rat antibody with distinct fluorescent tags, in blocking buffer to appropriate working concentrations. Next, aspirate the primary antibody solution from the wells and then wash the cells four times with 500 microliters of PBS. Then, add 500 microliters of the diluted secondary antibody solution to each well, and incubate at room temperature for one hour in the dark. After the incubation, aspirate the secondary antibody solution and wash the wells four times with 500 microliters of PBS to remove any unbound secondary antibody.

To mount the samples after the final wash, carefully detach and remove the chambers from the slide. To remove the residual PBS, hold the slide at an angle over a delicate task wipe, and remove the fluid from the edges without touching the cells. Once the excess PBS is removed, add one drop of antifade mounting medium, containing the nuclear stain DAPI, onto each section of cells. Next, take a 20-by-60-millimeter coverslip, and using just fingertips start lowering the coverslip slowly on either edge, taking care to avoid bubble formation over the cells. Wipe off any extra mounting medium on the slides with a delicate task wipe and store the slides in the dark at room temperature for up to a week.

To begin imaging the cells, first click on the NIS software icon on the desktop. Once in the control window, click on the TiPad tab at the top, and choose the desired objective for imaging. Then, load the slide with cells onto the stage, and center it beneath the lens. Next, on the A1plus Compact GUI tab next to the TiPad tab, set up the lasers appropriate for the fluorophores used. Click on the gear symbol to open the dye and spectral settings menu. Once the dye and spectral settings menu is open, select the channels needed and set the laser for each channel. Then, select the appropriate emissions in the drop down menu under the first dichroic mirror. Next, under A1plus Compact GUI window, click on Ch.Series to set up the line channel series, which sets up whether the lasers used will fire on the sample simultaneously or sequentially.

After that, start scanning by clicking the arrow-tip icon on the top. At this point, while the imaging is live, under A1plus Compact GUI window, click on the sliding scale, and modify the pinhole size to assure limiting out-of-focus light. Next, adjust the high voltage and offset settings under each laser to appropriate levels by using the sliding scales to enable detection of the specific staining while limiting any potential background staining. If a positive staining sample is available, start by imaging this sample for each channel to make sure the laser settings yield optimal signal-to-noise ratios. After setting the optimal HV and offset values for each laser, click on the ND Acquisition tab, and then select the Z icon to set up the parameters for the z series.

Next, while acquiring a live image of the sample, first set the bottom by finding the bottom of the image and clicking the bottom button. Then, find the top position of the sample and click the top button. Set the step size either by specifically typing the preferred step size in microns for each step or by specifying how many total steps are needed. To select the desired size/ pixel resolution of the image, click the Aiplus Compact GUI window, and under the size icon, select the desired resolution.

To decrease the noise of the image, you can select the drop-down menu next to the theta symbol to average the selected number of images. After this, click the Run Now tab on the ND Acquisition menu in order to start imaging the sample. After imaging is complete, save the image by clicking file, then save as, which will export the image file with the extension dot-nd2. Finally, repeat the process for each of the other samples.

In this experiment, mouse fibroblasts expressing the surface glycoprotein gene CD1d were fixed, immunostained, and imaged on a confocal microscope. This image shows a single section of a Z stack at 40X magnification, where CD1d is stained in red. The sample was costained with LAMP-1, a lysosomal marker, in green. Nuclear stain DAPI was used to show the nuclei of the cells.

In a composite image where the three different channels are merged, the appearance of yellow results from overlap of the red and green channels, and indicates an area where CD1d and LAMP-1 are co-localized in the lysosomes. Areas where only one color is present indicate the presence of CD1d or LAMP-1 without co-localization. This image shows a 3D rendering of the cells constructed from images captured in the z-stack and this method enabled the construction of a side view of this group of cells. This following image shows a slice out of the z-stack at 100X magnification, demonstrating the expression patterns of these two proteins in greater detail. The pink outlined box on the right side of the image displays the cross-section of the x-coordinate designated by the pink line in the image, which represents the side view at the pink line. Similarly, the blue outlined box on the bottom of the image shows the cross-section of the y-coordinate designated by the blue line in the image, which represents the front view at the blue line. The 3D rendering of the z-stack image enables users to view the image in 3D, visualizing all of the x, y, and z planes. This can be used to study co-localization of the different stains at different regions within the cell.

Tags

Cite This
JoVE Science Education Database. JoVE Science Education. Confocal Fluorescence Microscopy: A Technique to Determine the Localization of Proteins in Mouse Fibroblasts. JoVE, Cambridge, MA, (2023).