细胞周期分析:使用CFSE染色和流细胞测定法评估刺激后CD4和CD8 T细胞增殖
English
Diviser
Vue d'ensemble
资料来源:佩尔切特·蒂鲍特1,2,3,穆尼尔·西尔万1,2,3,苏菲·诺沃4,雷切尔·戈卢布1,2,3
1淋巴病系,法国巴黎巴斯德研究所免疫学系
2 INSERM U1223, 巴黎, 法国
3巴黎迪德罗大学,索邦巴黎城,大提琴巴斯德,巴黎,法国
4流式细胞测定,细胞学和生物标志物 UtechS,转化科学中心,巴斯德研究所,法国巴黎
细胞周期是一个普遍的生命过程。在细胞周期中,细胞经历几次修改,以分成两个子细胞。这种机制发生在生物体的整个生命中,以响应其需求。细胞分裂和胚胎发育从单细胞酶中产生完整的生物体。在成年期间,细胞周期是许多关键生物过程的核心,如组织修复。
细胞分裂机制是严格控制的事件,细胞在最终分裂前进行逐步修改。尚未处于循环中的细胞被描述为处于 Gap 0 (G0) 阶段。在此阶段,细胞被认为是静止的。当细胞开始循环时,四个不同的相位被识别:间隙1(G1),合成(S),间隙2(G2)和米托西斯(M)。G1相是细胞DNA合成所需资源的检查点。然后,S 相发生,DNA 复制开始,然后是G2相间,另一个检查点控制细胞分裂所需的所有元素。最后,细胞进入米细胞,并分裂成两个子细胞。
细胞分裂是许多不同生物系统中信息丰富的参数。在免疫学领域,白细胞增殖分析可以说明免疫反应机制。其他调查领域也依赖于细胞周期分析。例如,对肿瘤发育过程中的细胞周期的分析提高了我们对癌症的理解。
许多荧光染料现在可用于跟踪细胞增殖。这些染料的化学和光谱特性不同。存在两种不同类别的染料:蛋白质染料通过形成共价键与蛋白质永久结合,膜染料通过强疏水性关联在细胞膜内均匀地穿插。通过流动细胞学对免疫细胞增殖进行体外和体内研究是这两类细胞跟踪染料(1,2)最常见的应用之一。
CFSE(卡博司氟辛琥珀基酯)是一种荧光染料,标志着分裂细胞。最初,所有细胞都接收相同数量的染料;将细胞均匀地分割他们收到的染料,在它们的两个子细胞之间。因此,细胞周期之后,细胞中的染料强度会逐渐降低。CFSE 染色之后是传统的多参数流式细胞测定法,这是一种高通量、基于荧光的技术,允许根据细胞的CFSE染色程度对细胞进行表型和功能表征(3)。
在下面的实验中,我们使用CFSE染色和流式细胞测定法,在CD3刺激后,评估CD4+和CD8+T细胞在体外增殖。
Procédure
Résultats
In this experiment, we followed proliferation of splenic CD4+ and CD8+ T cells in in vitro culture. After 3 days, we did not see strong proliferation in both CD4+ and CD8+ T cells with or without stimulation. This is can be seen on the top panel of Figure 2 where the peaks of CSFE are not decreasing. However, after 5 days, we started to see proliferation in both populations, which is evident from decrease in the CSFE peaks (bottom panels, Figure 2). CFSE staining, clearly demonstrates that both CD4+ and CD8+ T cells were dividing more after stimulation. In addition, CD8+ T cells seemed to be slightly more proliferative than CD4+ T cells after 5 days of stimulation.
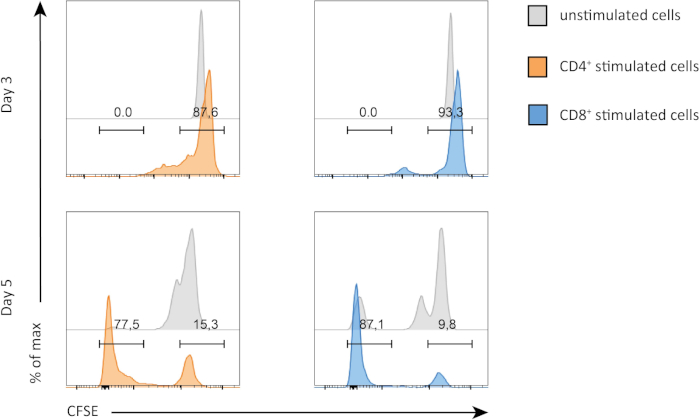
Figure 2: CD4 versus CD8 T cells proliferation. Proliferation of T cells at day 3 (top panel) and day 5 (bottom panel). Cell cycle is compared between CD4 and CD8 T cells with or without stimulation at two different days. CD4 and CD8 T cells proliferate more when stimulated. CD8 stimulated T cells proliferate more than CD4 stimulated T cells at day 5. Please click here to view a larger version of this figure.
Applications and Summary
Proliferation assays are often used in different fields such as immunology to determine the degree of activation of cells. It is also performed in oncology diagnostic to determine tumor aggressiveness in patients. CFSE staining is a useful technique to follow immune cell populations' proliferation over time. Other methods allow characterization of cell cycle. BrdU, an equivalent of CFSE is incorporated only in dividing cells. Recent Fucci mouse model even allows detection of cell cycle phases, without additional staining.
References
- Lyons, A. B. and Parish, C. R. Determination of lymphocyte division by flow cytometry. Journal of Immunological Methods. 171 (1): 131-37, (1994).
- Lyons, A. B. Analyzing cell division in vivo and in vitro using flow cytometric measurement of CFSE dye dilution. Journal of Immunological Methods. 243 (1-2), 147-154, (2000).
- Quah, B. J., Warren H. S., and Parish, C. R. Monitoring lymphocyte proliferation in vitro and in vivo with the intracellular fluorescent dye carboxyfluorescein diacetate succinimidyl ester. Nature Protocols. 2 (9): 2049-56, (2007).
Transcription
For most immunology studies, measuring proliferation of immune cells is a key step and the CFSE fluorescent dye-based method is commonly used. Proper cell division is important for immune cells since it regulates both levels and specificity of an immune response. For example, T-cells proliferate to identify and kill cancer cells and B-cells undergo cell division to produce specific antibodies. The overall premise of the CSFE assay involves staining the cells with the green fluorescent dye CFSE, which enters live cells and stably binds to the proteins inside, resulting in permanent labeling. As a result, when the dye-containing parent cell divides, each daughter cell gets half the fluorescence from the parent cell.
This process continues in the subsequent divisions with the dye intensity progressively decreasing with each division. At the desired endpoint, the fluorescence intensity of each cell is measured by flow cytometry. This data is then used to quantify the number and pattern of divisions the cells have gone through. As shown here, the cell population with the highest fluorescence are from the parent generation. The second highest belongs to the second generation and so on. The number of peaks determines the number of cell divisions.
In addition, if primary immune cells are used, specific cell populations, like the T-cells for example, can be labeled with a different colored fluorescence dye along with CFSE, and simultaneously identified using multicolor flow cytometry. The new data can be plotted on the same graph, now showing the T-cell sub-population with different CFSE staining intensities, by which the proliferation rate of the T-cells can be specifically analyzed. This video demonstrates the protocol for CFSE staining of mouse splenocytes, which are stimulated with an anti-CD3 antibody. This is followed by staining to label T-cells and flow cytometry to track their cell proliferation.
To begin, put on appropriate protective clothing and laboratory gloves. Next, wash a pair of forceps and dissecting scissors first with a detergent and then with 70% ethanol and then wipe them dry with a clean paper towel. Prepare 50 milliliters of Hank’s Balanced Salt Solution, or HBSS, with a 2% concentration of fetal calf serum, or FCS, by combining one milliliter of FCS with 49 milliliters of HBSS in a 50 milliliter tube. Mix by gently pipetting the solution up and down approximately 10 times. Then, isolate mouse spleen cells as demonstrated in the video protocol for FACS isolation of splenic B-lymphocytes.
Label four 15-milliliter tubes one through four and add one times 10 to the seventh isolated spleen cells. Next, add three milliliters of HBSS 2% FCS to each tube. Then, pipette one microliter of five micromolar carboxyfluorescein succinimidyl ester, or CFSE, into each tube. Incubate the tubes at 37 degrees Celsius in a 5% carbon dioxide incubator for 10 minutes. The cells in tubes one and two will not be stimulated. They will be used to reveal the basal level of proliferation of splenic CD4 and CD8 T-cells.
Pipette 10 milliliters of HBSS 2% FCS into these tubes. Tubes three and four will be stimulated by anti-CD3 antibody in order to observe the effects on the cell cycle. Add 10 milliliters of HBSS 2% FCS and anti-CD3 antibody at a final concentration of 2.5 micrograms per milliliter to tubes three and four. Next, centrifuge all of the tubes at 370 x g for seven minutes at 10 degrees Celsius. Discard the supernatants. Resuspend the pellets in two milliliters of HBSS 2% FCS and pipette the resulting solutions into separate wells on a six-well plate. Carefully label the plate from one to four to keep track of sample identities. Incubate the cells at 37 degrees Celsius and 5% CO2 for three days.
On day three, add two milliliters of HBSS 2% FCS to wells one and three, which should contain the cells from tubes one and three. Pipette up and down vigorously and then transfer the samples into labeled five-milliliter FACS tubes. Place the six-well plate back into the incubator. These remaining cells from wells two and four will be analyzed on day five to investigate long-term effects of stimulation on the cell cycle. Centrifuge the tubes at 370 x g for seven minutes at 10 degrees Celsius and then discard the supernatants. Now, add 100 microliters of antibody mix to each tube. Incubate the tubes for 20 minutes on ice in the dark. Next, add one milliliter of HBSS 2% FCS to each tube and centrifuge the tubes at 370 x g for seven minutes at 10 degrees Celsius. Discard the supernatants. Re-suspend the pellets in 200 milliliters of HBSS 2% FCS and mix well. Transfer the resuspended pellets to new labeled FACS tubes.
Then, evaluate T-cell proliferation using flow cytometry as shown in the FACS protocol. Gate the cells to select lymphoid CD3-positive cells and to distinguish CD4-positive and CD8-positive cells, and record the data for tubes one and three. On day five, repeat the cell-staining process with the cells from the remaining two wells of the six-well plate.
We will analyze the effects of CD3 stimulation on the cell cycle of CD4 and CD8-positive cells at three days and five days post-stimulation. To begin, click on the FlowJo icon and drag your files into the All Sample window. Double-click on the file for the unstimulated cells collected on day three to display a dot plot with forward scatter on the y-axis and side scatter on the x-axis. Click on polygon to circle the lymphocyte populations based on their morphology. In the sub-population identification window, name the population lymphocytes and click OK. Next, double-click on the circled population and in the new window, select Thy1.2 on the y-axis and CD3 on the x-axis. Then, click on polygon to circle the CD3 and Thy1.2 double positive cells. In the new sub-population identification window, name the population T-Cells and click OK. Next, double-click on the circled population. In the new window, select CD4 on the y-axis and CD8 on the x-axis. Then, click on polygon to circle the CD4-positive population. In the new sub-population identification window, name the population CD4 T-Cells and click OK. Now, click on polygon to circle the CD8-positive population. In the new sub-population identification window, name the population CD8 T-Cells and click OK. Repeat these steps with the other files.
To determine the frequencies of dividing and non-dividing cells, first, visualize the cell populations by clicking on Layout Editor. Then, drag the CD4 T-cells and CD8 T-cells from each of the four tubes to the All Sample window. Graphs representing your populations will appear. For each tube, double-click on the dot plot for CD8 T-cells and select Histogram under Graph Definition to visualize the results. Select CFSE as the parameter to compare the stimulated versus unstimulated cell populations at each time point. Non-dividing cells maintain higher levels of CFSE whereas proliferating cells split the content of CFSE to dividing cells.
Now, while pressing the Shift key, double-click on the histogram. In the new window, click range and select the range of CFSE corresponding to the highest peak. In the sub-population identification window, name the population Non-Dividing CD8 T-Cells and label the population Dividing CD8 Cells. Now, repeat to select the dividing and non-dividing CD4 T-cells in each tube. To examine the frequency of dividing CD3-positive cells, click on Table Editor. Then, drag the populations of interest, Dividing CD8 T-Cells and Dividing CD4 T-Cells, into table. On the Statistic menu, select Frequency of T-cells. Then, click on Create Table to reveal the frequency in a new table.