Análisis del ciclo celular: Evaluación de la proliferación de células T CD4 y CD8 después de su estimulación mediante tinción CFSE y citometría de flujo
English
Diviser
Vue d'ensemble
Fuente: Perchet Thibaut1,2,3, Meunier Sylvain1,2,3, Sophie Novault4, Rachel Golub1,2,3
1 Unidad de Linfinfoesis, Departamento de Inmunología, Instituto Pasteur, París, Francia
2 INSERM U1223, París, Francia
3 Université Paris Diderot, Sorbonne Paris Cité, Cellule Pasteur, París, Francia
4 Flow Cytometry Platfrom, Citometría y Biomarcadores UtechS, Centro de Ciencias Traslacionales, Instituto Pasteur, París, Francia
El ciclo celular es un proceso universal de vida. Durante el ciclo celular, una célula sufre varias modificaciones para dividir en dos células hijas. Este mecanismo se produce a lo largo de la vida de un organismo en respuesta a sus necesidades. Las divisiones celulares y el desarrollo embrionario producen un organismo completo a partir de un cigoto unicelular. Durante la edad adulta, el ciclo celular es fundamental para muchos procesos biológicos críticos, como reparaciones de tejidos.
Los mecanismos de división celular son eventos estrechamente controlados donde la célula sufre modificaciones escalonadas antes de la división final. Las celdas que aún no están en el ciclo se describen como en la fase de brecha 0 (G0). Durante esta etapa la célula se considera en reposo. Cuando la célula comienza a ciclo, se reconocen cuatro fases distintas: Brecha 1 (G1), Síntesis (S), Brecha 2 (G2)y Mitosis (M). La fase G1 es un punto de control de los recursos necesarios por la célula para la síntesis de ADN. Luego, se produce la fase S, y se inicia la replicación de ADN, seguida de la interfase G2, otro punto de control que controla todos los elementos necesarios para que la célula se divida. Finalmente, la célula ingresa mitosis y se divide en dos células hijas.
La división celular es un parámetro muy informativo en muchos sistemas biológicos diferentes. En el campo de la inmunología, el análisis de la proliferación de leucocitos puede indicar el mecanismo de la respuesta inmunitaria. Otros dominios de investigación también se basan en el análisis del ciclo celular. Por ejemplo, el análisis del ciclo celular durante el desarrollo del tumor ha mejorado nuestra comprensión del cáncer.
Muchos colorantes fluorescentes ahora están disponibles para el seguimiento de la proliferación celular. Estos tendededes difieren en sus propiedades químicas y espectrales. Existen dos clases diferentes de colorantes: los colorantes proteicos se combinan permanentemente con las proteínas mediante la formación de un enlace covalente, y los colorantes de membrana se intercalan de forma estable dentro de las membranas celulares a través de fuertes asociaciones hidrofóbicas. Los estudios in vitro e in vivo de la proliferación de células inmunitarias por citometría de flujo se encuentran entre las aplicaciones más comunes de ambas clases de destenciones de seguimiento celular (1, 2).
CFSE (Carboxyfluorescein succinimidyl ester) es un tinte fluorescente que marca las células divisorias. Inicialmente, todas las células reciben la misma cantidad de tinte; dividiendo las células uniformemente dividir el tinte que recibieron entre sus dos células hijas. Por lo tanto, el ciclo celular puede ser seguido por la disminución progresiva de la intensidad del tinte en las células. La tinción CFSE es seguida por la citometría de flujo multiparamétrica convencional, una tecnología de alto rendimiento basada en fluorescencia que permite la caracterización fenotípica y funcional de las células en función de su grado de tinción CFSE (3).
En el siguiente experimento, evaluamos la proliferación de células CD4+ y CD8+ T in vitro,después de la estimulación CD3, utilizando tinción CFSE y citometría de flujo.
Procédure
Résultats
In this experiment, we followed proliferation of splenic CD4+ and CD8+ T cells in in vitro culture. After 3 days, we did not see strong proliferation in both CD4+ and CD8+ T cells with or without stimulation. This is can be seen on the top panel of Figure 2 where the peaks of CSFE are not decreasing. However, after 5 days, we started to see proliferation in both populations, which is evident from decrease in the CSFE peaks (bottom panels, Figure 2). CFSE staining, clearly demonstrates that both CD4+ and CD8+ T cells were dividing more after stimulation. In addition, CD8+ T cells seemed to be slightly more proliferative than CD4+ T cells after 5 days of stimulation.
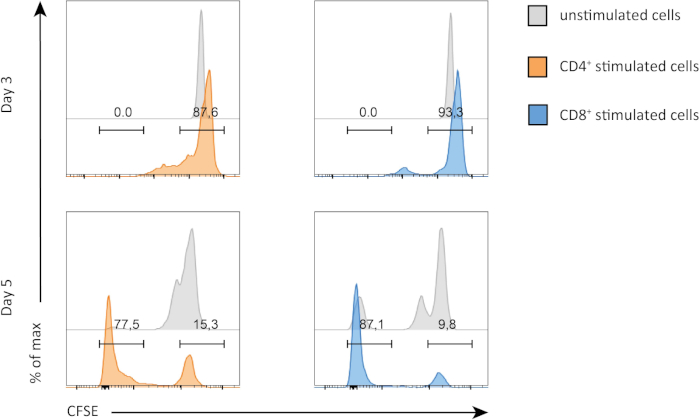
Figure 2: CD4 versus CD8 T cells proliferation. Proliferation of T cells at day 3 (top panel) and day 5 (bottom panel). Cell cycle is compared between CD4 and CD8 T cells with or without stimulation at two different days. CD4 and CD8 T cells proliferate more when stimulated. CD8 stimulated T cells proliferate more than CD4 stimulated T cells at day 5. Please click here to view a larger version of this figure.
Applications and Summary
Proliferation assays are often used in different fields such as immunology to determine the degree of activation of cells. It is also performed in oncology diagnostic to determine tumor aggressiveness in patients. CFSE staining is a useful technique to follow immune cell populations' proliferation over time. Other methods allow characterization of cell cycle. BrdU, an equivalent of CFSE is incorporated only in dividing cells. Recent Fucci mouse model even allows detection of cell cycle phases, without additional staining.
References
- Lyons, A. B. and Parish, C. R. Determination of lymphocyte division by flow cytometry. Journal of Immunological Methods. 171 (1): 131-37, (1994).
- Lyons, A. B. Analyzing cell division in vivo and in vitro using flow cytometric measurement of CFSE dye dilution. Journal of Immunological Methods. 243 (1-2), 147-154, (2000).
- Quah, B. J., Warren H. S., and Parish, C. R. Monitoring lymphocyte proliferation in vitro and in vivo with the intracellular fluorescent dye carboxyfluorescein diacetate succinimidyl ester. Nature Protocols. 2 (9): 2049-56, (2007).
Transcription
For most immunology studies, measuring proliferation of immune cells is a key step and the CFSE fluorescent dye-based method is commonly used. Proper cell division is important for immune cells since it regulates both levels and specificity of an immune response. For example, T-cells proliferate to identify and kill cancer cells and B-cells undergo cell division to produce specific antibodies. The overall premise of the CSFE assay involves staining the cells with the green fluorescent dye CFSE, which enters live cells and stably binds to the proteins inside, resulting in permanent labeling. As a result, when the dye-containing parent cell divides, each daughter cell gets half the fluorescence from the parent cell.
This process continues in the subsequent divisions with the dye intensity progressively decreasing with each division. At the desired endpoint, the fluorescence intensity of each cell is measured by flow cytometry. This data is then used to quantify the number and pattern of divisions the cells have gone through. As shown here, the cell population with the highest fluorescence are from the parent generation. The second highest belongs to the second generation and so on. The number of peaks determines the number of cell divisions.
In addition, if primary immune cells are used, specific cell populations, like the T-cells for example, can be labeled with a different colored fluorescence dye along with CFSE, and simultaneously identified using multicolor flow cytometry. The new data can be plotted on the same graph, now showing the T-cell sub-population with different CFSE staining intensities, by which the proliferation rate of the T-cells can be specifically analyzed. This video demonstrates the protocol for CFSE staining of mouse splenocytes, which are stimulated with an anti-CD3 antibody. This is followed by staining to label T-cells and flow cytometry to track their cell proliferation.
To begin, put on appropriate protective clothing and laboratory gloves. Next, wash a pair of forceps and dissecting scissors first with a detergent and then with 70% ethanol and then wipe them dry with a clean paper towel. Prepare 50 milliliters of Hank’s Balanced Salt Solution, or HBSS, with a 2% concentration of fetal calf serum, or FCS, by combining one milliliter of FCS with 49 milliliters of HBSS in a 50 milliliter tube. Mix by gently pipetting the solution up and down approximately 10 times. Then, isolate mouse spleen cells as demonstrated in the video protocol for FACS isolation of splenic B-lymphocytes.
Label four 15-milliliter tubes one through four and add one times 10 to the seventh isolated spleen cells. Next, add three milliliters of HBSS 2% FCS to each tube. Then, pipette one microliter of five micromolar carboxyfluorescein succinimidyl ester, or CFSE, into each tube. Incubate the tubes at 37 degrees Celsius in a 5% carbon dioxide incubator for 10 minutes. The cells in tubes one and two will not be stimulated. They will be used to reveal the basal level of proliferation of splenic CD4 and CD8 T-cells.
Pipette 10 milliliters of HBSS 2% FCS into these tubes. Tubes three and four will be stimulated by anti-CD3 antibody in order to observe the effects on the cell cycle. Add 10 milliliters of HBSS 2% FCS and anti-CD3 antibody at a final concentration of 2.5 micrograms per milliliter to tubes three and four. Next, centrifuge all of the tubes at 370 x g for seven minutes at 10 degrees Celsius. Discard the supernatants. Resuspend the pellets in two milliliters of HBSS 2% FCS and pipette the resulting solutions into separate wells on a six-well plate. Carefully label the plate from one to four to keep track of sample identities. Incubate the cells at 37 degrees Celsius and 5% CO2 for three days.
On day three, add two milliliters of HBSS 2% FCS to wells one and three, which should contain the cells from tubes one and three. Pipette up and down vigorously and then transfer the samples into labeled five-milliliter FACS tubes. Place the six-well plate back into the incubator. These remaining cells from wells two and four will be analyzed on day five to investigate long-term effects of stimulation on the cell cycle. Centrifuge the tubes at 370 x g for seven minutes at 10 degrees Celsius and then discard the supernatants. Now, add 100 microliters of antibody mix to each tube. Incubate the tubes for 20 minutes on ice in the dark. Next, add one milliliter of HBSS 2% FCS to each tube and centrifuge the tubes at 370 x g for seven minutes at 10 degrees Celsius. Discard the supernatants. Re-suspend the pellets in 200 milliliters of HBSS 2% FCS and mix well. Transfer the resuspended pellets to new labeled FACS tubes.
Then, evaluate T-cell proliferation using flow cytometry as shown in the FACS protocol. Gate the cells to select lymphoid CD3-positive cells and to distinguish CD4-positive and CD8-positive cells, and record the data for tubes one and three. On day five, repeat the cell-staining process with the cells from the remaining two wells of the six-well plate.
We will analyze the effects of CD3 stimulation on the cell cycle of CD4 and CD8-positive cells at three days and five days post-stimulation. To begin, click on the FlowJo icon and drag your files into the All Sample window. Double-click on the file for the unstimulated cells collected on day three to display a dot plot with forward scatter on the y-axis and side scatter on the x-axis. Click on polygon to circle the lymphocyte populations based on their morphology. In the sub-population identification window, name the population lymphocytes and click OK. Next, double-click on the circled population and in the new window, select Thy1.2 on the y-axis and CD3 on the x-axis. Then, click on polygon to circle the CD3 and Thy1.2 double positive cells. In the new sub-population identification window, name the population T-Cells and click OK. Next, double-click on the circled population. In the new window, select CD4 on the y-axis and CD8 on the x-axis. Then, click on polygon to circle the CD4-positive population. In the new sub-population identification window, name the population CD4 T-Cells and click OK. Now, click on polygon to circle the CD8-positive population. In the new sub-population identification window, name the population CD8 T-Cells and click OK. Repeat these steps with the other files.
To determine the frequencies of dividing and non-dividing cells, first, visualize the cell populations by clicking on Layout Editor. Then, drag the CD4 T-cells and CD8 T-cells from each of the four tubes to the All Sample window. Graphs representing your populations will appear. For each tube, double-click on the dot plot for CD8 T-cells and select Histogram under Graph Definition to visualize the results. Select CFSE as the parameter to compare the stimulated versus unstimulated cell populations at each time point. Non-dividing cells maintain higher levels of CFSE whereas proliferating cells split the content of CFSE to dividing cells.
Now, while pressing the Shift key, double-click on the histogram. In the new window, click range and select the range of CFSE corresponding to the highest peak. In the sub-population identification window, name the population Non-Dividing CD8 T-Cells and label the population Dividing CD8 Cells. Now, repeat to select the dividing and non-dividing CD4 T-cells in each tube. To examine the frequency of dividing CD3-positive cells, click on Table Editor. Then, drag the populations of interest, Dividing CD8 T-Cells and Dividing CD4 T-Cells, into table. On the Statistic menu, select Frequency of T-cells. Then, click on Create Table to reveal the frequency in a new table.