Cyclic voltammetry, or CV, is a technique used to study a wide range of electrochemical properties of an analyte or system.
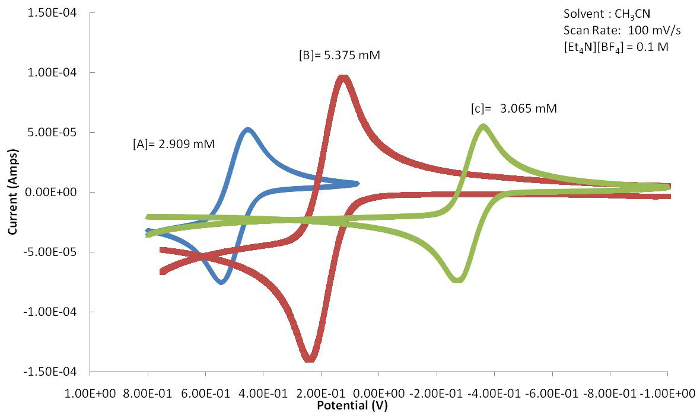
Voltammetry experiments are performed by applying a potential sweep to an electrochemical system, and then measuring the resulting current. The resulting plot of applied potential vs. current is called a voltammogram.
Cyclic voltammetry is executed the same way, except that after a linear potential sweep reaches the set value, it is then ramped in the opposite direction back to the initial potential. The shape of the voltammogram, specifically the peaks and peak locations, provides key insight into the properties of the analyte, such as oxidation-reduction, or redox potentials.
This video will demonstrate how to setup, run, and interpret cyclic voltammetry experiments in the laboratory.
Cyclic voltammetry is typically performed in a three-electrode cell. First, the working electrode is where the reaction of interest takes place. Working electrodes are often made of inert materials, such as gold, platinum, or carbon.
Next, the counter electrode is used to close the current circuit in the cell. It is also composed of inert materials, most frequently a platinum wire. Finally, the reference electrode is used as a point of reference for the system, as it has a stable and well-known potential. Thus, the applied potential is reported versus the reference potential.
The cell contains the analyte, which is dissolved in a solvent. The solvent cannot react with the analyte, and cannot be redox active within the desired scan window. In most experiments, a supporting electrolyte is used to minimize solution resistance. The electrolyte is often a salt solution, as it has a high ionic strength and conductivity.
To run an electrochemical test in a three-electrode cell, current flow is induced between the working and counter electrodes. Applied potential is controlled by manipulating the polarization of the counter electrode. However, the potential is measured between the working electrode and the known stable potential of the reference electrode. The potential is subsequently adjusted to maintain a specified potential difference between the working and reference electrodes.
In a CV experiment, the potential is linearly ramped to the “switching” potential, and is then reversed back to the starting potential, thereby making a “cyclical” sweep. The potential limits are termed the scan window. The resulting voltammogram shows features corresponding to redox events in the system.
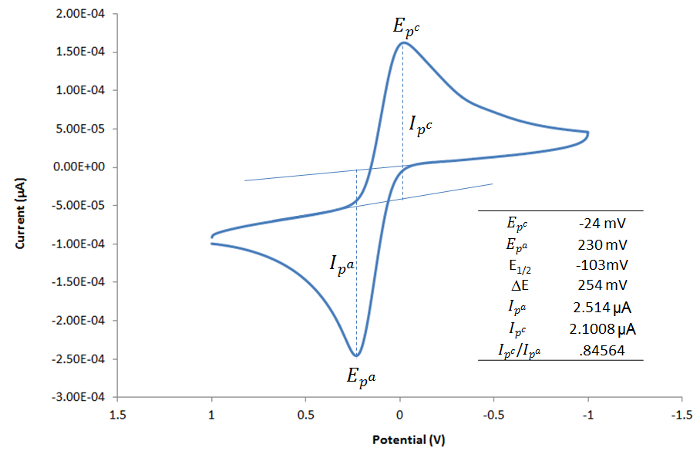
For a single electron redox event, the forward potential sweep results in a cathodic peak. At this “cathodic peak potential,” the analyte is reduced, meaning that electrons are gained. The reverse sweep causes an anodic peak, where oxidation occurs. At this “anodic peak potential,” electrons are stripped from the products formed in the forward sweep. The shapes of these peaks are highly dependent on analyte concentration, scan rate, and experimental conditions.
Now that the basics of cyclic voltammetry have been explained, let’s take a look at how to run a CV scan in the laboratory.
To begin the procedure, prepare 10 mL of an electrolyte stock solution. Add the electrolyte solution to an electrochemical cell. Add a small stir bar, place the cell on a stir plate and cap it.
Stir and degas the solution with a gentle stream of nitrogen gas. This removes oxygen, which is redox active. Prior to use, rinse the reference electrode with the solvent and dry with a Kimwipe. Then, gently clean the working and counter electrodes according to guidelines from the manufacturers.
While the solution is degassing, insert the three electrodes into the Teflon cell top. Connect the electrodes to the appropriate leads of the setup.
Obtain a background scan to verify the solution is not electrochemically active over the range of the scan window. From the resulting scan, verify there are no impurities or remaining oxygen. If redox events are present, clean the electrodes and glassware, and remake the solution.
Combine the analyte of interest with the electrolyte solution. Stir and degas the solution with a dry nitrogen stream to remove oxygen. Perform multiple cyclic voltammogram experiments at multiple scan rates, depending on the system capabilities. Begin each scan at the open circuit potential, the value where no current flows.
Methodically vary the scan window to isolate redox events of interest. Vary the scan direction to ensure it does not impact the events. Perform this step at multiple scan speeds. Once all scans have been collected, unclamp and remove each electrode from the cell. Rinse the reference electrode and dry with a Kim-wipe. Store it in the electrode storage solution. Gently clean the working and counter electrodes prior to storage, and rinse the electrode cell.
The resulting cyclic voltammograms are analyzed and the potential and current data for both reduction and oxidation events under each experimental setup are noted.
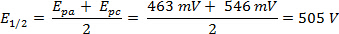
CV can be used to determine whether redox reactions are reversible, or irreversible. In a reversible system, both reduction and oxidation occurs, producing respective peaks. Additionally, the ratio of the cathodic current to anodic current should be approximately 1. Finally, in a reversible system, the mean peak potential is unaffected by the potential scan rate.
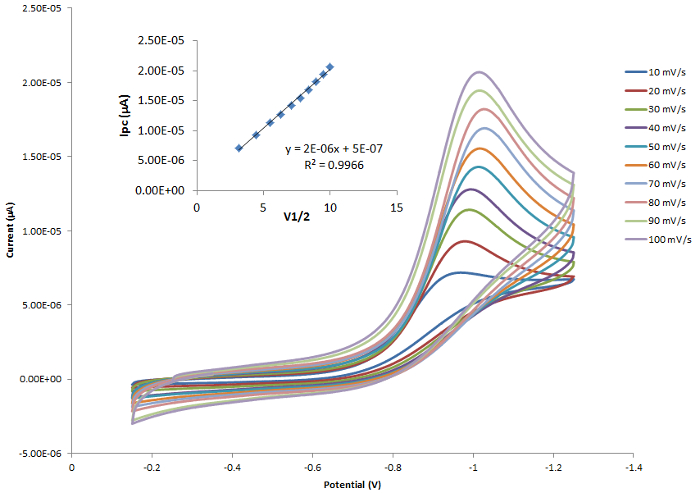
In an irreversible system, there is no reverse peak. Also, the peak current should be proportional to the square root of the scan rate.
Many fields of study that use electroactive species benefit from CV experiments.
Dopamine is a long-studied neurotransmitter, known for its importance is drug abuse, psychiatric illnesses, and degenerative disorders. The ability to examine the release of dopamine in real-time has been a goal for neuroscience. In this example, the oxidation of dopamine in the brain is measured with microelectrodes, using CV. Various pharmacological agents were applied to the brain region of interest to test their affect on dopamine release.
The capability of neural recording prosthetics decreases with time post-implantation. In this example, CV was used to monitor the effectiveness of an implant.
The electrode material and roughness, as well as surrounding tissue influenced the shape of the curve. A high charge carrying capacity, determined by the area of the curve, indicated a well functioning setup. A brief voltage pulse was used to rejuvenate the implant.
Microbial bioelectrochemical systems are a growing field of study with applications such as bioremediation.
Certain bacteria are electrochemically active, particularly when they are assembled in layers on a surface, called biofilms. These cells were grown in a bioreactor, and controlled electrochemically. As the cells grew in the bioreactor, cyclic voltammetry was used to monitor the current generated by the cells, thereby determining when the reactants were depleted.
You’ve just watched JoVE’s introduction to cyclic voltammetry. You should now understand how to run and interpret a CV scan.
Thanks for watching!