Statistical analysis was performed using statistical analysis software, and two-sided independent samples t-test was applied. Image evaluation was performed by two readers. A significant difference between the mean values of the patient group (n = 21) and healthy control group (n = 39) can be found for measurements of the CSA of the facial nerve, CN, SVN, and IVN (Table 2). CSA measurements in the patient group showed significantly larger CSA values (Figure 2 and Figure 3). Evaluation of measurements of the LD and SD showed varying results, depending on the site of measurement, and differences in LD and SD between the two groups were found. For example, at the level of the meatus, SD of the SVN was significantly larger in the patient group compared to the healthy control group, whereas LD was found to be not significantly different (Table 3 and Table 4). Mediator-based theories of MD support these findings7,15.
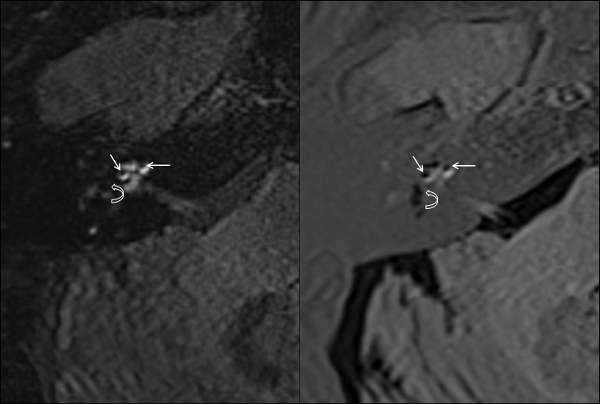
Figure 1: Endolymphatic hydrops in MRI scans. High grade endolymphatic hydrops of the cochlea (straight arrows) and the vestibule (curved arrows) in 3D-FLAIR (A) and 3D-Real-IR (B). Please click here to view a larger version of this figure.
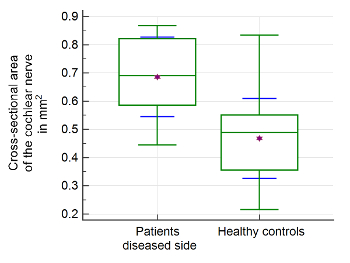
Figure 2: Morphometric evaluation of cochlear nerve. Significant differences of mean values and interquartile ranges of the cross-sectional area (CSA) of the cochlear nerve were found in the patient group compared to healthy controls. The upper and lower green horizontal lines depict minimal and maximal values, connected by the whisker. The purple star shows the arithmetic mean. The green middle line represents the median. The blue error bars depict 1 SD. Please click here to view a larger version of this figure.
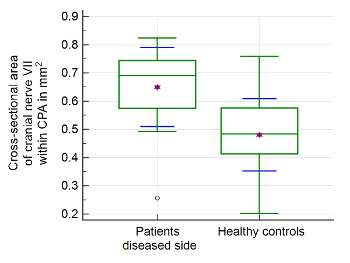
Figure 3: Morphometric evaluation of cranial nerve VII. Significant differences of the cross-sectional area (CSA) of the facial nerve at the level of the cerebellopontine angle (CPA) were found in the patient group compared to healthy controls. The upper and lower green horizontal lines depict minimal and maximal values connected by the whisker. The purple star shows the arithmetic mean. The green middle line represents the median. The blue error bars depict 1 SD. Please click here to view a larger version of this figure.
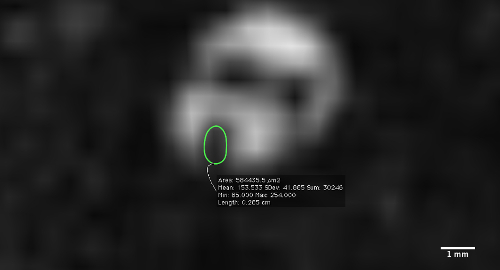
Figure 4: Measurement of the cross-sectional area (CSA) of the cochlear nerve. Measurement performed at the fundus of the internal meatus on a reconstructed slice perpendicular to the nerve's course. Please click here to view a larger version of this figure.
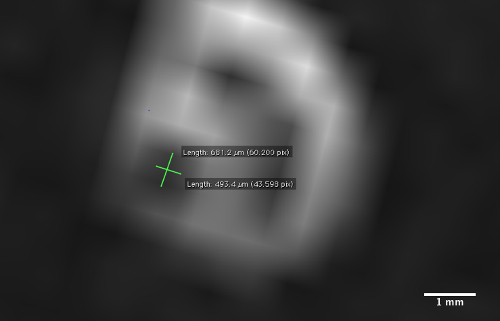
Figure 5: Measurement of the long diameter (LD) and perpendicular short diameter (SD) of the cochlear nerve. Measurement performed at the fundus of the internal meatus on a reconstructed slice perpendicular to the nerve's course. Please click here to view a larger version of this figure.
| Mr-sequence parameters | 3D-CISS |
| TR | 5.79 ms |
| TE | 2.58 ms |
| Flip angle | 34° |
| Field of view | 160 x 160 mm2 |
| Matrix size | 320 x 320 |
| Averages | 1 |
| Slice thickness | 0.5 mm |
Table 1: MRI sequence parameters. Set MRI sequence parameters as described using Constructive Interference in Steady State (CISS)-sequence technique for achieving strongly T2-weighted image contrast for optimal depiction of nerves surrounded by cerebrospinal fluid.
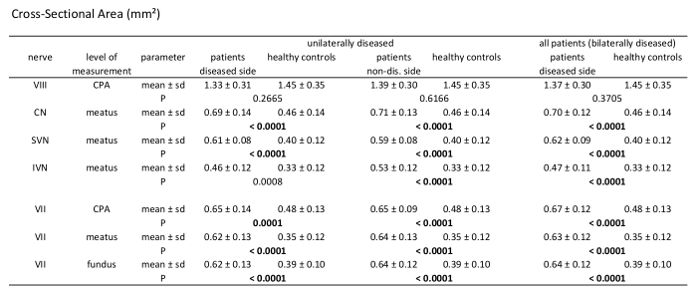
Table 2: Morphometric analysis results of cross-sectional area measurements (CSA). Comparison of patients vs. healthy controls measuring CSA of the 7th and 8th cranial nerve at different levels through their course. Analysis of unilaterally affected patients, bilaterally affected patients, and healthy controls including mean value, standard deviation, and p-values (independent samples t-test, patient group n = 21, healthy controls n = 39); significant results with p <0.000595 after Bonferroni correction are marked bold.
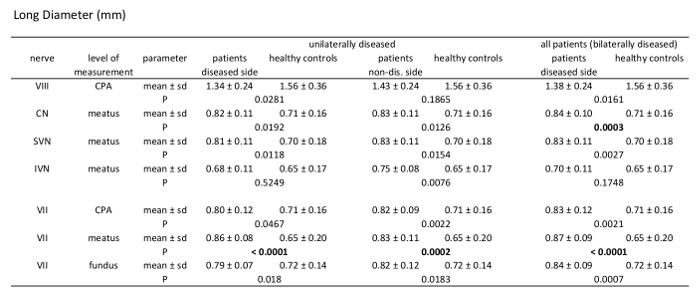
Table 3: Morphometric analysis results of long diameter (LD). Comparison of patients vs. healthy controls measuring LD of the 7th and 8th cranial nerve at different levels through their course. Analysis of unilaterally affected patients, bilaterally affected patients, and healthy controls including mean value, standard deviation, and p-values (independent samples t-test, patient group n = 21, healthy controls n = 39).
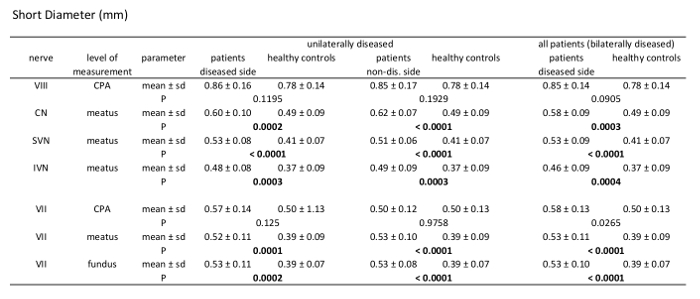
Table 4: Morphometric analysis results of short diameter (SD). Comparison of patients vs. healthy controls measuring SD of the 7th and 8th cranial nerve at different levels through their course. Analysis of unilaterally affected patients, bilaterally affected patients, and healthy controls including mean value, standard deviation, and p-values (independent samples t-test, patient group n = 21, healthy controls n = 39).