Using the procedure described here, specific anti-AQP4 IgG in serum is detectable. During the procedure, pre-diluted samples, a positive control, and a negative control were added to the reaction fields, which contain transfected and untransfected areas (Figure 2). Fluorescence of the negative control in a transfected area mainly indicated the unspecific binding of secondary antibody to the transfected cells on biochips (Figure 3). Homogeneously weak fluorescence was visible (Figure 3). As for the positive control, anti-AQP4 antibody was added to the reaction field. Strong fluorescence was observed in the transfected area, which indicated the specific binding of anti-AQP4 IgG to AQP4-M1 in the transfected cells (Figure 4). Fluorescence of the positive control in an untransfected area showed hints of unspecific binding of anti-AQP4 IgG to fixed cells on biochips (Figure 4). For 10x diluted samples, anti-AQP4 IgG-negative serum showed a fluorescent pattern similar to the negative control, while the positive serum showed a pattern similar to the positive control (Figure 5). The intensity of fluorescence was associated with the anti-AQP4 IgG titer. Examples of different intensity of fluorescence are presented in Figure 5. Figure 5A and 5B were from anti-AQP4 IgG-negative samples, while Figure 5C-H were from anti-AQP4 IgG-positive samples. As long as heterogeneous and granular fluorescence appeared in transfected areas, the sample was considered anti-AQP4 IgG-positive, regardless of the strength of the fluorescence. The diagnostic criteria for NMOSD, which is based on the serum anti-AQP4 IgG, will be further described in the discussion section.
In a few samples, only a small number of cells was strongly stained in transfected areas, and it was hard to determine whether the serum was anti-AQP4 IgG-positive or negative (Figure 6). In this case, "probable positive" can be reported. In rarer cases, the fluorescence of a sample in transfected areas was homogeneously stronger than in untransfected areas (Figure 7). In this case, the sample should be regarded as anti-AQP4 IgG-negative. The high intensity of background fluorescence might be nonspecific. To create a reliable report, all photographs should be blindly evaluated by at least two clinicians. The clinicians should be trained before evaluation. In this protocol, they were shown representative photographs of different sample types and were informed as to how to evaluate results. Then, they evaluated photographs together with an experienced clinician. Finally, the trained clinicians worked independently. In an ideal situation, it should be always the same clinicians who evaluate results.
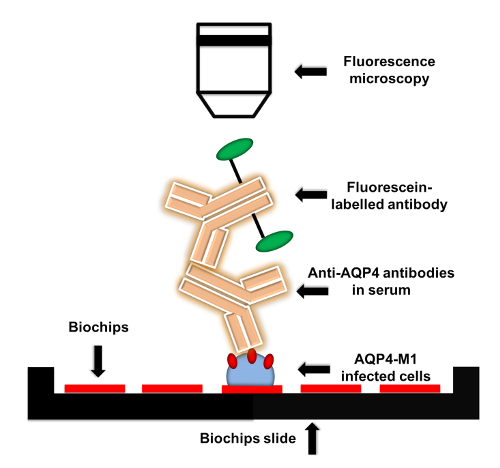
Figure 1: Flow chart of anti-AQP4 IgG detection protocol. AQP4-M1-transfected or untransfected EU 90 cells are fixed on the biochips. When adding serum to biochips, anti-AQP4 IgG in serum is captured by the fixed transfected cells. Then, fluorescein-labelled secondary antibody is applied to detect anti-AQP4 IgG. The fluorescence can be visualized by microscopy with various magnifications. Please click here to view a larger version of this figure.
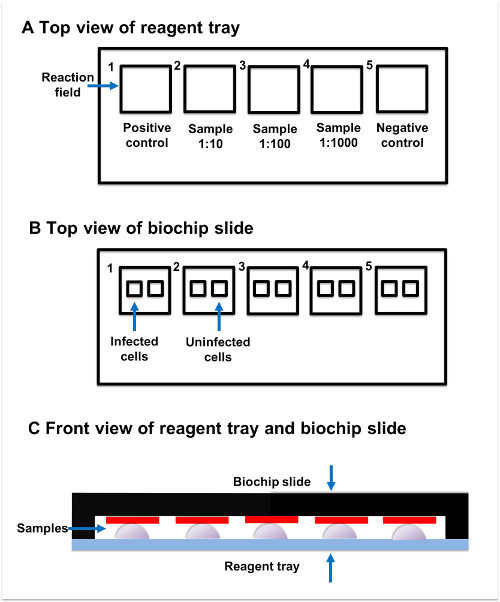
Figure 2: Sample incubation. (A) Top view of reagent tray. Every reagent tray contains five individual reaction fields. The positive control, samples, and negative control should be added to the separate reaction fields. (B) Top view of biochip slide. Every biochip slide contains five reaction fields, which have two subsections. The transfected subsection contains fixed AQP4-M1-transfected cells, while the untransfected subsection contains untransfected cells. (C) Front view of reagent tray and biochip slide. Reaction fields on the reagent tray and biochip slide are paired with each other. The sample added to the reaction field on reagent tray should be connected to the corresponding reaction field on the biochip slide. Please click here to view a larger version of this figure.
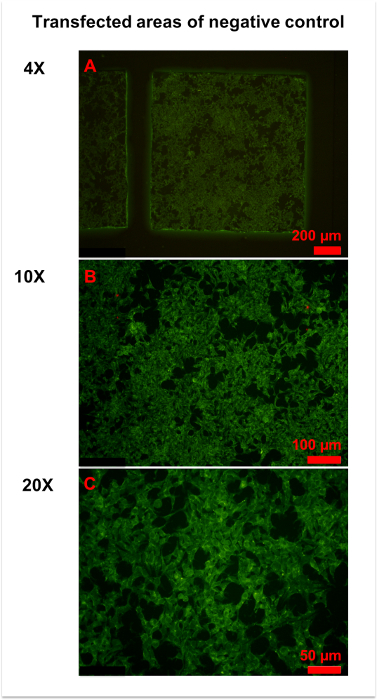
Figure 3: Representative figures for negative control. (A) An overview of the transfected area of the negative control was obtained by 4x magnification microscopy. Homogeneously weak fluorescence was observed throughout the area. (B,C) More details were observed in 10x (B) and x (C) magnification photographs. Generally, the cell membrane and plasma were slightly stained, and the cell nucleus was unstained. Please click here to view a larger version of this figure.
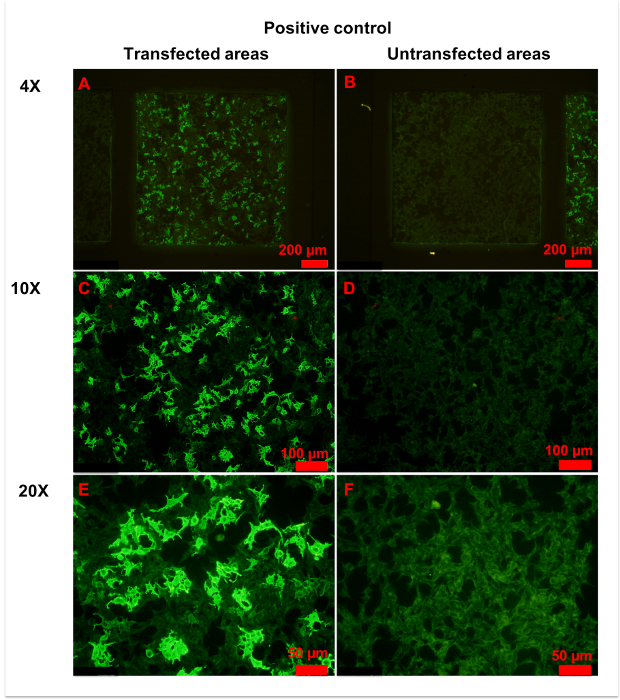
Figure 4: Representative figures for positive control. (A,B) Transfected (A) and untransfected (B) areas of positive control are shown. Homogeneously weak fluorescence was observed in untransfected areas, indicating unspecific binding of anti-AQP4 IgG to fixed cells. Conversely, heterogeneous strong fluorescence was observed in transfected areas, indicating specific binding of anti-AQP4 IgG to AQP4-M1 expressed on fixed cells. (C-F) More details of transfected (C,E) and untransfected (D,F) areas are observed in with 10x (C, D) or 20x (E,F) magnification. Weak and even fluorescence appeared in untransfected areas. However, a large percentage of cells in transfected areas showed intense fluorescence. In the plasma of strongly stained cells, anti-AQP4 IgG showed smooth and granular fluorescence. The cell nucleus was unstained or slightly stained. Please click here to view a larger version of this figure.
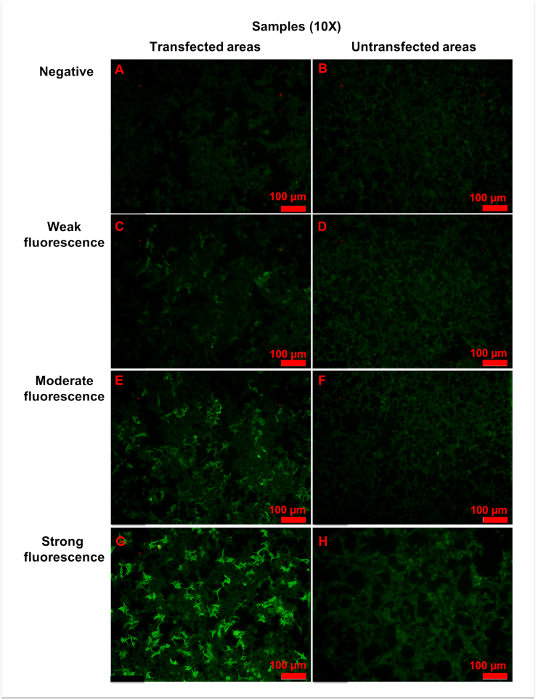
Figure 5: Representative figures for anti-AQP4 antibody negative or positive samples. Samples were 10x diluted, and all figures shown were taken with a 10x objective. (A,B) Negative fluorescence sample: the fluorescence was homogeneously weak in both (A) transfected and (B) untransfected areas. (C,D) Weak fluorescence sample: when compared with untransfected areas (D), a small amount of cells (approximately 25% to 50%) in transfected areas (C) showed more intense fluorescence. (E,F) Moderate fluorescence sample: in transfected areas (E), strong granular fluorescence was observed in a medium amount of cells (approximately 50% to 75%). (G,H) Strong fluorescence sample: cells in untransfected areas (H) were weakly stained. However, in transfected areas (G), granular fluorescence with high intensity appeared in a large number of cells (approximately over 75%). Generally, as the titer of anti-AQP4 IgG increased, both fluorescence intensity and percentage of strongly stained cells elevated correspondingly. The fluorescence of untransfected areas was always homogeneously weak. Please click here to view a larger version of this figure.
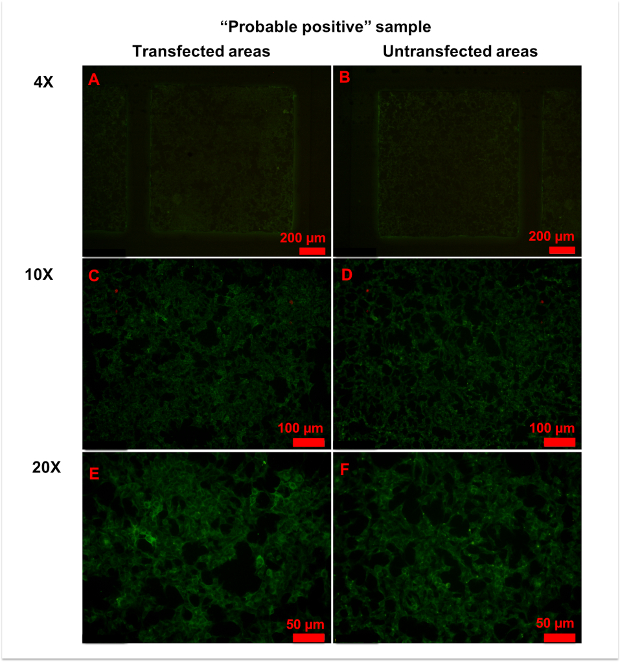
Figure 6: Representative figures for anti-AQP4 antibody "probable positive" samples. (A,B) No significant differences in fluorescence patterns were observed between transfected (A) and untransfected (B) areas at 4x magnification. (C-E) With 10x (C,D) or 20x (E,F) magnification, a few cells in transfected areas (C,E) showed strong granular fluorescence. Please click here to view a larger version of this figure.
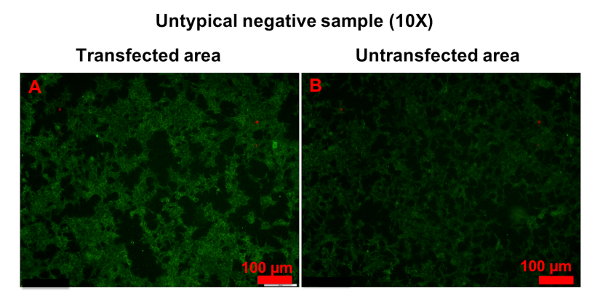
Figure 7: Example of untypical anti-AQP4 IgG-negative sample. Both transfected (A) and untransfected (B) areas were homogeneously stained. However, the fluorescence in transfected areas was stronger than in untransfected areas. Please click here to view a larger version of this figure.
| Magnification | Transfected area | Untransfected area |
| 4x | 1 picture | 1 picture |
| 10x | 4 pictures | 1 picture |
| 20x | 5 pictures | 1 picture |
Table 1: Fluorescence microscopy. It is recommended to use 4x, 10x, and 20x objectives for imaging of transfected and untransfected areas.