The protocol presented in this paper utilizes route optimization, balanced acceptance sampling, and ground-level and unmanned aircraft system (UAS) imagery to efficiently monitor vegetation in rangeland ecosystems. Results from images obtained from ground-level and UAS methods are compared.
A subscription to JoVE is required to view this content. Sign in or start your free trial.
Method Article
Ground-level Unmanned Aerial System Imagery Coupled with Spatially Balanced Sampling and Route Optimization to Monitor Rangeland Vegetation
In This Article
Summary
Abstract
Rangeland ecosystems cover 3.6 billion hectares globally with 239 million hectares located in the United States. These ecosystems are critical for maintaining global ecosystem services. Monitoring vegetation in these ecosystems is required to assess rangeland health, to gauge habitat suitability for wildlife and domestic livestock, to combat invasive weeds, and to elucidate temporal environmental changes. Although rangeland ecosystems cover vast areas, traditional monitoring techniques are often time-consuming and cost-inefficient, subject to high observer bias, and often lack adequate spatial information. Image-based vegetation monitoring is faster, produces permanent records (i.e., images), may result in reduced observer bias, and inherently includes adequate spatial information. Spatially balanced sampling designs are beneficial in monitoring natural resources. A protocol is presented for implementing a spatially balanced sampling design known as balanced acceptance sampling (BAS), with imagery acquired from ground-level cameras and unmanned aerial systems (UAS). A route optimization algorithm is used in addition to solve the ‘travelling salesperson problem’ (TSP) to increase time and cost efficiency. While UAS images can be acquired 2–3x faster than handheld images, both types of images are similar to each other in terms of accuracy and precision. Lastly, the pros and cons of each method are discussed and examples of potential applications for these methods in other ecosystems are provided.
Introduction
Rangeland ecosystems encompass vast areas, covering 239 million ha in the United States and 3.6 billion ha globally1. Rangelands provide a wide array of ecosystem services and management of rangelands involves multiple land uses. In the western US, rangelands provide wildlife habitat, water storage, carbon sequestration, and forage for domestic livestock2. Rangelands are subject to various disturbances, including invasive species, wildfires, infrastructure development, and natural resource extraction (e.g., oil, gas, and coal)3. Vegetation monitoring is critical to sustaining resource management within rangelands and other ecosystems throughout the world4,5,6. Vegetation monitoring in rangelands is often used to assess rangeland health, habitat suitability for wildlife species, and to catalogue changes in landscapes due to invasive species, wildfires, and natural resource extraction7,8,9,10. While the goals of specific monitoring programs may vary, monitoring programs that fit the needs of multiple stakeholders while being statistically reliable, repeatable, and economical are desired5,7,11. Although land managers recognize the importance of monitoring, it is often seen as unscientific, uneconomical, and burdensome5.
Traditionally, rangeland monitoring has been conducted with a variety of methods including ocular or visual estimation10, Daubenmire frames12, plot charting13, and line point intercept along vegetation transects14. While ocular or visual estimation is time-efficient, it is subject to high observer bias15. Other traditional methods, while also subject to high observer bias, are often inefficient due to their time and cost requirements6,15,16,17. The time required to implement many of these traditional methods is often too burdensome, making it difficult to obtain statistically valid sample sizes, resulting in unreliable population estimates. These methods are often applied based on convenience rather than stochastically, with observers choosing where they collect data. Additionally, reported and actual sample locations frequently differ, causing confusion for land managers and other stakeholders reliant upon vegetation monitoring data18. Recent research has demonstrated that image-based vegetation monitoring is time- and cost-effective6,19,20. Increasing the amount of data that can be sampled within a given area in a short amount of time should improve statistical reliability of the data compared to more time-consuming traditional techniques. Images are permanent records that can be analyzed by multiple observers after field data are collected6. Additionally, many cameras are equipped with global positioning systems (GPS), so images can be geotagged with a collection location18,20. Use of computer-generated sampling points, accurately located in the field, should reduce observer bias whether the image is acquired with a handheld camera or by an unmanned aerial system because it reduces an individual observer’s inclination to use their opinion of where sample locations should be placed.
Aside from being time-consuming, costly, and subject to high observer bias, traditional natural resource monitoring frequently fails to adequately characterize heterogeneous rangeland due to low sample size and concentrated sampling locations21. Spatially balanced sampling designs distribute sample locations more evenly across an area of interest to better characterize natural resources21,22,23,24. These designs can reduce sampling costs, because smaller sample sizes are required to achieve statistical accuracy relative to simple random sampling25.
In this method, a spatially balanced sampling design known as balanced acceptance sampling (BAS)22,24 is combined with image-based monitoring to assess rangeland vegetation. BAS points are optimally spread over the area of interest26. However, this does not guarantee that points will be ordered in an optimal route for visitation20. Therefore, BAS points are arranged using a route optimization algorithm that solves the travelling salesperson problem (TSP)27. Visiting the points in this order determines an optimal path (i.e., least distance) connecting the points. BAS points are transferred into a geographic information system (GIS) software program and then into a handheld data collection unit equipped with GPS. After BAS points are located, images are taken with a GPS-equipped camera as well as an unmanned aerial system operated using flight software. Upon entering the field, a technician walks to each point to acquire 1 m2 monopod-mounted camera images with 0.3 mm ground sample distance (GSD) at each BAS point while a UAS flies to the same points and acquires 2.4 mm-GSD images. Subsequently, vegetation cover data are generated using ‘SamplePoint’28 to manually classify 36 points/image. Vegetation cover data generated from the analysis of ground-level and UAS imagery is compared as well as reported acquisition times for each method. In the representative study, two adjacent, 10-acre rangeland plots were used. Finally, other applications of this method and how it may be modified for future projects or projects in other ecosystems is discussed.
Access restricted. Please log in or start a trial to view this content.
Protocol
1. Defining area of study, generating sample points and travel path, and field preparation
- Definition of the area of study
- Use a GIS software program to draw a polygon graphic(s) around the area(s) of interest. This study was conducted on two 10-acre plots within a grazing allotment in Laramie County, WY, USA (Figure 1).
- Ensure that those areas that are not intended to be within the sample frame are excluded from the polygon (e.g., water bodies, building structures, roadways, etc.). This will ensure that images will not be taken of these areas later.
- Convert the polygon graphic into a shapefile feature (.shp) in the GIS software program and ensure the shapefile is created in the desired coordinate system.
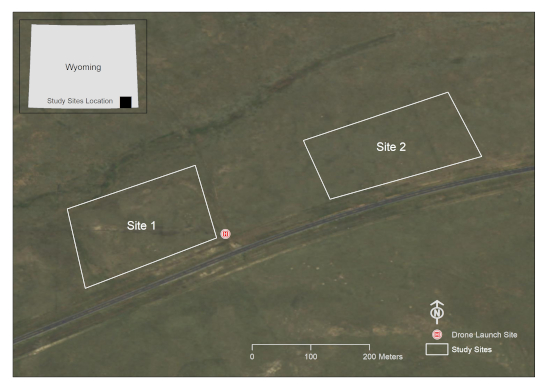
Figure 1: A depiction of the study areas of interest. This location is on a grazing allotment south of Cheyenne in Laramie County, WY, USA (Imagery Source: Wyoming NAIP Imagery 2017). Please click here to view a larger version of this figure.
- Generation of the BAS points and optimizing the travel path
NOTE: The code is attached as ‘Supplemental_Code.docx’.- Use the R package ‘rgdal’29 to convert the GIS polygon into a Program R readable file.
- Use the R package ‘SDraw’30 to generate the desired number of BAS points. This study used 30 BAS points per study area, though future research should be conducted to determine the optimal sampling intensity for areas of various size and vegetation composition.
- Use the R Package ‘TSP’27 to order the BAS points. Visiting the points in this order minimizes the time required to obtain samples at the BAS points.
- Preparation for handheld imagery acquisition
- Use the R package ‘rgdal’ to transfer the points from step 1.2.1 back into the GIS program.
- Edit the attribute table of the shapefile so the point ID field accurately reflects the optimized path order.
- Transfer the GIS polygon and point file into the GIS software running on a handheld unit.
- Ensure that the correct projected coordinate system for the area of interest is in place.
- Preparation for UAS imagery acquisition
- Use the R package ‘rgdal’ to transfer the points from step 1.2.1 back into the GIS software program.
- In the GIS software program, use the Add XY Coordinates tool to create and populate latitude and longitude fields in the waypoint attribute table.
- Export the waypoint attribute table containing Latitude, Longitude, and TSP columns to *.csv file format.
- Open the *.csv file in an appropriate software package.
- Sort waypoints by TSP identifier.
- Open Mission Hub app.
- Create arbitrary waypoint in Mission Hub.
- Export arbitrary waypoint as *.csv file.
- Open *.csv file in a spreadsheet program and delete arbitrary waypoint keeping column headings.
- Copy TSP-sorted waypoint coordinate pairs from step 1.2.3 into relevant columns in *.csv file from step 1.4.8.
- Import *.csv file from step 1.4.10 into Mission Hub as a new mission.
- Define the settings.
- Check the Use Online Elevation box.
- Specify Path Mode as Straight Lines.
- Specify Finish Action as RTH to enable the drone to Return to Home after the mission is complete.
- Click on individual waypoints and Add Actions by specifying the following parameters: Stay: 2 s (to avoid image blur); Tilt camera: -90° (Nadir); Take Photo.
- Save mission with an appropriate name.
- Repeat process for additional sites.
2. Field data collection and postprocessing
- Recording vegetation observed or expected in the study area
- Prior to acquiring images, create a list of vegetation observed within the study area. This can be done on a handwritten sheet or on a digital form to aid in photo identification later. It may be beneficial to include species that are likely to be expected in the area in the inventory even if they are not observed in the field (e.g., species within reclamation seed mixes)18.
- Ground-based image acquisition
- Attach a camera to a vertical monopod and point the camera down approximately 60°. The area of the image can be determined using the lens and resolution (megapixel) specifications of the camera and setting the monopod to a standard height. The height of the monopod coupled with the camera specifications will determine the ground sample distance (GSD). In this study, a 12.1-megapixel camera was used and the monopod was set at a constant 1.3 m above the ground to obtain Nadir images at ~0.3 mm GSD18.
- Tilt the monopod forward so the camera lens is in a Nadir position, and the angled monopod is not viewable in the image.
- Adjust the height of the monopod or the zoom on the lens to achieve a 1 m2 frameless plot size (or another desired plot size). For the most common 4:3 aspect ratio cameras, a plot width of 115 cm yields a 1 m2 image field of view. There is no need to place a frame on the ground; the entire image is the plot. If adjusting the zoom on the lens to accomplish this, use painter’s tape to prevent accidental changes in the zoom setting.
- If possible, set the camera to shutter-priority mode and set the shutter speed to at least 1/125 s to avoid blur in the image; faster if it is windy.
- Locate the first point in the optimized path order.
- Place the monopod on the ground at point 1 and tilt the monopod until the camera is in Nadir orientation. Ensure the operator's shadow is not in the image. Hold the camera steady to prevent motion blur. Acquire the image.
NOTE: A remote trigger cable is useful for this step. - Check image quality to ensure successful data capture.
- Navigate to the next point in the optimized path order and repeat the acquisition steps.
- UAS image acquisition
- Prior to launching the UAS, conduct a brief reconnoiter of the study area to ensure no physical obstacles are within the flight path. This reconnaissance exercise is also useful to locate a fairly flat area from which to launch the UAS.
- Ensure weather conditions are suitable for flying the UAS: a dry, clear day (>4.8 km visibility) with adequate lighting, minimal wind (<17 knots), and temperatures between 0 °C–37 °C.
- Follow legal protocols. For example, in the USA, Federal Aviation Administration policies should be followed.
- Utilize Mission Hub software (Figure 2) and a mission execution application accessible via mobile devices (Figure 3).
- Collect UAS imagery at each BAS point as described in step 1.4.
- Verify that all images were acquired utilizing the mobile device prior to changing locations.
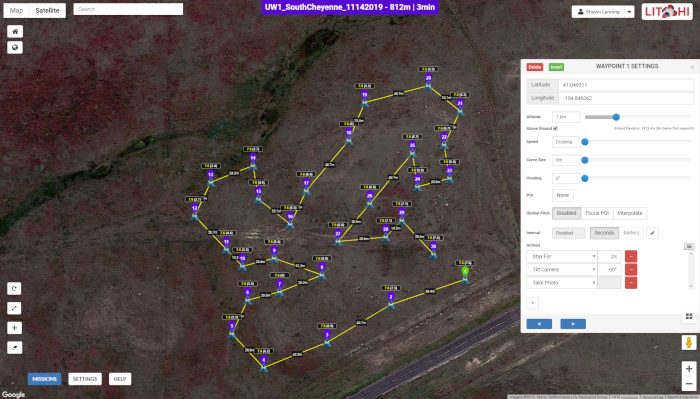
Figure 2: The user interface of Mission Hub. The map depicts the drone flight path along a series of 30 BAS points across one of the study sites while the popup window shows image acquisition parameters at each waypoint. Figure 2 is specific to Site 1, though it is similar in appearance to Site 2. Please click here to view a larger version of this figure.
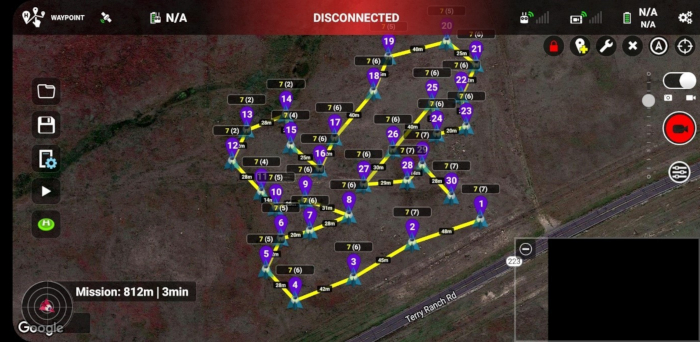
Figure 3: The waypoint flight mission in Litchi’s mission execution application running on an Android smartphone. Unique waypoint IDs are shown in purple and represent the relative order in which images were taken at various points in the study area. The numbers at each waypoint, such as 7(6), indicate the integer values of heights above the ground at which images were taken (first number) and heights above the home point or drone launch site (second number). Notice the distances between successive waypoints that are labeled on the map. Figure 3 is specific to Site 1, though it is similar in appearance to Site 2. Please click here to view a larger version of this figure.
- Ground-level image postprocessing.
NOTE: Directions are available at www.SamplePoint.org in the tutorial section; a supplemental .pdf file is attached.- Download images onto a computer with USB cable or SD card.
- Ensure images were taken at correct locations. Various software exists to place images into the GIS software based on the metadata within the geotagged images.
- If the images were acquired in multiple study areas, store them in separate folders for image analysis.
- UAS image postprocessing
- Transfer images saved on a removable microSD card from the UAS to the computer.
- Repeat steps 2.4.2 and 2.4.3.
3. Image analysis
NOTE: All Steps can be found in the ‘tutorial’ section on www.SamplePoint.org; a supplemental ‘tutorial.pdf’ file is attached.
- In SamplePoint, click Options | Database Wizard | Create/Populate Database.
- Name the database based on the study area.
- Navigate to the folder containing the desired study area samples and select those to be classified.
- Click Done.
- Click Options | Select Database and select the *.xls file that SamplePoint generates based on the image selection (this will be in the image).
- Confirm the correct number of images were selected in the database when prompted by SamplePoint.
- Select the desired number of pixels to be analyzed within each image. This can be done in a grid pattern or randomly. This study used a 6 x 6 grid to select a total of 36 pixels, though more or fewer pixels per image can be classified depending on the desired measurement precision for classification. A recent study found 20–30 pixels per image is adequate for sampling large areas31. The grid option assures pixels will be in the same position if the image is reanalyzed, whereas the random option will randomly generate pixels each time an image is reloaded.
- Create a custom Button file for species classification. This list can be generated from the vegetation list recorded in the field prior to image acquisition, or it can be based on other information pertinent to the study area (e.g., seed mix list on reclaimed sites, or ecological site description information, etc.). Ensure a button is created for Bare Ground or Soil and other potential nonvegetation items that may be encountered, such as Litter or Rock. Creating an Unknown button is recommended to allow the analyst to classify species at a later date. The Comment Box in SamplePoint can be used to note the pixels that used this option. Additionally, if the image resolution is not high enough to classify to species levels, creating buttons for functional groups (e.g., Grass, Forb, Shrub) is beneficial.
- Begin analyzing the images by clicking the classification button that describes the image pixel targeted by the red crosshair. Repeat this until SamplePoint prompts “That is all the points. Click next image.” Repeat this for all images within the database.
NOTE: The Zoom feature can be used to help with classification. - When all the images in the database are completely analyzed, SamplePoint will prompt “You have exhausted all the images.” At this point, select OK and then click Options | Create Statistics Files.
- Go to the folder containing the database and open the *.csv file that was just created to ensure that the data for all images are stored.
4. Statistical analysis
- Chi-square analyses to determine differences between sites
- Because the same number of images (primary sampling units) and pixels (secondary sampling units) are collected and analyzed at both sites, the comparison between the two sites can be considered a product of multinomial design.
- Using the *.csv file created in step 3.11, calculate the sum of points classified for each classification category.
- Perform chi-square analysis on the point sums. If Site 1 and Site 2 are similar to each other, an approximately equal number of pixels classified as each cover type will be evident on both sites18.
- Regression to compare UAS versus ground-level images
- Using the *.csv files created in step 3.11, copy and paste the average percent cover from each image and align the UAS image data with the ground-level image data.
- Perform regression analysis in a database program.
Access restricted. Please log in or start a trial to view this content.
Results
UAS image acquisition took less than half the time of ground-based image collection, while the analysis time was slightly less with ground-based images (Table 1). Ground-based images were higher resolution, which is likely the reason they were analyzed in less time. Differences in walking path times between sites were likely due to start and end points (launch site) being located closer to Site 1 than Site 2 (Figure 1). Differences in acquisition time between platforms was p...
Access restricted. Please log in or start a trial to view this content.
Discussion
The importance of natural resource monitoring has long been recognized14. With increased attention on global environmental issues, developing reliable monitoring techniques that are time- and cost-efficient is increasingly important. Several previous studies showed that image analysis compares favorably to traditional vegetation monitoring techniques in terms of time, cost, and providing valid and defensible statistical data6,31. Ground-le...
Access restricted. Please log in or start a trial to view this content.
Disclosures
The authors declare no conflict of interest. The software used in this study was available to authors either as open-source or through institutional permits. No authors are sponsored by any software used in this study and acknowledge that other software programs are available that are capable of doing similar research.
Acknowledgements
This research was funded in majority by Wyoming Reclamation and Restoration Center and Jonah Energy, LLC. We thank Warren Resources and Escelara Resources for funding the Trimble Juno 5 unit. We thank Jonah Energy, LLC for continuous support to fund vegetation monitoring in Wyoming. We thank the Wyoming Geographic Information Science Center for providing the UAS equipment utilized in this study.
Access restricted. Please log in or start a trial to view this content.
Materials
| Name | Company | Catalog Number | Comments |
|---|---|---|---|
| ArcGIS | ESRI | GPS Software | |
| DJI Phantom 4 Pro | DJI | UAS | |
| G700SE | Ricoh | GPS-equipped camera | |
| GeoJot+Core | Geospatial Experts | GPS Software | Used to extract image metadata |
| Juno 5 | Trimble | Handheld GPS device | |
| Litchi Mission Hub | Litchi | Mission Hub Software | We chose Litchi for its terrain awareness and its ability to plan robust waypoint missions |
| Program R | R Project | Statistical analysis/programming software | |
| SamplePoint | N/A | Image analysis software |
References
- Follett, R. F., Reed, D. A. Soil carbon sequestration in grazing lands: societal benefits and policy implications. Rangeland Ecology & Management. 63, 4-15 (2010).
- Ritten, J. P., Bastian, C. T., Rashford, B. S. Profitability of carbon sequestration in western rangelands of the United States. Rangeland Ecology & Management. 65, 340-350 (2012).
- Stahl, P. D., Curran, M. F. Collaborative efforts towards ecological habitat restoration of a threatened species, Greater Sage-grouse, in Wyoming, USA. Land Reclamation in Ecological Fragile Areas. , CRC Press. Boca Raton, FL. 251-254 (2017).
- Stohlgren, T. J., Bull, K. A., Otsuki, Y. Comparison of rangeland vegetation sampling techniques in the central grasslands. Journal of Range Management. 51, 164-172 (1998).
- Lovett, G. M., et al. Who needs environmental monitoring. Frontiers in Ecology and the Environment. 5, 253-260 (2007).
- Cagney, J., Cox, S. E., Booth, D. T. Comparison of point intercept and image analysis for monitoring rangeland transects. Rangeland Ecology & Management. 64, 309-315 (2011).
- Toevs, G. R., et al. Consistent indicators and methods and a scalable sample design to meet assessment, inventory, and monitoring needs across scales. Rangelands. 33, 14-20 (2011).
- Stiver, S. J., et al. Sage-grouse habitat assessment framework: multiscale habitat assessment tool. Bureau of Land Management and Western Association of Fish and Wildlife Agencies Technical Reference. , (2015).
- West, N. E. Accounting for rangeland resources over entire landscapes. Proceedings of the VI Rangeland Congress. , Aitkenvale, Queensland, Australia. (1999).
- Curran, M. F., Stahl, P. D. Database management for large scale reclamation projects in Wyoming: Developing better data acquisition, monitoring, and models for application to future projects. Journal of Environmental Solutions for Oil, Gas, and Mining. 1, 31-34 (2015).
- International Technology Team (ITT). Sampling vegetation attributes. Interagency Technical Report. , Denver, CO, USA. (1999).
- Daubenmire, R. F. A canopy-coverage method of vegetational analysis. Northwest Science. 33, 43-64 (1959).
- Heady, H. F., Gibbens, R. P., Powell, R. W. Comparison of charting, line intercept, and line point methods of sampling shrub types of vegetation. Journal of Range Management. 12, 180-188 (1959).
- Levy, E. B., Madden, E. A. The point method of pasture analysis. New Zealand Journal of Agriculture. 46, 267-269 (1933).
- Morrison, L. W. Observer error in vegetation surveys: a review. Journal of Plant Ecology. 9, 367-379 (2016).
- Kennedy, K. A., Addison, P. A. Some considerations for the use of visual estimates of plant cover in biomonitoring. Journal of Ecology. 75, 151-157 (1987).
- Bergstedt, J., Westerberg, L., Milberg, P. In the eye of the beholder: bias and stochastic variation in cover estimates. Plant Ecology. 204, 271-283 (2009).
- Curran, M. F., et al. Spatially balanced sampling and ground-level imagery for vegetation monitoring on reclaimed well pads. Restoration Ecology. 27, 974-980 (2019).
- Duniway, M. C., Karl, J. W., Shrader, S., Baquera, N., Herrick, J. E. Rangeland and pasture monitoring: an approach to interpretation of high-resolution imagery focused on observer calibration for repeatability. Environmental Monitoring and Assessment. 184, 3789-3804 (2011).
- Curran, M. F., et al. Combining spatially balanced sampling, route optimization, and remote sensing to assess biodiversity response to reclamation practices on semi-arid well pads. Biodiversity. , (2020).
- Stevens, D. L., Olsen, A. R. Spatially balanced sampling of natural resources. Journal of the American Statistical Association. 99, 262-278 (2004).
- Robertson, B. L., Brown, J. A., McDonald, T., Jaksons, P. BAS: Balanced acceptance sampling of natural resources. Biometrics. 69, 776-784 (2013).
- Brown, J. A., Robertson, B. L., McDonald, T. Spatially balanced sampling: application to environmental surveys. Procedia Environmental Sciences. 27, 6-9 (2015).
- Robertson, B. L., McDonald, T., Price, C. J., Brown, J. A. A modification of balanced acceptance sampling. Statistics & Probability Letters. 109, 107-112 (2017).
- Kermorvant, C., D'Amico, F., Bru, N., Caill-Milly, N., Robertson, B. Spatially balanced sampling designs for environmental surveys. Environmental Monitoring and Assessment. 191, 524(2019).
- Robertson, B. L., McDonald, T., Price, C. J., Brown, J. A. Halton iterative partitioning: spatially balanced sampling via partitioning. Environmental and Ecological Statistics. 25, 305-323 (2018).
- Hahsler, M., Hornik, K. TSP: Traveling Salesperson Problem (TSP). R package version 1.1-7. , Available from: https://CRAN.R-project.org/package=TSP (2019).
- Booth, D. T., Cox, S. E., Berryman, R. D. Point sampling imagery with 'SamplePoint'. Environmental Monitoring and Assessment. 123, 97-108 (2006).
- Bivand, R., Keitt, T., Rowlingson, B. rgdal: bindings for geospatial data abstraction library. R package version 1.2-7. , Available from: https://CRAN.R-project.org/package=rgdal (2017).
- McDonald, T. SDraw: spatially balanced sample draws for spatial objects. R package version 2.1.3. , Available from: https://CRAN.R-project.org/package=SDraw (2016).
- Ancin-Murguzur, F. J., Munoz, L., Monz, C., Fauchald, P., Hausner, V. Efficient sampling for ecosystem service supply assessment at a landscape scale. Ecosystems and People. 15, 33-41 (2019).
- Pilliod, D. S., Arkle, R. S. Performance of quantitative vegetation sampling methods across gradients of cover in Great Basin plant communities. Rangeland Ecology & Management. 66, 634-637 (2013).
- Anderson, K., Gaston, K. J. Lightweight unmanned aerial vehicles will revolutionize spatial ecology. Frontiers in Ecology and the Environment. 11, 138-146 (2013).
- Barnas, A. F., Darby, B. J., Vandeberg, G. S., Rockwell, R. F., Ellis-Felege, S. N. A comparison of drone imagery and ground-based methods for estimating the extent of habitat destruction by lesser snow geese (Anser caerulescens caerulescens) in La Perouse Bay. PLoS One. 14 (8), 0217049(2019).
- Chabot, D., Carignan, V., Bird, D. M. Measuring habitat quality for leaster bitterns in a created wetland with use of small unmanned aircraft. Wetlands. 34, 527-533 (2014).
- Cruzan, M. B., et al. Small unmanned vehicles (micro-UAVs, drones) in plant ecology. Applications in Plant Sciences. 4 (9), 1600041(2016).
- Booth, D. T., Cox, S. E. Image-based monitoring to measure ecological change in rangeland. Frontiers in Ecology and the Environment. 6, 185-190 (2008).
- Crimmins, M. A., Crimmins, T. M. Monitoring plant phenology using digital repeat photography. Environmental Management. 41, 949-958 (2008).
- Kermorvant, C., et al. Optimization of a survey using spatially balanced sampling: a single-year application of clam monitoring in the Arcachon Bay (SW France). Aquatic Living Resources. 30, 37-48 (2017).
- Brus, D. J. Balanced sampling: a versatile approach for statistical soil surveys. Geoderma. 253, 111-121 (2015).
- Foster, S. D., Hosack, G. R., Hill, N. A., Barnett, N. S., Lucieer, V. L. Choosing between strategies for designing surveys: autonomous underwater vehicles. Methods in Ecology and Evolution. 5, 287-297 (2014).
Access restricted. Please log in or start a trial to view this content.
Reprints and Permissions