Part 1: Preparation of Specimens
- Place a mouse under a dissection microscope, remove the entire pancreas along with the duodenum and spleen still attached, and place the organs on a pre-weighed glass slide. Remove the duodenum by cutting its connective tissue along the side where it is bound to the pancreas. Cut and remove the spleen and excess fat on the pancreas until the pancreas is completely isolated on the slide. (Pancreatic fat is distinguishable by its white color, as differentiated from the slightly darker and tanner color of pancreatic tissue.)
- Place a coverslip (large cover glass 50x75mm; standard cover glass 25x75mm) over the pancreas so that it is entirely covered. Use a weight (e.g. a heavy book) to flatten the pancreas between the slide and its cover. Depending on the weight, flattening the pancreas takes approximately five minutes.
- Take off the weight. If the pancreas is well-flattened against the slide, place it in 4% paraformaldehyde (PFA) at 4°C overnight. In the morning, remove the coverslips and well expose the whole pancreas to PFA during the day (6-8 hours). If the pancreas is not well-fixed, allow it to remain in the PFA longer, possibly overnight. Transfer the slides to the container with 1% Triton x-100 in phosphate buffered saline (PBS) overnight. Next day, transfer the slides to the container of saturated sucrose for 1-2 days. Then transfer the slides to a container of 100% glycerol until the tissue is cleared, which allows for the optimal resolution of fluorescent signals; tissue clearing takes approximately 1-3 days. (The fluorescent signals may persist for weeks, and even months, but imaging should be performed soon after the tissue is cleared for optimum resolution.)
- Store the pancreas in a dark and cool area in order to preserve the organ and its fluorescent signals.
Part 2: Imaging and quantifying the beta-cell area in the intact pancreas
- Using forceps or gloved hands, take the slide out of the container with 100% glycerol. Prepare the slide for imaging by wiping off excess glycerol and exclusively cleaning the back of the cover glass with ethanol.
- Open the StereoInvestigator software (MicroBrightField, Williston, VT) and select the 2x objective lens for imaging mice pancreata older than 3 weeks on large glass slides, or the 10x objective lens for imaging mice pancreata younger than 3 weeks pressed between two 25mm coverslips. Visualize the image by setting it to live image (Image → Live Image). Select an exposure time that clearly shows the GFP-tagged beta-cells. (Underexposing the image excludes smaller islets and beta-cells, while overexposing the image creates additional false signals.)
- Click anywhere on the screen to establish a reference point and proceed to draw a contour around the entire pancreas. Initiate the Virtual Slice process (Image → Acquire Virtual Slice). Determine and select the best focal plane i.e., the plane with the highest number of visible and focused islets and beta-cells on the Z-axis by scrolling the focus knob. Once chosen, StereoInvestigator automatically captures the image displayed on the screen. With the motorized stage, the Virtual Slice feature sequentially captures each optical panel as a distinct image within the drawn contour (Fig. 1A) and then combines all of them as one merged image (Fig. 1B). Virtual Slice imaging uses an epifluorescent configuration i.e., widefield filters that allows the camera to capture all signals present at a certain depth, including those not perfectly in focus, so that the final Virtual Slice is an integrated two-dimensional image that is not a maximum projection from the three-dimensional reconstruction of the whole pancreas. Average Virtual Slice scanning time is 30 min per sample, but can take up to an hour for a large pancreas.
- After saving the image, begin its analysis by opening up the image with ImageJ. When the image finishes loading and appears on the screen, open and run the Virtual Slice analysis macro (Supplementary material 1).
- Follow the step-by-step instructions provided by the macro. Eliminate undesired artifacts created by light scatter with the “Magic Wand” and “Select Area” tools. Check and subtract unnecessary background from the image. Determine the radius of the largest islet with the “Line” tool so that the ensuing Rolling Ball feature can effectively remove autofluorescence and scattered light. Test and select the most appropriate “Low Threshold” to capture the fluorescent signals of small islets and clusters of beta-cells (<3×104 μm2). Test and select the most appropriate “High Threshold” to capture the fluorescent signals of islets. Run the quantification of the Virtual Slice, which will measure and produce a list of islet area, perimeter, circularity, and Feret’s diameter.
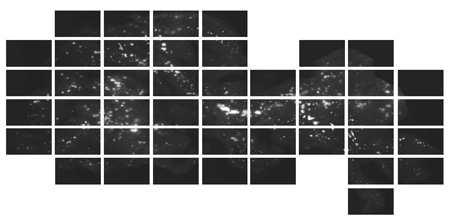
Figure 1A Virtual Slice image analysis of the entire distribution of beta-cells in an intact adult pancreas
Images of individual optical panels of a male mouse pancreas at 10-wk taken under a 2x objective. The images include the entire distribution of islets, even small clusters of beta-cells (<10 cells).
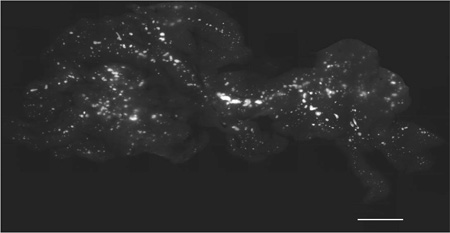
Figure 1B Virtual Slice image analysis of the entire distribution of beta-cells in an intact adult pancreas
A unified virtual slice with the dorsal pancreas on the right and the ventral pancreas on the left. Scale bar is 5 mm.
Representative Results
Proficient preparation of a pancreas for Virtual Slice imaging will allow for an effective quantification of all GFP-tagged beta-cells in an entire pancreas as a Virtual Slice image with clear and distinct islets. Successful Virtual Slice imaging of the whole pancreas in situ provides the means to examine and quantify the beta-cells, not only individual and total islet area, but also islet size distribution, regional analysis, and growth patterns as well. While ImageJ maintains the capacity to detect all beta-cells simultaneously in the analysis of Virtual Slice images, it can also control which beta-cells to quantify by restricting the analysis to certain islet sizes (by area or diameter), or by location. A standard analysis excludes artifacts e.g., debris smaller than one single beta-cell (<170 μm2) and records the area, perimeter (the distance surrounding an area), circularity (a degree of roundness, where 1.0 represents a perfect circle), and Feret’s diameter (the longest distance within an area) for each islet detected. Virtual Slice analysis is capable of enhancing virtual slice images by employing Watershed segmentation, which distinguishes and separates overlapping islets into individual islets according to their shapes. The analysis further produces a series of detailed images; this includes masks of the images under both low and high intensity (Fig. 1C), an outline of all presumed islets, which are each individually numbered and listed in a table of corresponding information (Fig. 1D), and the original Virtual Slice image (Fig. 1B). Note that potential technical bias when choosing threshold values can skew the quantification of islets by including gratuitous light surrounding large structures, or by reducing the total number of islets, especially faint signals from small particles.
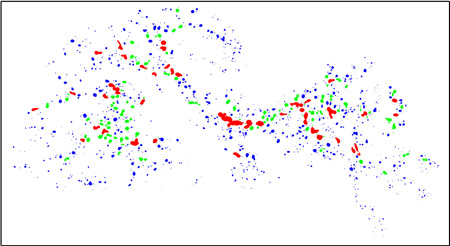
Figure 1C Virtual Slice image analysis of the entire distribution of beta-cells in an intact adult pancreas
A mask of the fluorescent particles in the virtual slice. Color codes: [1] blue: low intensity fluorescence; [2] green: intermediate intensity fluorescence; and [3] red: high intensity fluorescence.
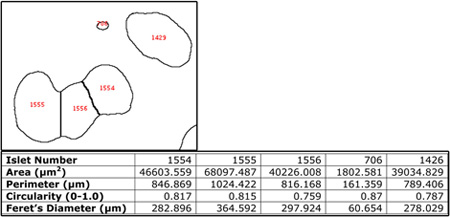
Figure 1D Virtual Slice image analysis of the entire distribution of beta-cells in an intact adult pancreas
Quantification of individual islets/clusters of beta-cells. Note that each islet (including small clusters of beta-cells) is numbered, with its information detailed in a corresponding chart. Four parameters were taken for each structure: (1) area; (2) perimeter; (3) circularity: a degree of roundness where the number 1.0 represents a perfect circle; and (4) Feret’s diameter: the longest distance within an area. Note that #706 displays the analyses resolution with an area of only a few beta-cells. Watershed segmentation detects groups of adjacent islets, such as the one shown, and appropriately distinguishes them as distinct islets (islets 1554, 1555, and 1556).
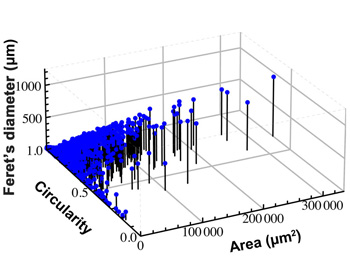
Figure 1E Virtual Slice image analysis of the entire distribution of beta-cells in an intact adult pancreas
3-dimensional plot of the virtual slice analysis, with axes of area, perimeter, and Feret’s diameter. Each dot represents an islet.
The analysis of Virtual Slice images of islets and beta-cell clusters in the intact pancreas provides a large-scale view of the entire distribution of islets. Developments and changes in total islet distribution over time can thus be studied and compared. Such an example is demonstrated in our analysis of pancreatic islet formation (1). A comprehensive analysis of neonatal mice pancreata at various time points (P1-P21) has demonstrated that islets are formed by fission. While beta-cell proliferation fits with a lognormal probability density function in mice from P1-P10, islet distribution from P12 onward deviates leftward away from the lognormal pattern, suggesting a process of fission. A similar analysis was performed on progressive insulinoma development in mice, which fitted a lognormal function with the parameters of peak position and x-axis scale, and a power law distribution (2):
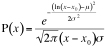
P(x) = axy. The data are effectively presented in three-dimensional plots of the area, perimeter and Feret’s diameter (Fig. 1E). For our study, transgenic mice, in which pancreatic beta-cells were genetically tagged with green fluorescent protein (GFP; 3, 4) under the control of mouse insulin I promoter (MIP), were used. MIP-GFP can also be crossed with other specific transgenic mice in future studies.
