Accurate intracardiac echocardiography (ICE) shows significant accuracy in estimating the left atrial structure, a prospective and promising cardiac structure estimation method. Here we propose a protocol for three-dimensional modeling of the left atrium and pulmonary veins with ICE and fast anatomical mapping (FAM) catheter remodeling.
Intracardiac echocardiography (ICE) is a novel tool for estimating cardiac anatomy during pulmonary vein isolation procedures, particularly the left atrium (LA) anatomy and pulmonary vein structures. ICE is widely used to establish a three-dimensional (3D) left atrial structural model during ablation procedures. However, it is unclear whether using ICE in a precise 3D modeling method can provide a more accurate left atrial 3D model and the transseptal approach. This study proposes a protocol to model the left atrium and pulmonary veins with ICE and fast anatomical mapping (FAM) catheter remodeling. It evaluates the accuracy of the models produced using the two methods through observer scoring. We included 50 patients who underwent ICE-based 3D remodeling and 45 who underwent FAM 3D remodeling based on pulmonary vein isolation procedures. The pulmonary vein antrum remodeling is estimated by comparing the antrum area acquired by remodeling and left atrial computed tomography angiography (CTA). The observer scores for the modeling in the ICE and FAM groups were 3.40 ± 0.81 and 3.02 ± 0.72 (P < 0.05), respectively. The pulmonary vein antrum area obtained using the ICE- and FAM-based methods showed a correlation with the area acquired by left atrium CT. However, the 95% confidence interval bias was narrower in ICE-acquired models than in FAM-acquired models (-238 cm2 to 323 cm2 Vs. -363 cm2 to 386 cm2, respectively) using Bland-Altman analysis. Therefore, precise ICE possesses high accuracy in estimating the left atrial structure, becoming a promising approach for future cardiac structure estimation.
Atrial fibrillation (AF) is commonly associated with atrial remodeling, including mechanical remodeling, electrophysiologic remodeling, and structural remodeling1. Structural remodeling will dramatically affect the anatomy of the atrium. Hence, assessing the left atrial anatomy in AF patients is essential for AF ablation procedures and any procedure targeting the left atrium. For the FAM 3D modeling, the 3D modeling of the heart is reconstructed based on the spatial position change of its position corresponding to the fixed magnetic field by continuously displacing the magnetic catheter in the heart. In contrast, ICE 3D modeling integrates the two-dimensional image in the cardiac cavity with the 3D electroanatomic mapping system by positioning the sensor at the head end of the ICE phase array catheter. Thus, the ultrasonic sector represents 3D modeling to demonstrate the anatomical relationship and real-time catheter position.
Based on our clinical experience, intracardiac echocardiography (ICE) can identify the atrial wall boundary and further establish the 3D remodel. However, most ICE usage during AF ablation or 3D remodeling just provides a brief profile of the atria or pulmonary veins. Originally, ICE was applied to guide the interventional closure of atrial septal defect and patent foramen ovale2. ICE can clarify the location and shape of the atrial septal and has been used for various interventional procedures requiring atrial septal puncture3. These include radiofrequency catheter ablation of atrial fibrillation, mitral valve interventional therapy, etc. ICE can precisely identify pulmonary vein boundaries and atrial walls to establish a more detailed 3D model3. It is unclear whether this method could provide operators with a more precise atrial anatomy assessment, especially for the pulmonary vein antrum and transseptal sites. In this study, we compared the left atrium CT image and 3D remodel established using traditional methods and precise ICE procedures to determine additional information.
This research procedure closely adhered to the rules of human research ethics committee of China-Japan Union Hospital of Jilin University. Patients who underwent radiofrequency ablation of atrial fibrillation were searched on the Carto system (3D mapping system). Then, the PACS system was used to determine whether the patient underwent left atrial CT examination before surgery to ascertain that each selected patient had left atrial CT images for comparison. Soundstar is the ICE catheter used in this study, and a Cartosound module is available in the 3D mapping system. Each patient provided written informed consent before ICE 3D modeling.
1. Preparation before scanning
2. 3D modeling of the left atrium and pulmonary vein
NOTE: The ICE constructs the left atrium model in two directions.
3. Image acquisition and measurement of the pulmonary vein area
From January 2021 to June 2022, we selected 114 patients who underwent radiofrequency ablation of atrial fibrillation at our hospital. Patients were excluded based on the following criteria: no 3D volume reconstruction image of left atrial CT (n = 11), no transseptal puncture ICE image (n = 4), and incomplete reconstruction of the left atrium and pulmonary vein images (n = 4). Finally, 50 patients with ICE 3D modeling and 45 with FAM 3D modeling as control group was included in this study.
Two professional electrophysiologists analyzed all the 3-D modeling images. We compared the degree of anatomical anastomosis between Carto modeling and left atrial computed tomography angiography imaging. The 3D images of FAM modeling and refined ultrasound modeling (Figure 1) were scored (0 points: completely inconsistent; 5 points: completely consistent). The transseptal puncture position appropriateness (Figure 2) was scored for conventional and refined ultrasound-guided methods (0 points: totally inappropriate, requiring re-puncture; 5 points: Very appropriate). The maximum cross-sectional area of the pulmonary vein vestibule gathered using conventional and refined ultrasound modeling was compared with the maximum cross-sectional area obtained by left atrial CT. The modeling observer scores were 3.40 ± 0.81 and 3.02 ± 0.72 (P < 0.05) in the ICE and FAM groups, respectively. The observer scores for selecting transseptal puncture sites were 4.62 ± 0.73 and 4.29 ± 0.97 (P < 0.05) in the ICE and FAM groups, respectively (Figure 3). The pulmonary vein antrum area acquired using the ICE- and FAM-based methods correlates with the area acquired by left atrial CT. However, the 95% confidence interval bias was narrower in ICE-acquired models than in FAM-acquired models using Bland-Altman analysis (-238 cm2 to 323 cm2 Vs. -363 cm2 to 386 cm2, respectively)(Figure 4).
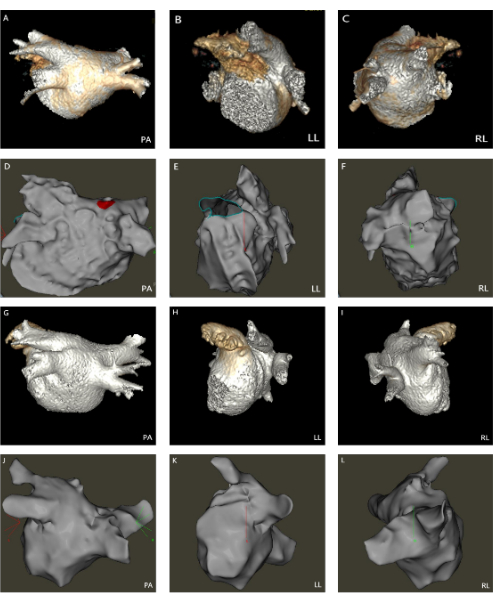
Figure 1: 3D modeling images of the left atrium, pulmonary vein, and transseptal puncture. (A–F) Comparison of the 3D modeling of ICE and left atrial CT. (G–L) Comparison of the 3D modeling of FAM and left atrial CT. (PA: Posterior-anterior; LL: Left lateral; RL: Right lateral). Please click here to view a larger version of this figure.
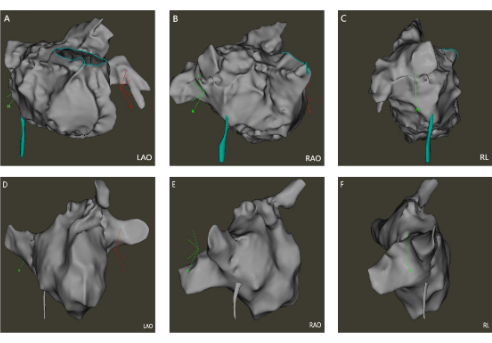
Figure 2: The transseptal puncture positioning maps. (A–C) The ICE-guided transseptal puncture positioning maps; (D–F) The FAM-guided transseptal puncture positioning maps. (LAO: Left anterior oblique; RAO: Right anterior oblique; RL: Right lateral). Please click here to view a larger version of this figure.
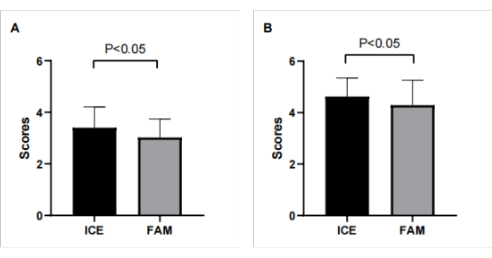
Figure 3: The observer scores for modeling and selecting transseptal puncture sites. (A) The observer scores for modeling in the ICE and FAM groups were 3.40 ± 0.81 and 3.02 ± 0.72 (P < 0.05), respectively; (B) The observer scores for selecting transseptal puncture sites in the ICE and FAM groups were 4.62 ± 0.73 and 4.29 ± 0.97 ( P < 0.05), respectively. Please click here to view a larger version of this figure.
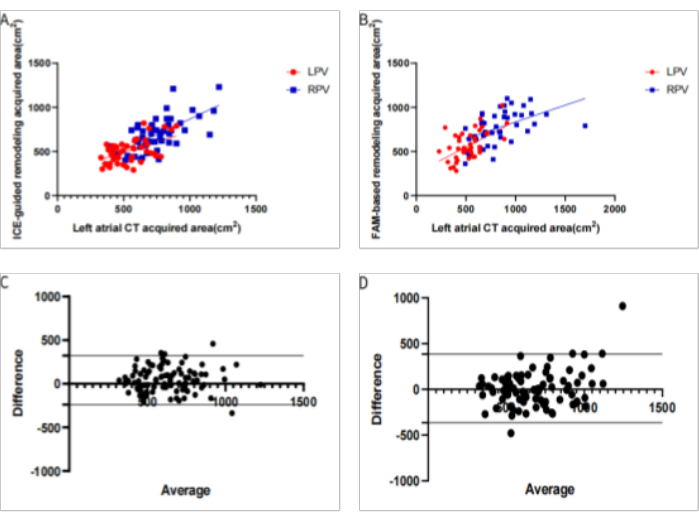
Figure 4: Comparison of the two modeling methods for measuring the pulmonary vein area. (A) Linear regression analysis of the pulmonary vein antrum area acquired using the ICE-based method and left atrial CT; (B) Linear regression analysis of the pulmonary vein antrum area obtained by the FAM-based method and left atrial CT; (C) Bland-Altman plots of the ICE-acquired models compared to the left atrial CT. The 95% confidence interval bias was -238 cm2 to 323 cm2; (D) Bland-Altman plots of the FAM-acquired models compared to the left atrial CT. The 95% confidence interval bias was -363 cm2 to 386 cm2. (LPV: Left pulmonary vein; RPV: Right pulmonary vein Please click here to view a larger version of this figure.
Video 1: Specific process for marking important anatomical locations. Please click here to download this File.
Intracardiac echocardiography (ICE) is a noncontact three-dimensional reconstruction tool. It determines the appropriate ablation plane and reduces the incidence of pulmonary vein stenosis. Moreover, ICE improves the effectiveness of catheter ablation by assessing the distal position of the ablation catheter and its relative association with the anatomical structures. These structures include the left atrium and pulmonary vein and the diameter and morphology of the pulmonary vein.
ICE-guided atrial fibrillation catheter ablation can decrease intraoperative X-ray irradiation, reduce atrial septal puncture time, detect early complications, and provide timely treatment to avoid severe consequences than atrial fibrillation ablation guided by traditional 3D modeling. Compared with transesophageal echocardiography (TEE), ICE identifies left atrial appendage thrombus more accurately with more evident imaging treatment. Thus, ICE may completely replace TEE in determining left atrial appendage thrombus4. During the procedure, ICE can accurately identify the real-time anatomical structure of the left atrium (LA) and pulmonary veins (PVs)5. However, when the ICE catheter is sent, its position should be observed through imaging. Additionally, an appropriate distance should be maintained from the vascular wall to prevent unnecessary damage to the blood vessels. ICE did not elevate the subjective score satisfaction of the atrial septal puncture. This is associated with the experience of atrial septal puncture practitioners. Our surgeons are more experienced, and these practices should be explored in new surgeons.
A detailed understanding of the left atrium anatomy is necessary for safe and effective radiofrequency ablation of atrial fibrillation. Okumura6 et al. observed that the 3-D modeling constructed by CT or MRI possesses different chamber conformations due to changes in the left atrium chamber state during the time interval between CT image acquisition and intervention. Poor CT image quality may further increase inaccuracy at higher heart rates, especially in ventricular imaging. The ICE phased array catheter helps integrate the two-dimensional image within the 3D electroanatomic mapping system, with a more intuitive display of the anatomical relationship and real-time catheter position. Furthermore, the left atrium and pulmonary vein can be obtained without preoperative imaging or through the interval channel7. This helps clinicians map more accurately, quickly, and safely. The essential steps in this method are accurate puncture of the atrial septum and appropriate adjustment of the ultrasound catheter direction to accurately display the left atrium-related structures such as pulmonary veins, left atrial appendage, etc. This study compared the images of ICE and FAM modeling methods, and we observed that the model obtained using ICE fine modeling (3.40 ± 0.81) was more refined than the FAM 3D modeling (3.02 ± 0.72). The disadvantages of ICE include training requirements, and becoming proficient in its use typically involves a relatively long learning curve8, particularly proficiency in the ICE fine modeling process. There should be specific technical support. Thus, experienced operators are recommended when performing the atrial septal puncture. The left atrial appendage is poorly developed when the ICE catheter is located in the right atrium. However, the left atrial appendage can be displayed when ICE is placed in the coronary sinus. There is a risk of dissection and venous perforation, and ICE is more expensive than IEE.
Haissasaguerre9 et al. observed that most premature atrial contractions causing frequent episodes of atrial fibrillation tend to originate from the pulmonary vein. Contrast agents are required to determine the location of the pulmonary vein orifice in traditional radiofrequency ablation of atrial fibrillation. Direct LA imaging facilitated clear visualization, especially of the left pulmonary veins (LPVs). This could permit better image integration and navigation of the ablation catheter for circumferential pulmonary vein isolation (CPVI)10. When the pulmonary vein vestibule is isolated, real-time imaging and functional monitoring help improve the safety and accuracy of surgery. ICE can determine the number of pulmonary veins, diameter, anatomical variation, and other features11. We observed that the area of the pulmonary vein was associated with CTA in both FAM and ICE images by determining the area of the pulmonary vein vestibule. The linear regression suggested P < 0.05, and the 95% confidence interval bias was narrower in ICE-acquired models than in FAM-acquired models (-238cm2 to 323cm2 Vs. -363cm2 to 386cm2, respectively). ICE is more accurate and less variable because of noncontact modeling. The pressure change during contact may cause atrial deformation in catheter contact modeling, with different pressures for each contact, describing the source of the difference. Fine modeling of pulmonary veins using ICE can lead to CT modeling accuracy, observing the location, area, and degree of ablation in real time, than in FAM modeling and achieving complete pulmonary vein isolation.
At present, ICE is widely used in various catheter interventional operations. ICE provides accurate cardiac anatomy images, decreases radiation exposure, removes the need for general anesthesia3, and enhances patient tolerance. In the future, with the imaging quality of ICE, including 3D and 4D imaging capabilities, improving the resolution and image clarity, shrinking catheter diameter, and gradual price decline, it will widely increase its usage in clinical practice.
The authors have nothing to disclose.
We thank Junming Yan, consultant of Johnson&Johnoson, who is responsible for research grants.This work was funded by the Jilin Provincial Department of Science and Technology (20220402076GH).
CARTO V6 | Johnson&Johnson | 6.0.80.45 | |
CARTO V7 | Johnson&Johnson | 7.1.80.33 | |
PACS system | Philips(China) Investment Co.,Ltd | N/A | |
Soundstar | Johnson&Johnson | N/A |