Immunofluorescent Staining of Spheroids: A Technique to Analyze Spheroids for Expression of Intra- and Extracellular Antigen Expression
Published: April 30, 2023
Abstract
Source: Cavaco, A. C. M. et al. A 3D Spheroid Model as a More Physiological System for Cancer-Associated Fibroblasts Differentiation and Invasion In Vitro Studies. J. Vis. Exp. (2019).
This video describes the technique of immunofluorescent staining of spheroids to understand the differentiation of the fibroblasts or CAFs. This protocol helps detect expression of intra- and extracellular antigens, including deposition of ECM proteins within the spheroids.
Protocol
1. Immunofluorescent staining of spheroids
- Collect the spheroids after about 24 h into one 1.5 mL reaction tube per experimental condition or per protein to be analyzed. For example, place the spheroids of iNFs stimulated with TGF-β1 in a tube different from the control iNFs, which were not treated. To avoid rupture of spheroids due to too strong shear forces, cut the end of the pipette tip to enlarge the orifice. Include at least 5-10 spheroids in one reaction tube, to allow replicates and take into account the possible losses during the washing steps.
- Centrifuge the spheroids with a bench top centrifuge for about 30-60 s at 1,000 x g. Carefully remove the methylcellulose-containing supernatant by pipetting, without disturbing the pelleted spheroids.
- Wash with 50 µL of 1x PBS. Repeat the centrifugation step and carefully remove the PBS by pipetting, as described in 1.2.
- Depending on the protein to be stained, fix with 50 µL of 4% paraformaldehyde in PBS for 20 minutes at room temperature (for αSMA, NG2 and integrin α3β1) or with 50 µL of methanol for 10 min at -20 °C (for laminin-332 subunits).
- Repeat the washing step as explained in steps 1.2-1.3.
- Permeabilize the cells with 0.1% Triton-X in PBS for 4 min at room temperature.
- Repeat the washing step as explained in steps 1.2-1.3 three times.
- Incubate the spheroids in PBS containing 5% FBS and 2% BSA, for 1 h at RT to block non-specific protein interaction sites.
- Incubate the spheroids with 30 µL of primary antibodies in PBS, 2.5% FBS and 1% BSA at 4 °C overnight. The following primary antibodies were used: anti-αSMA Cy-3 conjugated and anti-NG2 at 5 µg/mL; BM2 anti-laminin α3, 6F12 anti-laminin β3 and anti-laminin γ2 20 µg/mL.
- Repeat the washing step as explained in steps 1.2-1.3 three times.
- Incubate the spheroids with 30 µL of secondary antibodies in PBS, 2.5% FBS and 1% BSA at RT for 90 min. The following secondary antibodies used were: Alexa 488 anti-rabbit and anti-mouse (5 µg/mL).
- Repeat the washing step as explained in steps 1.2-1.3 three times.
- Incubate the cells with 30 µL of DAPI staining solution for 4 min at room temperature.
- Repeat the washing step as explained in steps 1.2-1.3.
- Place the spheroids on a glass slide, in a drop of PBS, using a glass Pasteur pipet.
- Image the spheroids by fluorescence microscopy in a laser scanning microscope using a magnification of 10x. Take different optical cross-section of the spheroid at different optical planes of a z-stack (15-20 stack planes). To establish the laser settings in the microscope, use a spheroid composed of cells negative for the antigen of interest or a spheroid stained only with the secondary antibody. Reuse the same settings for all the samples that will be compared.
- Analyze the microscopic images with ImageJ software as published previously. The steps are summarized in Figure 1. As background, determine the integrated signal density of a cell-free region of interest (ROI). Calculate the total corrected cell fluorescence (TCCF) as:
TCCF = integrated signal density – (area of selected spheroid x mean fluorescence of the background) - Determine the total corrected fluorescence (TCF) of the spheroids as the TCCF normalized to the area of spheroid and the number of stacks.
TCF = TCCF of spheroid / (area of spheroids x number of stacks)
Representative Results
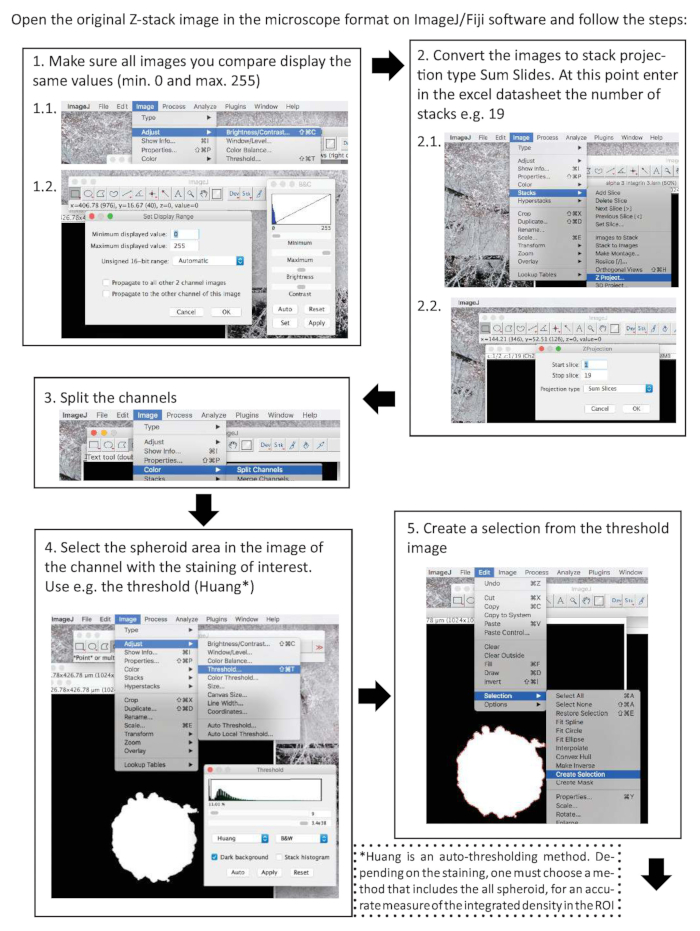
Figure 1. Sequential steps for quantification of the immunofluorescent staining of a protein of interest in spheroids, using ImageJ. Please click here to view a larger version of this figure.
Divulgazioni
The authors have nothing to disclose.
Materials
| 4',6-Diamidino-2-Phenylindole, Dihydrochloride (DAPI) | SIGMA-ALDRICH | D9542-10 | |
| 6F12 anti-Laminin β3 subunit Mouse (monoclonal) | Homemade | ||
| Albumin Fraction V – BSA | AppliChem | A1391 | |
| Alexa fluor 488 Goat (polyclonal) anti-Mouse | Invitrogen | A11029 | |
| Alexa fluor 488 Goat (polyclonal) Rabbit | Invitrogen | A11034 | |
| Anti-laminin γ2 subunit Mouse (monoclonal) | Santa Cruz | sc-28330 | |
| Bench centrifuge | Fisher Scientific | 50-589-620 | Sprout |
| BM2 anti-laminin α3 subunit Mouse (monoclonal) | Kindly provided by Prof. Patricia Rousselle, CNRS, Lyon | ||
| Centrifuge tubes 50 mL | Corning | 430290 | |
| Confocal microscope | Zeiss | ||
| DMEM (High glucose 4.5 g/L) | Lonza | BE12-604F | |
| Human Primary Pancreatic Fibroblasts | PELOBiotech | PB-H-6201 | |
| Penicillin/streptomycin | Gibco | 15140-122 | |
| Microscope Slides | Thermo Scientific | J1800AMNZ | |
| Paraformaldehyde | Riedel-de Haën | 16005 | |
| TritonX-100 | SIGMA-ALDRICH | X100RS |

Citazione di questo articolo
Immunofluorescent Staining of Spheroids: A Technique to Analyze Spheroids for Expression of Intra- and Extracellular Antigen Expression. J. Vis. Exp. (Pending Publication), e20312, doi: (2023).