1. Preparing Pancreatic Acinar Cells for Calcium Imaging
- Prepare HEPES incubation buffer containing 20 mM HEPES, 95 mM NaCl, 4.7 mM KCl, 0.6 mM MgCl2, 1.3 mM CaCl2, 10 mM glucose, 2 mM glutamine, and 1 × minimum Eagle’s medium non-essential amino acids. Adjust the final solution to pH 7.4 with NaOH.
- Prepare a BSA incubation buffer by adding BSA (1% w/v final) to 25 ml of the HEPES incubation buffer (described above).
- Prepare a collagenase digestion buffer by adding 1.1 mg/ml (200 Units/ml) type-4 collagenase and 1 mg/ml soybean trypsin inhibitor to 6 ml of BSA incubation buffer (described above).
- Acid-wash 22×22 mm coverslips by immersing in two parts HNO3 and one part HCl for 2 hr. Then decant using DI water and store in 70% ethanol.
- Euthanize one mouse by CO2 asphyxiation. Orient the animal in the supine position, and prepare the abdominal surface by cleaning with 70% ethanol. Perform a laparotomy to expose the abdominal cavity. Dissect out the pancreas and immediately rinse in a small weigh boat containing 6 ml of collagenase digestion buffer.
- Dissect away any large pieces of fat or visible blood vessels, then remove 5 ml of collagenase digestion buffer and add it back to the 15 ml conical tube.
- Using fine dissection scissors mince the pancreas in the small weighing boat containing 1 ml of collagenase digestion buffer. Mince until the resulting solution appears evenly dispersed.
- Transfer the minced product to a 125 ml Erlenmeyer plastic flask, and add the remaining 5 ml of collagenase digestion buffer to the container. Make sure the tissue is fully submerged in buffer.
- Place the flask in a 37 °C water bath and shake at 90 rpm for 30 min. During this short period of downtime, prepare calcium activating agonists (e.g. caerulein, carbachol) and rinse the 22×22 mm acid-washed coverslips with DI water. Dry, and then place on top of a flat surface lined by laboratory film.
- After the 30 min digest is complete, transfer the suspension back to the 15 ml conical tube and allow the cells to settle. Carefully pipette out the collagenase digestion buffer and replace with 6 ml of BSA incubation buffer. Vigorously shake the tube by hand for 10 sec in order to disperse the cells into smaller clusters. Immediately upon shaking, remove any large, floating debris from the unsettled media.
- Allow the remaining cells to settle, and exchange the media with fresh BSA incubation buffer.
- Repeat step 1.11 twice, until the suspension is comprised of only small clusters which are only finely visible to the naked eye. The cells should resemble those depicted in Figure 1A (top row).
- Remove the BSA incubation buffer and replace with HEPES incubation buffer.
- Prepare a 750 μM, 100X stock of Fluo-4AM in 10% DMSO.
- Load the cells in the 15 ml conical tube containing the cell suspension and BSA-free HEPES incubation buffer. To do this, add an appropriate volume (1:100 dilution) of the stock solution to the cell suspension. Then plate 500 μl of this suspension onto each 22×22 mm coverslip.
- Keep coverslips in the dark at room temperature. Take the first Ca2+ measurements 30 min after loading. The dye is automatically removed from the medium upon starting the perfusion, which should occur 30 min after dye loading.
2. Measuring Calcium in Pancreatic Acinar Cells
- Rinse each perfusion set-up with DI water and fill with an appropriate amount of buffer or agonist. Prime each syringe with buffer or agonist to insure proper flow. Clamp syringes to a ring stand approximately 1-2 feet above the microscope stage.
- Use fine tweezers to carefully grasp from its edge one coverslip containing cell suspension. Tilt the coverslip 45°, and allow the excess buffer to run off. Place the coverslip on top of the rubber gasket with the cells on top of the coverslip, and assemble the chamber (Figures 2A and 2B).
- Secure the perfusion chamber to the stage and insert the tubing which contains buffer into the first inlet of the chamber (Figure 2C). Turn the syringe containing buffer on and allow the buffer to perfuse over the entire surface of the coverslip. Once the buffer has reached the opposite end of the chamber, insert a vacuum line into the vacuum inlet. Insert any other tubes (containing agonist, inhibitors, etc.) into their appropriate position along the chamber.
- Visualize the cells using either a 200X or 400X, 1.4 numerical aperture objective and an argon laser to excite the Fluo-4AM dye at a wavelength of 488 nm (Figure 1A, bottom). The power settings of the laser should be adjusted such that the photomultiplier tube (PMT) is not saturated by the emitted light. In addition, the voltage across the PMT needs to be optimized for maximum light detection.
- Long-pass emission signals of > 515 nm are collected at frame speeds of 2-5 sec/frame for visualizing slow oscillatory patterns and 0.2-0.3 sec/frame for visualizing faster, global calcium waves (Figures 3 and 4).
- After imaging is complete, close the syringes and remove all tubing. Disassemble the chamber and repeat steps 2.2-2.4.
- Collect data as numerical values of fluorescence intensity over time and transfer to Image J (software package provided as freeware by the National Institutes of Health and can be found at http://rsb.info.nih.gov/ij/).
- View real-time cellular images and identify regions of interest (ROIs; i.e. apical, basolateral, nuclear, etc.)
- Acquire fluorescence intensities for these ROIs and represent as fluorescence intensity/baseline fluorescence intensity (i.e. F/F0).
- Generate tracings by plotting F/F0 vs. time. In addition to tracings, representative images are commonly provided and displayed using pseudocolor.
3. Preparation of Pancreatic Acinar Cells for Cell Injury Assays
- Warm DMEM F-12 media (without phenol red) to 37 °C.
- Add BSA (0.1% w/v final), and HCl (50 μM final) to the DMEM F-12 media.
- Aliquot 50 ml of DMEM into a conical tube.
- Prepare a collagenase buffer by adding 0.5 mg/ml (12 U/ml) of collagenase type IV to 10 ml of supplemented DMEM F-12 media.
- Euthanize one mouse by CO2 asphyxiation. Orient the animal in the supine position, and prepare the abdominal surface by cleaning with 70% ethanol. Perform a laparotomy to expose the abdominal cavity. Dissect out the pancreas and immediately rinse in a small weighing boat containing 6 ml of collagenase buffer.
- Mince the tissue using fine dissection scissors for 3-5 min or until the resulting solution appears evenly dispersed.
- Transfer the minced tissue to a 125 ml Erlenmeyer flask with 5 ml of additional collagenase buffer, then place into a 37 °C water bath with shaking at 90 rpm for 5 min.
- Remove from the shaker, allow cells to briefly settle, and exchange with 5 ml of fresh collagenase buffer. Then incubate for an additional 35 min in a 37 °C water bath with shaking at 90 rpm.
- Vigorously resuspend the digest using a transfer pipette until the suspension appears homogeneous with no obvious cell clumps. Then gently pipette the cell suspension through a pre-wet nylon mesh into a conical flask.
- Vigorously pipette an additional 3 ml of fresh DMEM F-12 media (with collagenase) through the mesh, in order to force through any remaining cells.
- Add another 6-10 ml of DMEM F-12 media and allow the cells to settle for 2-3 min. Repeat this step twice, and remove the supernatant after the final wash.
- Add fresh DMEM F-12 media, resuspend the cells, and plate 500 μl of cell suspension into each well of a 48-well tissue culture plate. The cells should resemble those depicted in Figure 1B.
- Allow the plate to sit in a 37 °C water bath at 90 rpm for 5 min before adding agonists.
- Stimulate the cells with varying agonists for 2-4 hr.
- Tilt the plate at an angle to allow the cells to settle and carefully pipette out an aliquot of media (usually 100 μl) and flash freeze in liquid nitrogen.
- Flash freeze the remaining cell suspension. Flash freezing is not essential for LDH measurements. As an alternative samples can be kept on ice if they will be assayed the same day or stored in -20 °C for long term storage.
4. Measuring Lactate Dehydrogenase Leakage
- Measure lactate dehydrogenase (LDH) leakage primarily using the reagents and instructions supplied in the Promega CytoTox 96 Non-Radioactive Cytotoxicity Assay kit (see Table of specific reagents and materials).
- Reconstitute the LDH substrate (that is provided in the kit) with 12 ml of assay buffer (also provided).
- Thaw frozen cell suspension and media samples in a water bath at room temperature.
- Plate 50 μl of each media sample in a 96-well plate.
- To the cell suspension, add the necessary volume of 10X lysis buffer so that the final concentration is 1X. Vortex briefly and incubate at 37 °C for 60 min.
- Centrifuge lysed samples at 250 x g for 4 min to pellet cell debris.
- For cell lysates, plate 50 μl of a 1:10 dilution into each well of a 96 well plate.
- Add 50 μl of reconstituted substrate to each well, incubate the plate in the dark at room temperature for 30 min.
- Stop the reaction by adding 50 μl of the stop solution (provided in the kit) to each well.
- Measure absorbance at 490 nm.
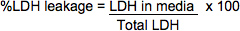
- Use the following formulae to calculate %LDH leakage. The optical densities below are corrected by subtracting out a blank OD reading from a well containing only PBS, substrate, and stop solution.
LDH in media = (Media OD492) x (media dilution factor) x (vol. of media)*Since it is usually unnecessary to dilute media samples, the dilution factor will most often equal1.
Total LDH = ((Lysate OD490) x (lysate dilution factor) x (vol. in cell suspension))+ ((Media OD490) x (dilution factor) x (vol. of media aliquoted for sampling))
5. Infecting Pancreatic Acinar Cells with Adenovirus
- Prepare pancreatic acinar cells as described in section 3.
- Following step 3.12, add 107 infectious units (IFUs) of adenovirus to the cell suspension and incubate for 30 min at 37 °C.
- Evenly plate 2 ml of cell suspension in a 6-well plate.
- For most expression constructs, cells should be adequately infected within 18 hr; and for some luciferase constructs, just within 6 hr.
An example of acinar cell calcium measurements in response to physiologic stimuli is provided in Figure 3. Acinar cells were loaded with the calcium dye Fluo-4 and perfused with the acetylcholine analogue carbachol (CCh; 1 μM)) 8. Cells responded in the form of a calcium wave which initiates in the apical region and propagates to the basolateral region 3,9. Representative tracings shown in Figure 3B demonstrate the typical peak-plateau pattern commonly observed with 1 μM carbachol. Conversely, using sub-maximal doses of the cholecystokinin analogue caerulein (10 pM) yields oscillatory calcium responses (Figure 4) 10.
Leakage of LDH from acinar cells in response to pancreatitis-inducing agonists is shown in Figure 5. Here we demonstrate concentration-dependent increases in LDH leakage in the presence of caerulein, carbachol, or the bile acid taurolithocholic acid-3 sulfate (TLCS). The concentrations necessary to induce maximal leakage of LDH are consistent with those required to induce intra-acinar protease activation and pathologic calcium signaling, suggesting these events may lead to injury.
Acinar cells were infected with a luciferase reporter adenovirus, that is driven by the promoter for a downstream Cn effector, nuclear factor of activated T cells (NFAT; Figure 6A). We provide representative data validating our infection method, demonstrating concentration- and time-dependent increases in NFAT-luciferase activity in the presence of TLCS (Figures 6B and 6C).
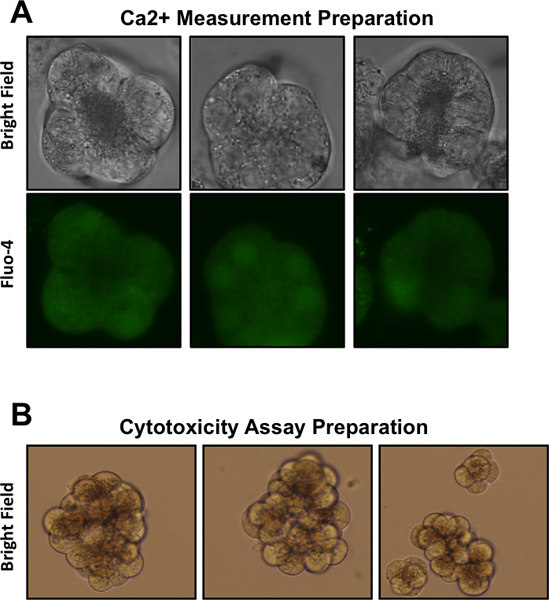
Figure 1. Representative images of pancreatic acinar cells following various preparations. (A) Acinar cells prepared for Ca2+ measurements, as visualized at 630X magnification. Top row depicts bright field microscopy, bottom row depicts acinar cells loaded with the Ca2+ dye Fluo-4 and visualized using fluorescence microscopy. (B) Acinar cells prepared for cytotoxicity assays, as visualized at 400X magnification.
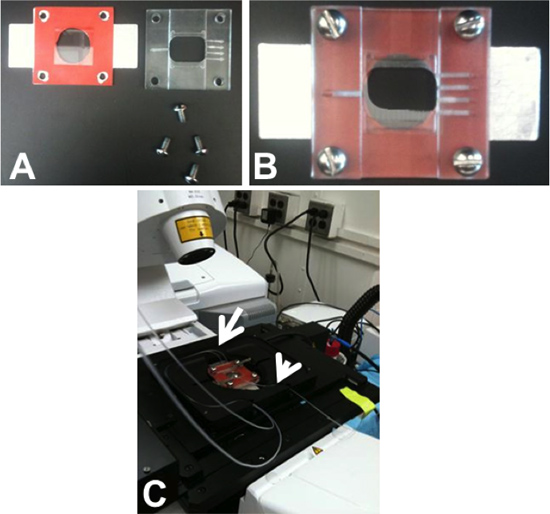
Figure 2. The perifusion chamber. (A) The chamber consists of three layers: a metal base; a rubber gasket; and a plastic cover. (B) The rubber gasket is placed on top of the metal base and a 22×22 mm coverslip containing cells is placed upwards on top of the rubber gasket. The plastic cover is screwed to the metal base and an 18×18 mm coverslip is placed on top. (C) The chamber is then secured to the microscope stage. Tubing, containing buffer or agonist, is fed into inlets located on the chamber’s edge (arrow). Separate tubing leads to a vacuum (arrow head).
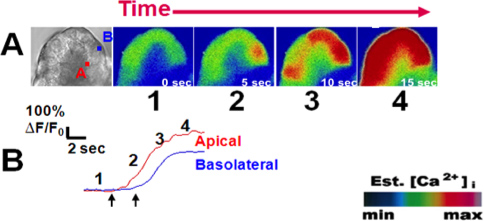
Figure 3. A typical peak-plateau calcium signal upon stimulation with carbachol (1 μM). (A) From left to right; Bright field view of an acinus labeled at the (A)pical and (B)asolateral regions of interest from an acinar cell. Cells were loaded with the calcium indicator Fluo-4 (5 μM). Upon stimulation with physiologic carbachol (1 μM; Ach analogue), subsequent images show the initiation of the calcium signal in the apical region followed by propagation to the basal region. (B) Each paneled image (1-4), corresponds to a frame along a representative tracing of change in fluorescence over time for each region of interest. Images are represented in pseudocolor with a color scale (bottom right). Left and right arrows show time of first calcium rise in the apical and basal regions, respectively. This figure was originally published in the Journal of Biological Chemistry. (Orabi A.I., Shah A.U., Muili K., Luo Y., Mahmood S.M., Ahmad A., Reed A., Husain S.Z. Ethanol enhances carbachol-induced protease activation and accelerates calcium waves in isolated rat pancreatic acini. The Journal of Biological Chemistry, 286, 14090-14097 (2011).
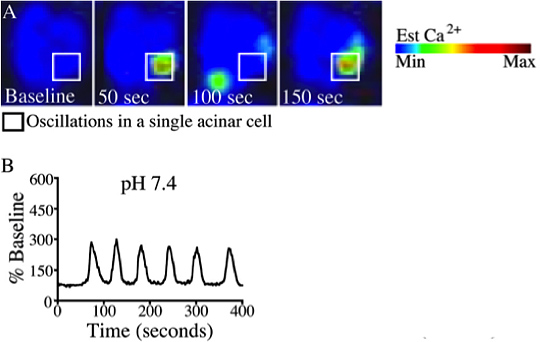
Figure 4. A typical calcium oscillation upon stimulation caerulein (10 pM). (A) Changes in whole cell cytosolic calcium were measured once per second by time-lapse confocal microscopy using the calcium dye Fluo-4/ AM. Images are represented in pseudocolor with a color scale (top right). (B) Representative plot of fluorescence over time were recorded from a single cell treated with caerulein (10 pM) at pH 7.4. This figure was originally published in the Journal of Biological Chemistry. (Reed A.M., Husain S.Z., Thrower E., Alexandre M., Shah A., Gorelick F.S., Nathanson M.H. Low Extracellular pH Induces Damage in the Pancreatic Acinar Cell by Enhancing Calcium Signaling. The Journal of Biological Chemistry, 286, 1919-1926 (2011).
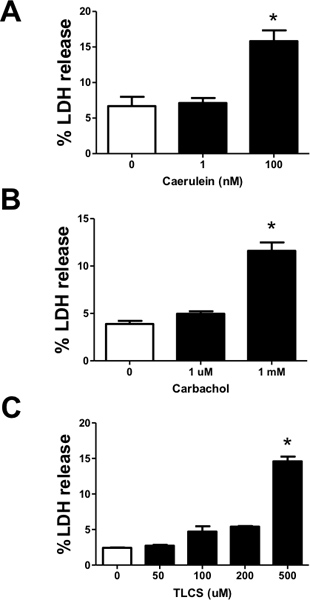
Figure 5. Measuring cell injury from acinar cells treated with various pancreatitis-inducing agonists. In isolated acinar cells, lactate dehydrogenase (LDH) leakage was used as a biochemical indicator of injury. Isolated acinar cells were treated with varying concentrations of (A) caerulein (1-100 nM) (B) carbachol (1 μM -1 mM) and (C) TLCS (50-500 μM), and %LDH leakage was measured after 2 hr. (n=3). #, *, P<0.05 compared to the control and TLCS alone, respectively.
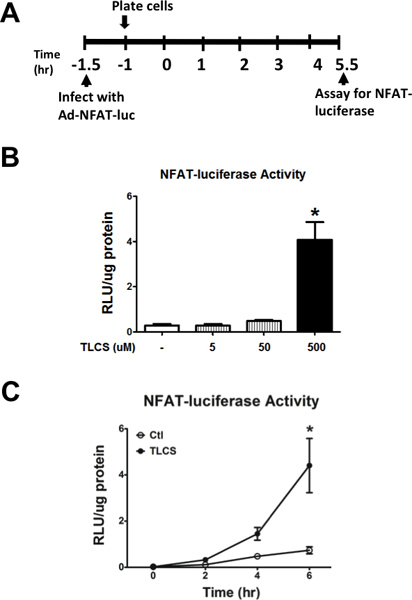
Figure 6. Measuring luciferase activity in pancreatic acinar cells infected with adeno-NFAT-luciferase. (A) Schema for the infection of primary mouse pancreatic acinar cells with adenoviral NFAT-luciferase. (B) Administration of TLCS (5-500 μM) induced NFAT-luciferase activity. (C) Time course demonstrating accumulation of luminescence with TLCS (500 μM) given over a 6 hr period. (n=3). *, #, P<0.05, relative to the control or TLCS alone, respectively.
