Vocal fold polyps can disrupt vocal fold dynamics and thus can have devastating consequences on a patient's ability to communicate. Three-dimensional flow separation induced by a wall-mounted model polyp and its impact on the wall pressure loading are examined using particle image velocimetry, skin friction line visualization, and wall pressure measurements.
The fluid-structure energy exchange process for normal speech has been studied extensively, but it is not well understood for pathological conditions. Polyps and nodules, which are geometric abnormalities that form on the medial surface of the vocal folds, can disrupt vocal fold dynamics and thus can have devastating consequences on a patient's ability to communicate. Our laboratory has reported particle image velocimetry (PIV) measurements, within an investigation of a model polyp located on the medial surface of an in vitro driven vocal fold model, which show that such a geometric abnormality considerably disrupts the glottal jet behavior. This flow field adjustment is a likely reason for the severe degradation of the vocal quality in patients with polyps. A more complete understanding of the formation and propagation of vortical structures from a geometric protuberance, such as a vocal fold polyp, and the resulting influence on the aerodynamic loadings that drive the vocal fold dynamics, is necessary for advancing the treatment of this pathological condition. The present investigation concerns the three-dimensional flow separation induced by a wall-mounted prolate hemispheroid with a 2:1 aspect ratio in cross flow, i.e. a model vocal fold polyp, using an oil-film visualization technique. Unsteady, three-dimensional flow separation and its impact of the wall pressure loading are examined using skin friction line visualization and wall pressure measurements.
The vocal folds are two bands of tissue that stretch across the vocal airway. Voiced speech is produced when a critical lung pressure is achieved, forcing air through adducted vocal folds. The vocal folds are composed of many layers of tissue and are often represented by a simplified two-layer body-cover system1. The extracellular matrix, which makes up the majority of the cover layer, is composed of collagen and elastin fibers, providing nonlinear stress-strain characteristics, which are important to the proper motion of the vocal folds1,2. Aerodynamic forces impart energy to the tissue of the vocal folds and excite self-sustained oscillations3. As the vocal folds oscillate, the opening between them, referred to as the glottis, forms a temporally-varying orifice that transitions from a convergent to a uniform and then to a divergent passage before closing and repeating the cycle4,6. Frequencies of vibration for normal speech typically span 100-220 Hz in males and females respectively, creating a pulsatile flow field that passes through the glottis7. The fluid-structure energy exchange process for normal speech has been studied extensively8-12; however, the disruption of this process for some pathologies is not well understood. Pathological conditions of the vocal folds can result in dramatic changes in their dynamics and affect the ability to generate voiced speech.
Polyps and nodules are geometric abnormalities that form on the medial surface of the vocal folds. These abnormalities can affect a patient's ability to communicate13. Nevertheless, only recently has the disruption of the flow field due to a geometric protuberance such as a polyp been considered14. That study showed that the "normal" fluid-structure energy-exchange process of speech was drastically altered, and that the modification of the flow field was the most likely reason for the severe degradation of vocal quality in patients with polyps and nodules. No comprehensive understanding of the flow structures produced by three-dimensional flow separation from a polyp in pulsatile flow has been established. The generation and propagation of vortical structures from a polyp, and their subsequent impact on the aerodynamic loadings that drive vocal fold dynamics is a necessary critical component to advance surgical remediation of polyps in patients.
While flow separation from a wall mounted hemispheroid in steady flow has been investigated15-23, surprisingly, there is little information regarding unsteady three-dimensional flow separation from a hemispheroid on a wall subject to pulsatile or unsteady flow conditions as are found in speech. The seminal work of Acarlar and Smith15 provided an analysis of the three-dimensional coherent structures generated by steady flow over a wall mounted hemispheroid within a laminar boundary layer. Acarlar and Smith identified two types of vortical structures. A standing horseshoe vortex was formed upstream of the hemispheroid protuberance and extended downstream of the protuberance on either side. Additionally, hairpin vortices were shed periodically from the wall mounted hemispheroid into the wake. The complex motion and progression of the hairpin vortices was investigated and described in detail.
Flow over a smoothly contoured axisymmetric hill has been previously studied in which both surface static pressure measurements and surface oil visualization were acquired on and downstream of the bump within a turbulent shear flow. Oil-film techniques enable the visualization of skin friction lines, high and low velocity regions, and separation and attachment points within a surface flow, and are useful to investigate the wake of a wall-mounted object. For this technique, the surface of interest is coated with a thin film of an oil-base and fine powder pigment (i.e. lampblack, graphite powder, or titanium dioxide) mixture. At the desired flow conditions, frictional forces cause the oil to move along the surface causing the pigment powder to be deposited in streaks. Critical or singularity points, locations where the shear stress is zero or two or more components of the mean velocity are zero, can be classified from the resulting skin friction line pattern as saddle points or nodal points24-26.
For the hill geometry, no singularity caused by separation was found upstream; this was attributed to the smoothly ascending contour of the bump, which did not generate the adverse pressure gradient that occurs with a hemispheroid protuberance. Consequently, the flow was found to accelerate until the pinnacle of the bump after which, unsteady saddle-focus separation points developed shortly past the bump centerline, as would be expected from the formation of a hairpin vortex27,28. In a study using similar experimental techniques with a different wall-mounted geometry, oil-film visualization around a surface-mounted cube in steady flow performed by Martinuzzi and Tropea29 displayed two clear skin friction lines upstream of the object. The first skin friction line corresponded to the primary separation line caused by the adverse pressure gradient and the second skin friction line marked the time-averaged location of the horseshoe vortex. Surface pressure measurements performed upstream of the object showed a local minimum along the horseshoe vortex line and a local pressure maximum between the primary separation and horseshoe vortex lines. Similar upstream separation lines are formed with other surface-mounted geometries including a circular cylinder, pyramid, and cone29-31. Surface visualization downstream of wall-mounted objects typically displays two foci caused by the recirculation region behind the object30. Two vortices are generated at the foci positions and correspond to the "arch-type" or hairpin vortex seen in the wake of a wall-mounted hemispheroid32.
Particle image velocimetry (PIV) has been previously used to study the flow downstream of synthetic vocal fold models33-35. PIV is a noninvasive visualization technique which images flow tracer particle movement within a plane at to capture spatio-temporal fluid dynamics36. Three-dimensional coherent structures which form downstream of the oscillating vocal folds have been studied by Neubauer et al.37; vortex generation and convection and jet flapping was observed. Recently, Krebs et al.38 studied the three-dimensionality of the glottal jet using stereoscopic PIV and the results demonstrate glottal jet axis switching. Erath and Plesniak14 investigated the effect of a model vocal fold polyp on the medial surface of a 7.5 times scaled-up dynamically driven vocal fold model. A recirculation region was formed downstream of the polyp and the jet dynamics were affected throughout the phonatory cycle. The previous studies, barring the driven vocal fold polyp study by Erath and Plesniak14, have not explored the fluid dynamics induced by a medial vocal fold polyp or nodule.
It is important to understand the fluid dynamic effect of the model polyp within steady and pulsatile flow fields before including the additional complexity of the vocal fold moving walls, induced pressure gradients, confined geometric volume and other intricacies. The current work focuses on the signature of the flow structures on the downstream wall under both steady and unsteady flow conditions. The interactions between the vortical structures that are shed from a protrusion and the downstream wall is of great interest for the investigation of vocal fold polyps as well as other biological considerations, as these interactions elicit a biological response.
In this work, a wall-mounted prolate hemispheroid, i.e. a model vocal fold polyp, is positioned on the test section floor of a suction type wind tunnel with a 5:1 contraction ratio. Unsteady, three-dimensional flow separation and its effect on the wall pressure loading are investigated using oil-flow visualization, wall pressure measurements, and particle image velocimetry. The unsteady pressure measurements are acquired using a sixteen channel scanning pressure transducer with piezoresistive pressure sensors. The pressure sensors have a frequency response of 670 Hz. Static pressure taps formed from stainless steel tubulations are flush-mounted upstream and downstream of the model vocal fold polyp to facilitate the surface pressure measurements and short-plumbed to the scanning pressure device. Oil-flow visualization and surface pressure measurements cannot be acquired simultaneously because oil would flow into the pressure taps causing fouling.
The following section provides the protocol for setting up and acquiring oil-film visualization and surface pressure measurements around a wall mounted prolate hemispheroid. Although phase-averaged and time resolved particle image velocimetry measurements are being acquired, the PIV acquisition is not included in this protocol. The authors suggest the references by Raffel et al.36 and Adrian and Westerweel39 for an in depth understanding of PIV experimental setup, data acquisition, and data processing.
1. Generate Protuberance (i.e. Model Polyp)
2. Oil-flow Visualization Preparation
3. Oil-flow Visualization Measurements
4. Surface Pressure Measurement Preparation
5. Surface Pressure Measurement Acquisition
Previous work using a 7.5 times scaled-up dynamically driven vocal fold model has demonstrated that the presence of a geometric protuberance, model vocal fold polyp, disrupts the normal dynamics of the glottal jet throughout the phonatory cycle. Representative results from the previous driven vocal fold model study are displayed in Figure 2 and Video 2. The video demonstrates the motion of the driven vocal folds as they change from a convergent to a divergent geometry. The vocal fold models were dynamically driven at 1.67 Hz with a Reynolds number of 995 and a Strouhal number of 1.9 x 10⁻². Data were acquired in the traverse plane 7.5 mm downstream of the polyp using phase-averaged particle image velocimetry14. As the vocal folds begin to open, a convergent channel is formed and a favorable pressure gradient is developed. The flow begins to rotate around the model polyp towards the end of the opening phase, when the glottis is at is maximum width and the vocal folds are in a parallel configuration, and into the closing phase. Two counter rotating vortices are formed as shown in Figures 2b and 2c. As the vocal folds close, the flow is forced around the polyp and away from the anterior-posterior midline. The ongoing work is an investigation of the effect of a wall-mounted hemispheroid in both steady and pulsatile cross flow conditions without the added complexities of the physiological vocal folds. Preliminary results have been acquired for a 2:1 aspect ratio prolate hemispheroid; a schematic of the experimental test section is displayed in Figure 1. The model polyp was tested under steady flow conditions at Reynolds numbers ranging from 6,000-9,000; the oil-flow visualization results are displayed in Figures 3 and 4. Figure 3 presents an isometric view of the model polyp under steady conditions with the flow moving from left to right. The concentrated oil line upstream of the polyp (to the left of the polyp) and on the surface of the polyp display the separation lines. The large concentrated oil region just downstream (to the right) of the polyp presents the vorticity concentration nodes which are the attachment points for two counter-rotating vortex tubes that form the legs of the downstream hairpin vortex. Figure 4 displays a top view of a model polyp in cross flow with the flow moving from top to bottom at a Reynolds number of 9,000. The attachment node is visible downstream (below) the model vocal fold polyp. The oil-flow visualization results for the steady flow conditions confirm the formation of a horseshoe vortex system upstream of the model polyp and hairpin vortices downstream of the protuberance as shown with other wall mounted objects18,24,29,40.
Unsteady flow conditions, with the Reynolds number (based on the mean velocity of 7.01 m/sec) of 6,300 and a Strouhal number of 1.2 x 10⁻³, result in spatial and temporal pressure variations. The unsteady flow oscillates ± 2.29 m/sec at a frequency of 0.6 Hz. Figure 5 displays the upstream and downstream pressure measurements throughout a single oscillatory cycle. The red line (located at position number 3) indicates the site of the lowest pressure in the backflow region directly downstream of the polyp. The individual pressure transducer values were found to change throughout the cycle and the pressure difference among the transducer locations varied as a function of the cycle location and therefore mean velocity.
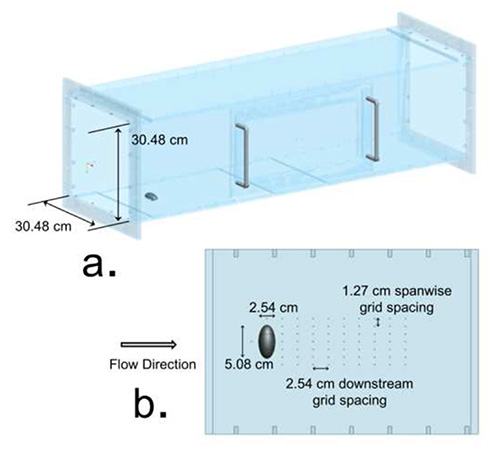
Figure 1. Wind tunnel test section schematic. a.) Full test section shown with the flow inlet on the left and outlet on the right. b.) Close-up schematic of the removable test section floor plate with a 2:1 aspect ratio wall mounted prolate hemispheroid. Click here to view larger image.
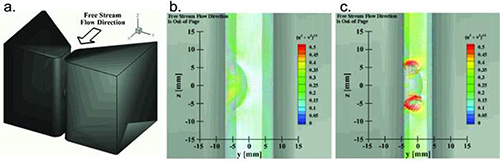
Figure 2. Velocity fields downstream of a model vocal fold polyp mounted on the medial surface of a 7.5 times scaled-up driven vocal fold model. a.) Dynamically driven vocal fold model schematic displaying the free stream flow direction. b.) and c.) Transverse velocity fields at two instants during the phonatory cycle in the y-z plane at x = 7.5 mm downstream of a model polyp mounted on the medial surface. The velocity fields are plotted as vector plots of velocity magnitude14. Click here to view larger image.
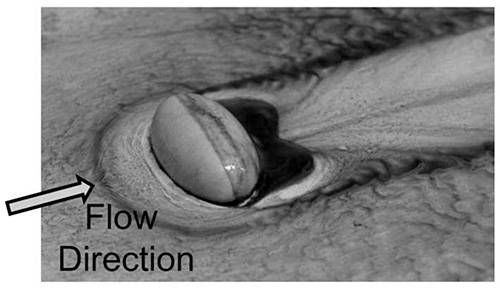
Figure 3. Isometric view of a wall-mounted prolate hemispheroid (i.e. model vocal fold polyp) in cross flow (Re = 9,000). The primary upstream separation line is displayed as the dark line upstream (to the left) of the polyp. Two vorticity concentration nodes are located in the near wake of the wall mounted prolate hemispheroid. Click here to view larger image.
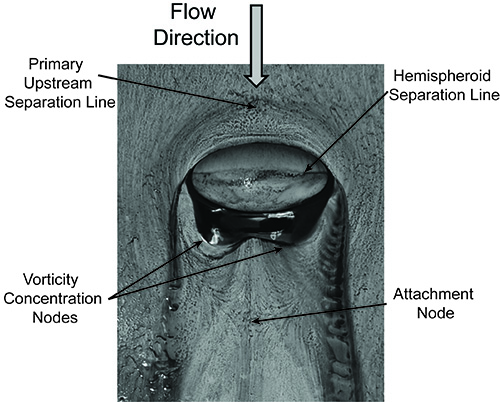
Figure 4. Oil-flow visualization image for a prolate hemispheroid in cross flow (Re=9,000). The dark lines extending downstream from the sides of the polyp (representing the outer limits of the wake) converge until the attachment point, due to the recirculation vortex behind the object. The locations of the primary upstream separation line, hemispheroid separation line, vorticity concentration nodes and the downstream attachment node are identified. Click here to view larger image.
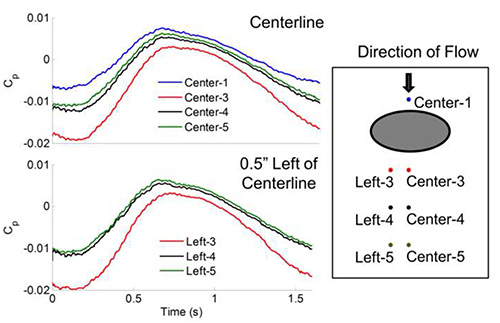
Figure 5. Upstream and downstream pressure measurements of a single cycle of unsteady flow at a Reynolds number based on the mean velocity of 6,300 and a Strouhal number of 1.2 x 10⁻³ over a wall mounted prolate hemispheroid. Spatial and temporal pressure differences were observed among the measured pressure transducers. Click here to view larger image.
Click here to view Video 1: Stewart_JoVE_Video_1_Title.wmv.
Click here to view Video 2: Stewart_JoVE_Video_2.avi.
Understanding the formation and propagation of vortical structures from a geometric protuberance and their subsequent effect on the aerodynamic loadings that drive vocal fold dynamics, is necessary to provide insight and models in order to advance the treatment of vocal fold polyps and nodules. The variations in aerodynamic loadings caused by the model polyp in this experiment are expected to contribute to irregular vocal fold dynamics observed in patients with polyps13,41. Future work includes investigating the three-dimensional flow separation in unsteady flow conditions using particle image velocimetry and correlating the results with surface flow visualization and surface pressure data.
Oil-flow visualization is a useful and effective technique for the identification of surface topological features such as skin friction lines and high and low velocity regions. The classification of separation or attachment lines and nodes from surface flow visualization is an important step in constructing topological maps, sometimes called vortex skeletons, of the separation and attachment regions of complex three-dimensional flows based on Critical Point Theory24,40,42. As oil-flow visualization is primarily a qualitative measurement, it is essential that the qualitative results from the oil-flow visualization be paired with the quantitative results from the surface pressure and PIV measurements. The development of a topological map is helpful in understanding and identifying the three-dimensional flow structures and linking the oil-flow visualization results to the PIV measurement results.
Limitations of the oil-flow visualization technique include the inability to acquire simultaneous oil-flow visualization data with surface pressure measurement or particle image velocimetry data, and the technique's limited ability to track unsteadiness and movement in the location of critical points caused by unsteady flows. The optimal oil-flow visualization mixture depends on experiment-specific parameters to adjust the viscosity and surface tension of the mixture based on the testing velocity, the problem to be investigated, and the testing surface characteristics. It is important that the oil mixture begin flowing at the desired velocity and that, after a reasonable amount of time, the surface should be relatively dry with the streaked surface pattern remaining. Refer to Merzkirch26 for a list of candidate oils and pigments to use for various conditions. An incorrect mixture, based on the specific experimental parameters, may result in either too much pigment deposited on the surface floor, which does not result in clear streaks, or not enough pigment deposited which does not result in a streak-like pattern at all. When applying the mixture to the test section floor, the authors found it best to spray the mixture instead of paint the mixture onto the surface, a method other investigators have used. Painting the mixture onto the surface resulted in additional streaky lines due to the application.
In this work, the surface oil-film visualization technique is implemented in steady flow conditions (Video 1). The steady flow testing conditions normally result in extremely clear images due to standing structures in the flow. However, oil-film visualization is also being performed in unsteady flow conditions. The authors are currently investigating if any additional information can be obtained from images captured under unsteady flow conditions and the validity of this technique. The unsteady flow testing conditions produce flow features which strengthen and weaken throughout a single oscillation cycle. For this reason, high-speed images of the dynamic oil-visualization region are acquired as the wind tunnel and unsteadiness generators are operating.
Investigating three-dimensional flow separation from a wall mounted hemispheroid in unsteady flow and the resulting wall pressures in the near wake will fundamentally improve our understanding of unsteady three-dimensional flow separation. In addition to speech applications, this technique has possible applications in the management of costal sand dunes, enhancement of secondary flow in heat exchanger design, mass transfer, and wind energy.
The authors have nothing to disclose.
This work is supported by the National Science Foundation, Grant No. CBET-1236351 and GW Center for Biomimetics and Bioinspired Engineering (COBRE).
Rapid Prototyper | Objet | Objet24 | Tray Size (X×Y×Z): 240 × 200 × 150 mm Build layer thickness = 28 µm Accuracy = 0.1 mm Build Resolution: X-axis: 600 dpi, Y-axis: 600 dpi, Z-axis: 900 dpi |
Rapid Prototyper Model Material | Objet | VeroWhite Plus Fullcure 835 | |
Rapid Prototyper Support Material | Objet | FullCure 705 Support | |
Copy Toner | Xerox | ||
Kerosene | Sunnyside | ||
Baby Oil | Johnson's | ||
Adhesive Paper | Con-Tact Brand | White adhesive covering | |
Tygon Tubing | Tygon | PVC Tubing | 1/16" ID, 3/16"OD |
Pressure Scanner (16 channel) | Scanivalve | DSA3217 | Used for gas pressure measurements Pressure range = +/- 5" H2O Full scale accuracy = +/-0.3% full scale accuracy. Maximum scan rate = 500 Hz/channel |
Stainless Steel Tubulations | Scanivalve | TUBN-063-1.0 | 0.063" Diameter and 1" Length |