Aip1p Dynamics Are Altered by the R256H Mutation in Actin
Summary
Disease-causing mutations in actin can alter cytoskeletal function. Cytoskeletal dynamics are quantified through imaging of fluorescently tagged proteins using total internal fluorescence microscopy. As an example, the cytoskeletal protein, Aip1p, has altered localization and movement in cells expressing the mutant actin isoform, R256H.
Abstract
Mutations in actin cause a range of human diseases due to specific molecular changes that often alter cytoskeletal function. In this study, imaging of fluorescently tagged proteins using total internal fluorescence (TIRF) microscopy is used to visualize and quantify changes in cytoskeletal dynamics. TIRF microscopy and the use of fluorescent tags also allows for quantification of the changes in cytoskeletal dynamics caused by mutations in actin. Using this technique, quantification of cytoskeletal function in live cells valuably complements in vitro studies of protein function. As an example, missense mutations affecting the actin residue R256 have been identified in three human actin isoforms suggesting this amino acid plays an important role in regulatory interactions. The effects of the actin mutation R256H on cytoskeletal movements were studied using the yeast model. The protein, Aip1, which is known to assist cofilin in actin depolymerization, was tagged with green fluorescent protein (GFP) at the N-terminus and tracked in vivo using TIRF microscopy. The rate of Aip1p movement in both wild type and mutant strains was quantified. In cells expressing R256H mutant actin, Aip1p motion is restricted and the rate of movement is nearly half the speed measured in wild type cells (0.88 ± 0.30 μm/sec in R256H cells compared to 1.60 ± 0.42 μm/sec in wild type cells, p < 0.005).
Introduction
Actin is the dominant protein comprising the cytoskeleton and participates in critical cellular processes including cell division, organelle movement, cell motility, contraction, and signaling. Over the past decade, disease-causing mutations in actin have been discovered in each of the six human actin isoforms leading to a range of disorders, from myopathies to coronary artery disease1-7. The processes by which actin mutations lead to disease continue to be elucidated. The yeast model remains the gold standard to study the biochemical effects of mutations on actin function owing to the advantages of the single essential actin isoform, genetic tractability and high conservation of actin sequence and function. Studies show that individual actin mutations lead to molecular specific dysfunctions with dominant negative effects8. For example, deafness-causing mutations in γ-non-muscle actin that affect the Lys-118 residue alter regulation by the actin binding protein Arp2/39. Studies frequently employ in vitro analyses of protein: protein interactions. Investigations into the effect of actin mutations on cell biology and, in particular, actin binding protein localization in the cell are limited.
Studies of the yeast cytoskeleton in vivo conventionally rely on images of fixed cells from an inverted fluorescence microscope10. These experiments supplied foundational data about the morphology of the actin cytoskeleton. Investigations have since incorporated three dimensional confocal imaging to visualize the complex cytoskeletal network11,12. This imaging permits quantification of the abundance and relative location of actin patches and filaments. Thin section electron tomography has been used to image the morphology of the dense filamentous networks relative to preserved subcellular structures13. Crowded cellular spaces with a small cross section can be examined in fine detail with this technique. Imaging studies have been extended to living cells using time lapse fluorescent microscopy. When photo bleaching and background fluorescence can be moderated, time lapse imaging allows investigations as to the dynamics of cytoskeletal proteins and the response to environmental conditions11,14. Separately, visualization of the dynamics of actin filaments in vitro was advanced by the introduction of total internal reflection fluorescence (TIRF) microscopy. Compared to wide field microscopy, TIRF has the advantage of decreased background fluorescence and enhanced contrast to monitor individual filaments15,16. With these qualities, TIRF microscopy has been adapted by cell biologists to monitor cellular structures at the plasma membrane17,18. Cellular events, including changes in the cytoskeleton, can be visualized real time with low phototoxicity, maximal contrast, and minimal background florescence19.
To better understand the effect of actin mutations on the movement, localization, and turnover of cytoskeletal proteins in the cell, TIRF microscopy and protein tagging were used. Herein, methods to study the effects of a clinically relevant mutation in actin on cytoskeletal dynamics in Saccharomyces cerevisiae are described. Specifically, the localization and movement of the actin binding protein, Aip1p, was visualized and quantified in cells expressing the R256H mutation in actin. These techniques complement in vitro biochemical studies and allow for a greater understanding of protein interactions and functions.
Protocol
1. Cloning into the PB1996 Plasmid
- Design and order DNA primers from an oligonucleotide manufacturing company that flank the target sequence and contain unique restriction sites in the selected parent plasmid. NOTE: In this case, primers were designed to amplify the 400 base pairs at the 5’ end of the Aip1 sequence. The XhoI restriction site was incorporated into the primer about 20 bp before the Aip1 sequence, and XmaI was included about 20 bp after the target Aip1 sequence. The plasmid used for cloning was PB1996, which contains a 3XGFP tag for fluorescence, a URA gene for yeast strain selection, and an ampicillin resistance gene for bacterial selection.
- Purify the genomic DNA from a Ura- yeast haploid strain. Note: Refer to Figure 1 for a diagram of cloning process.
- Run a standard PCR reaction using the two primers and the yeast genomic DNA to amplify the Aip1p gene with the restriction sites on either end. Digest the PCR product and the PB1996 plasmid with the restriction enzymes in separate reactions per manufacturer recommended protocols. In this case XmaI and XhoI were used with the accompanying buffer at 37 °C for 1 hr.
- Run a 0.8% agarose electrophoresis gel to separate the digested DNA fragments. In one well, load a low DNA mass ladder and, in separate wells, load the whole reaction from each digestion. Run the gel at 100 volts for about 1 hr, until the dye front is near the end of the gel. Visualize the gel under a UV light and purify out the segment that corresponds to the protein segment and the cut plasmid.
- Ligate the digested Aip1 segment and PB1996 plasmid. Transform the product into DH5α cells using manufacturer protocols (10 μl DNA with 100 μl cells for 30 min on ice, heat shock at 42 °C for 2 min, grow in SOC media for 2 hr at 37 °C) and plate onto culture plates that include the antibiotic for selection, in this case LB+Amp plates. Select and grow one colony in liquid culture. Purify the newly designed plasmid.
2. Mutant Yeast Strain Generation
- Use a haploid yeast strain in which the actin allele has been deleted to build a mutant yeast strain. Note: In this case, the parent strain was a generous gift from Dr. Peter Rubenstein (University of Iowa) and the construction was described by Cook et al.20 This strain lacks the chromosomal actin gene and contains a plasmid that encodes wild type yeast actin and uracil.
- Use the pRS plasmid encoding wild type yeast actin with a Trp+ selection as the base plasmid for mutagenesis21.
- Perform site-directed mutagenesis on the pRS plasmid to engineer the missense mutation into actin.
- For the R256H mutation in actin, make the primer 5’ ggtaacgaaagattccatgccccagaagc 3’ to change the Arg256 to His256. Run a standard mutagenesis PCR reaction with the plasmid from step 2.2.
- Transform the mutant actin plasmid from the PCR into DH5α cells. Isolate the plasmid DNA and sequence the actin gene to verify the mutation.
- Transform the plasmid encoding mutant yeast actin into the haploid yeast strain from step 2.1.
- Culture the transformed cells on Trp- plates to select for yeast containing the Trp+ containing mutant yeast actin plasmid.
- Select for cells lacking the original plasmid that encodes wild type actin and uracil (described in 2.1) by sub-culturing cells from the Trp- plates on plates that contain 5-Fluoroorotic Acid (5-FOA). 5-FOA is converted to the toxic form, 5-flurouracil, in yeas strains expressing the functional URA3 gene. The cells that grow after the stepwise selection will contain only the mutant actin plasmid.
- Purify the plasmid DNA from the new yeast strain. Sequence the plasmid to ensure the mutant actin gene is present. Use this strain in further studies. This process is diagrammed in Figure 2.
3. Transforming the Plasmid into Yeast Cells
- Digest the Aip1p-GFP plasmid with a restriction enzyme to allow integration into the yeast chromosome. NOTE: The restriction site must be outside of the sequence block that contains the fluorescent tag, gene of interest, and selection marker. In this case, use 1 μl of HpaI restriction enzyme with 8 μl DNA and 1 μl of the accompanying 10x buffer for 1 hr at 37 °C.
- Culture S. cerevisiae cells (from step 2.5) that are unable to synthesize uracil (Ura- strain) overnight in 5 ml in YPD media (1% yeast extract, 2% peptone, and 2% dextrose) on a wheel at 30 °C. Spin down 1 ml of the cells for 5 min at 1,000 x g.
- Make PLATE mixture. Make 10XTE by adding 5 ml of 1 M Tris pH 7.5 and 2 ml of 250 mM ethylenediaminetetraacetic acid (EDTA) to 43 ml of ddH2O. Add 0.204 g of lithium acetate to 20 ml of 1XTE, then 8 g of polyethylene glycol (PEG) (MW ~3,300) and filter sterilize.
- Decant the supernatant from the cells spun down in step 3.2 and resuspend the cells in the remaining liquid. To the suspended cells, add 2 μl of 10 mg/ml salmon testes carrier DNA. Add 10 μl of the digested plasmid DNA from step 3.1 and vortex. Add 0.5 ml of PLATE and vortex. Add 20 μl of 1 M DTT and vortex.
- Incubate the mixture for 6-8 hr at 25 °C. Heat shock the cells in a water bath at 42 °C for 10 min. Plate 100 μl of cells from the bottom of the microcentrifuge tube where they have settled out onto a –Ura plate. Incubate at 30 °C for 2-3 days or until colonies form.
- Select individual colonies and streak out onto a –Ura plate. NOTE: These cells contain the plasmid with the Aip1-GFP and Ura gene integrated into the chromosome, allowing for growth. These cells will then be used in microscopy.
4. Visualizing the Aip1p Protein Movement Using Total Internal Reflection Fluorescence Microscopy
- Grow a culture of the yeast cells with the incorporated Aip1p-GFP in YPD overnight on a wheel at 30 °C. Subculture 1 ml of the overnight culture into 9 ml of –Ura media. Grow the cells for an additional 3-4 hr on a shaker at 30 °C to ensure that they are in log growth phase.
- Add 3 μl of cells to a glass microscope slide and add a coverslip. Allow the cells to settle on the slide for 5 min. Place the slide in the bracket of the stage plate.
- Observe the Aip1p-GFP protein with a total internal reflection fluorescence (TIRF) microscope (488 nm) using an oil immersion 100X TIRF objective and a digital CCD camera. Using SlideBook 5.0 software, obtain images for 20 sec at a rate of 5 frames/sec (Individual frames of acquired images are presented in Figure 2A).
- To focus on the cells, open SlideBook 5.0 software and click the Focus Window button in the toolbar to access the focus controls. Select the Scope tab and select the 100X-TIRF objective. Turn the lamp on and slide the lamp bar to 15%. Change the Bin setting to 2 x 2. Change filter to bright field.
- On the microscope, use the fine focus dial to bring the cells into focus as seen on the computer screen.
- Using the controls within the Focus Window, turn the lamp off, change the filter to Live, and click the TIRFM button.
- On the TIRFM illuminator attached to the right side port of the microscope, turn the laser emission to On.
- Select the Stream tab within the Focus Window, check the box next to Start Recording and then click bright field button.
- On the TIRFM illuminator, turn the micrometer to adjust the incident angle of the laser. This is used to optimize the fluorescence emission from the Aip1-GFP foci and minimize the background fluorescence from the cells and slide.
- When the desired image is displayed, press Start. After 20 sec, press Stop. Save the images. Under the File tab on the main menu bar, select Save Slide As and enter the file location and name.
- Use ImageJ software to analyze the images. Use the macro plugin “Manual Tracker” to track the movement and rate of the fluorescent Aip1p foci. Change the time interval parameter to 0.2 sec.
- Using the add track selection, select and track an individual fluorescent protein through four to eight connective frames. Use the end track command and the velocity of protein movement between each frame will display in a results window.
- Determine the mean rate between each frame using a Microsoft Excel spreadsheet. Use the values to compute the average velocity of Aip1p movement for each cell strain of interest. NOTE: A scatter plot of the rate of Aip1p movement and the average non-linear velocity is shown in Figure 2B.
Representative Results
A method to image the dynamics of cytoskeletal proteins in the cell is presented. The actin-binding protein, Aip1p, was tagged with GFP. The design for the plasmid encoding the tagged product is shown in Figure 1. The plasmid was then transformed into the yeast cells. Expression of the fluorescently tagged Aip1p allowed visualization of the protein behavior in the cell. Aip1p typically localizes to actin patches at sites of endocytosis22. To quantify Aip1p movement, more than 50 fluorescent Aip1p foci were tracked in more than 10 cells, as shown in Figure 2A. The average velocity was calculated for each fluorescent Aip1p area (see Figure 2B). In wild type cells, Aip1p movements range across a cell, and later disappear. The average speed of the movement of Aip1p in wild type cells is 1.60 ± 0.42 μm/sec. Cells expressing the R256H mutant actin, known to have abnormal morphology of the actin cytoskeleton23, have an altered Aip1p phenotype. In the mutant strain, Aip1p movement is restricted and slower. The average speed of Aip1p movement is 0.88 ± 0.30 μm/sec (p <0.005). The Aip1p migration is limited to the immediate area, with foci circling around each other rather than crossing the cell. In addition, Aip1p is visible longer suggesting slower turnover of Aip1 protein.
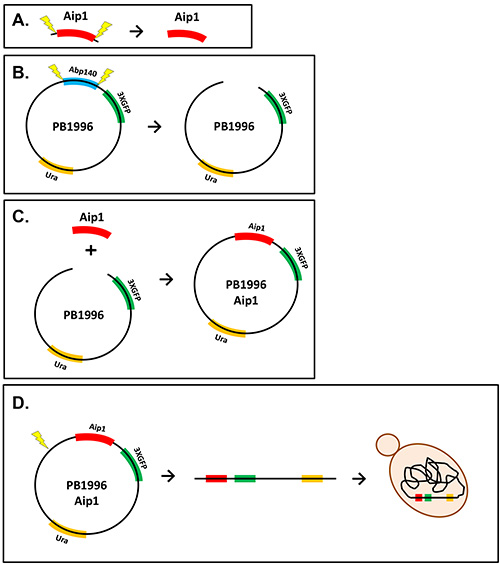
Figure 1. Diagram of plasmid construction. A) The Aip1 fragment amplified via PCR is shown being digested by restriction enzymes (yellow bolts). B) The plasmid, PB1996, is digested with restriction enzymes to remove the Abp140 gene. C) The digested Aip1 and PB1996 fragments are ligated to form the plasmid PB1996 Aip1. D) The PB1996 Aip1 plasmid is linearized and transformed into yeast cells where the DNA is integrated into the chromosome.
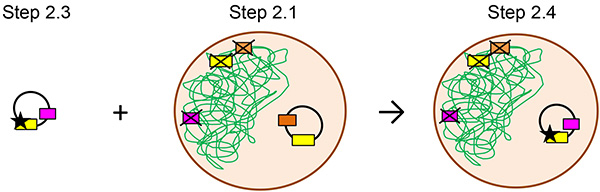
Figure 2. Diagram of mutant yeast actin strain construction. The plasmid encoding the mutant actin isoform is then transformed into a cell line and selected based on the ability to grow on media lacking tryptophan. The green lines indicate chromosomal DNA. The black circle is a plasmid. The brown circle represents a yeast cell. The boxes each indicate a specific gene: yellow is the actin, orange is leucine, brown is uracil, and pink is tryptophan. The X over the box indicates gene has been deleted from the chromosomal DNA. In steps 2.3 and 2.4, the black star on the actin gene indicates the R256H mutation.
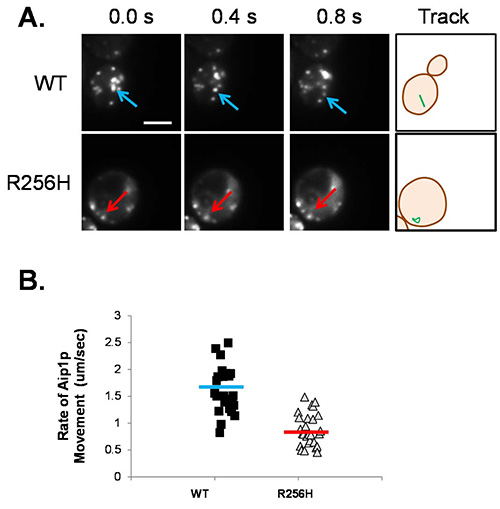
Figure 3. Aip1p-GFP movement in live yeast cells. A) Images of wild type and R256H cells expressing GFP-tagged Aip1p are shown. Cells are in early log phase growth and images were acquired every 0.2 sec for 15 sec. The arrows denote the location of an individual fluorescent focus over time, blue for wild type and red for mutant actin strains. The last frame shows the path of the Aip1 foci as a green line. Scale bar shown is 5 μm. B) The rate of Aip1p movement was measured using ImageJ. The scatter plot graph displays the rate for individual fluorescent foci. The horizontal bar indicates the average velocity for wild type (blue) and mutant (red) actin strains. Aip1p moves at 1.60 ± 0.42 μm/sec in wild type cells compared to 0.88 ± 0.30 μm/sec for cells expressing R256H mutant actin (p < 0.005).
Discussion
An effective strategy to visualize the dynamics of the cytoskeleton and the utility in investigations on pathogenic mutations has been described here. Advanced imaging modalities have created new opportunities to understand the intracellular movement of proteins near the cell membrane. Total internal reflection fluorescence microscopy (TIRF) is a sensitive technique for functional studies in living cells. TIRF uses an angled excitation laser that creates an evanescent field due to the difference in refractive indexes of the coverslip and aqueous medium. The energy of the evanescent field excites fluorophores but decreases exponentially with the distance of the interface between the coverslip and water. This results in a high signal to noise ratio and powerful resolution from 50-250 nm above the coverslip/medium interface. These qualities make TIRF microscopy a powerful tool to visualize cytoskeletal proteins at the single molecule level in living cells with less phototoxicity and enhanced contrast relative to other techniques24-26.
The cytoskeleton involves numerous proteins working in concert to adapt to cellular needs. The effect of vascular-disease causing mutations in actin on regulation by cofilin was recently studied by our group27. Based on our initial findings, Aip1p, an actin binding protein that facilitates cofilin-dependent actin severing, was investigated. In preliminary studies, cells expressing the actin mutation R256H grow poorly in the absence of Aip1p, especially under stress conditions. This suggests that the Aip1p regulation of the mutant actin cytoskeleton is altered. Our analyses of the movement and localization of Aip1p in the R256H strain using fluorescent tagging and TIRF microscopy corroborates the abnormal dynamics. In the future, we plan to tag additional proteins, such as cofilin, with different fluorophores to visualize the movement of multiple proteins simultaneously to better understand the protein: protein interactions.
There are some limitations to generating a fluorescently tagged protein and some instances where the technique is not feasible. A fluorescent tag can disrupt the activity of the protein or alter the interaction with binding partners. This has been encountered in attempts to tag cofilin, another actin binding protein. Expression of the tagged construct has been unsuccessful in haploid yeast due to disrupted cofilin function. Cofilin is an essential protein in yeast. Thus, deletion of cofilin without concomitant re-introduction is lethal; barring subsequent introduction on a plasmid. One way to avoid this limitation is to use diploid yeast. One copy of the cofilin gene was knocked out, a tagged version was exogenously introduced on a plasmid, and then selection for daughter cells that lack genomic cofilin but contain the plasmid22 The ability to fluorescently tag the protein was gained by adding the tag to internal residues in the protein that were previously shown to have little impact on its protein-protein interactions. The N- or C-terminus are preferable sites to add the tag unless the regions are known to influence pertinent protein: protein interactions. If this does not yield a functional protein, the alternate terminus or internal residues can be attempted.
There are a few critical steps in implementing the techniques described. One is determining the appropriate location to tag the protein that conserves function. Robust controls must be included to validate that protein function is preserved. Second, the slide must be monitored to ensure the cells do not desiccate during imaging. Wax can be used around the edges of the cover slip to prevent dehydration if needed. These steps to ensure success are straightforward making this approach tractable and advantageous to image structures near the plasma membrane. The ability to quantify protein localization and movement in live cells can enhance understanding of cellular functions. As mutations affecting cytoskeletal proteins are identified, expression of fluorescently tagged proteins and TIRF microscopy can be useful to investigate the pathophysiology underlying human disease.
Divulgazioni
The authors have nothing to disclose.
Acknowledgements
The authors thank Peter Rubenstein for useful discussion and technical advice and David Pellman for the original PB1996 clone. This work was supported by a grant from the March of Dimes and funding from the Ride for the Kids.
Materials
| Agarose | rpi | 9012-36-6 | |
| Bromophenol Blue | Amresco | 115-39-9 | |
| BSA | NEB | B9001S | |
| Change-IT Multiple Mutation Site Directed Mutagenesis Kit | USB Corporation | 4166059 | |
| CutSmart Buffer | NEB | B7204S | |
| DNA, single stranded from salmon testes | Sigma | 9007-49-2 | |
| EDTA pH 7.4 | Sigma | 93302 | |
| Ethidium Bromide | Invitrogen | 15585-011 | Warning! Harmful irritation |
| Fungal/Bacterial DNA Kit | Symo Research | D6005 | |
| HpaI | NEB | R0105S | |
| Lithium Acetate | AlfaAesar | 6108-17-4 | |
| Low DNA Mass Ladder | Invitrogen | 10068-013 | |
| NE Buffer #4 | NEB | B7004S | |
| Platinum PCR SuperMix High Fidelity | Invitrogen | 12532-016 | |
| Miniprep Kit | Qiagen | 27106 | Any kit will work |
| Quick Ligation Kit | NEB | M2200S | |
| Sodium azide | Sigma | 26628-22-8 | |
| PBS | Invitrogen | 10010-023 | |
| PEG | Amresco | 25322-68-3 | |
| Tris Base Ultrapure | rpi | 77-86-1 | |
| Wizard SV Gel and PCR Clean-Up System | Promega | 1/6/2015 | |
| XhoI | NEB | R0146S | |
| XmaI | NEB | R0180S | |
| YPD media | LabExpress | 3011 | |
| -URA Media | LabExpress | 3010 | |
| PCR Machine | Invitrogen | 4359659 | Any PCR machine will work |
| TIRF Microscope | Olympus IX81 | ||
| Hamamatsu ORCA-R camera | Hamamatsu |
Riferimenti
- Lehtonen, H. J., et al. Segregation of a missense variant in enteric smooth muscle actin gamma-2 with autosomal dominant familial visceral myopathy. Gastroenterology. 143, 1482-1491 (2012).
- Matsson, H., et al. Alpha-cardiac actin mutations produce atrial septal defects. Hum Mol Genet. 17, 256-265 (2008).
- Zhu, M., et al. Mutations in the gamma-actin gene (ACTG1) are associated with dominant progressive deafness (DFNA20/26). Am J Hum Genet. 73, 1082-1091 (2003).
- Nowak, K. J., et al. Mutations in the skeletal muscle alpha-actin gene in patients with actin myopathy and nemaline myopathy. Nat Genet. 23, 208-212 (1999).
- Olson, T. M., Michels, V. V., Thibodeau, S. N., Tai, Y. S., Keating, M. T. Actin mutations in dilated cardiomyopathy, a heritable form of heart failure. Science. 280, 750-752 (1998).
- Riviere, J. B., et al. De novo mutations in the actin genes ACTB and ACTG1 cause Baraitser-Winter syndrome. Nat Genet. 44, 440-444 (2012).
- Guo, D. C., et al. Mutations in smooth muscle alpha-actin (ACTA2) lead to thoracic aortic aneurysms and dissections. Nat Genet. 39, 1488-1493 (2007).
- Sparrow, J. C., et al. Muscle disease caused by mutations in the skeletal muscle alpha-actin gene (ACTA1). Neuromuscul Disord. 13, 519-531 (2003).
- Kruth, K. A., Rubenstein, P. A. Two deafness-causing (DFNA20/26) actin mutations affect Arp2/3-dependent actin regulation. J Biol Chem. 287, 27217-27226 (2012).
- Amberg, D. C. Three-dimensional imaging of the yeast actin cytoskeleton through the budding cell cycle. Mol Biol Cell. 9, 3259-3262 (1998).
- Pelham, R. J., Chang, F. Role of actin polymerization and actin cables in actin-patch movement in Schizosaccharomyces pombe. Nat Cell Biol. 3, 235-244 (2001).
- Vavylonis, D., Wu, J. Q., Hao, S., O’Shaughnessy, B., Pollard, T. D. Assembly mechanism of the contractile ring for cytokinesis by fission yeast. Science. 319, 97-100 (2008).
- Bertin, A., et al. Three-dimensional ultrastructure of the septin filament network in Saccharomyces cerevisiae. Mol Biol Cell. 23, 423-432 (2012).
- Senning, E. N., Marcus, A. H. Actin polymerization driven mitochondrial transport in mating S. cerevisiae. Proc Natl Acad Sci U.S.A. 107, 721-725 (2010).
- Breitsprecher, D., Kiesewetter, A. K., Linkner, J., Faix, J. Analysis of actin assembly by in vitro TIRF microscopy. Methods Mol Biol. 571, 401-415 (2009).
- Popp, D., Narita, A., Iwasa, M., Maeda, Y., Robinson, R. C. Molecular mechanism of bundle formation by the bacterial actin ParM. Biochem Biophys Res Commun. 391, 1598-1603 (2010).
- Trache, A., Lim, S. M. Live cell response to mechanical stimulation studied by integrated optical and atomic force microscopy. J Vis Exp. (44), (2010).
- Spira, F., Dominguez-Escobar, J., Muller, N., Wedlich-Soldner, R. Visualization of cortex organization and dynamics in microorganisms, using total internal reflection fluorescence microscopy. J Vis Exp. (63), e3982 (2012).
- Manneville, J. B. Use of TIRF microscopy to visualize actin and microtubules in migrating cells. Methods Enzymol. 406, 520-532 (2006).
- Cook, R. K., Sheff, D. R., Rubenstein, P. A. Unusual metabolism of the yeast actin amino terminus. J Biol Chem. 266, 16825-16833 (1991).
- Feng, L., et al. Fluorescence probing of yeast actin subdomain 3/4 hydrophobic loop 262-274. Actin-actin and actin-myosin interactions in actin filaments. J Biol Chem. 272, 16829-16837 (1997).
- Lin, M. C., Galletta, B. J., Sept, D., Cooper, J. A. Overlapping and distinct functions for cofilin, coronin and Aip1 in actin dynamics in vivo. J Cell Sci. 123, 1329-1342 (2010).
- Malloy, L. E., et al. Thoracic Aortic Aneurysm (TAAD)-causing Mutation in Actin Affects Formin Regulation of Polymerization. J Biol Chem. 287, 28398-28408 (2012).
- Smyth, J. W., Shaw, R. M. Visualizing ion channel dynamics at the plasma membrane. Heart Rhythm. 5, S7-S11 (2008).
- Bhattacharya, R., et al. Recruitment of vimentin to the cell surface by beta3 integrin and plectin mediates adhesion strength. J Cell Sci. 122, 1390-1400 (2009).
- Hetheridge, C., et al. The formin FMNL3 is a cytoskeletal regulator of angiogenesis. J Cell Sci. 125, 1420-1428 (2012).
- Bergeron, S. E., et al. Allele-specific effects of thoracic aortic aneurysm and dissection alpha-smooth muscle actin mutations on actin function. J Biol Chem. 286, 11356-11369 (2011).
