This article will demonstrate how to monitor glutamine dynamics in live cells using FRET. Genetically encoded sensors allow real-time monitoring of biological molecules at a subcellular resolution. Experimental design, technical details of the experimental settings, and considerations for post-experimental analyses will be discussed for genetically encoded glutamine sensors.
Genetically encoded sensors allow real-time monitoring of biological molecules at a subcellular resolution. A tremendous variety of such sensors for biological molecules became available in the past 15 years, some of which became indispensable tools that are used routinely in many laboratories.
One of the exciting applications of genetically encoded sensors is the use of these sensors in investigating cellular transport processes. Properties of transporters such as kinetics and substrate specificities can be investigated at a cellular level, providing possibilities for cell-type specific analyses of transport activities. In this article, we will demonstrate how transporter dynamics can be observed using genetically encoded glutamine sensor as an example. Experimental design, technical details of the experimental settings, and considerations for post-experimental analyses will be discussed.
Due to remarkable progress in technologies that allows examination of the transcriptome and the proteome at a cellular level, it has now become clear that the biochemistry and the resulting flux of metabolites and ions are highly cell-type specific. For example, in the mammalian liver, sequential glutamine degradation and synthesis are carried out simultaneously by periportal cells and perivenous cells respectively, feeding ammonium to the urea cycle in the former cell type while consuming excess ammonia in the latter 1-3. In some cases, significant biochemical heterogeneity is detected even in a single “cell type” 4,5. In addition to such spatial specificity, the cellular levels of metabolites and ions are highly dynamic (e.g., signaling molecules such as Ca2+ and cyclic nucleotides). The spatiotemporal patterns of metabolites and ions often play critical roles in signal transduction. Monitoring cellular dynamics of metabolites and ions, however, pose unique challenge. In many cases the change in concentrations are rapid and transient, exemplified by the case of signaling molecules such as Ca2+, which decays within ~20 msec in dendritic spines 6. In addition, compartmentalization of biochemical pathways within and among the cells makes it difficult to quantify the dynamics of metabolites and ions using extraction and column chromatography/mass spectrometry techniques.
Genetically encoded sensors for biological molecules are now widely used due to the high spatiotemporal resolution that allows the experimenter to study short-lived and/or compartmentalized molecular dynamics (reviewed in 7,8). These genetically encoded sensors can roughly be divided into two categories; intensity-based sensors and ratiometic sensors. Intensity-based sensors typically consist of a binding domain and a fluorescent protein (FPs), and the solute binding to the binding domain changes the fluorescent intensity. Ratiometic sensors, on the other hand, often take advantage of Föster Resonance Energy Transfer (FRET) between two FPs that function as a FRET pair. These sensors consist of a binding domain and two FPs, and the solute binding induces the change in FRET efficiency between the two FPs. A large number of sensors for biologically important metabolites and ions have been developed in the past decade 8,9.
One of the exciting possibility offered by such genetically encoded sensors is their use in the high-resolution analysis of membrane transport processes, which previously was not easy to detect at the cellular level. Genetically encoded sensors facilitate the analysis of transport mechanisms such as substrate specificity and pH dependence 10,11. Moreover, in combination with the genetic resources such as the library of RNAi constructs for model organisms, it is now possible to conduct genome-wide searches for novel transport processes using genetically encoded sensors. Indeed, use of genetically encoded sensor lead to the discovery of previously uncharacterized transporters in multiple cases 12,13.
Recently, our laboratory has developed a series of FRET-based sensor for glutamine. We have demonstrated that cellular glutamine levels can be visualized using such FRET glutamine sensors 10. These sensors consist of a FRET donor (mTFP1) inserted into a bacterial glutamine binding protein glnH, and a FRET acceptor (venus) at the C-termini of glnH (Figure 1). FRET efficiency of these sensors decrease upon binding of glutamine, resulting in the decrease of acceptor/donor intensity ratio. Fine regulation of glutamine transport processes is important in biological processes such as neurotransmission 14,15 and the maintenance of urea cycle in the liver 1,16,17.
Here we show the methodology of analyzing transport activities with FRET sensors for glutamine, using a wide-field fluorescence microscope set-up. The goal of experiments shown here are to detect transporter activities in a single cell and to examine substrate specificity of a transiently expressed transporter.
1. Sample Preparation
Note: In many cases perfusion experiments wash away a significant portion of cells, which can become a frustrating issue. Although not necessary for all cell lines, coating cover glass surfaces with poly-L-Lysine (add 1.0 ml/25 cm2 of 0.01% solution to the surface, incubate >5 min, wash twice with cell culture grade water, and dry in the biosafety cabinet) enhances cell adhesion. Also, be aware of the biosafety level (BSL) of the cell line used, and follow the standard operating procedure approved by the local environmental health and safety office. In this experiment, cos7 cells were used due to low endogenous glutamine transport activity (see Figure 4).
2. Perfusion Experiment
Note: For cos7 cells used in this experiment, perfusion media and chamber were kept at RT and ambient CO2 concentration. However, if the cells being used require higher temperature and CO2 concentration control for survival, heated microscope stage and/or an environmental chamber should be used.
3. Post-experiment Analysis
Typical time-course experiments are represented in Figure 2. In these experiments, FRET glutamine sensors with affinities of 8 mM (FLIPQTV3.0_8m, Figure 2A and 2B) and 100 μM (FlipQTV3.0_100 μ C and D) were co-expressed with an obligatory amino acid exchanger ASCT2 18 in cos7 cells 10. Influx of glutamine is detected as the change in fluorescence intensity ratios between the donor (mTFP1) and the acceptor (venus) (Figure 2A and 2C). Efflux of glutamine in the presence of another substrate (Ala) is also clearly demonstrated in these experiments. With both sensors, normalized fluorescent intensities change reciprocally (i.e., the donor intensity goes up as the acceptor intensity goes down, Figure 2B and 2D) in the presence of substrate, which suggest that the ratio change observed are indeed due to the change in FRET efficiency. These experiments show that the glutamine concentrations in these cells fluctuate very dynamically under the experimental condition; from the detection range of 100 μM sensor to the near-saturation concentration for 8 mM sensor.
Substrate specificities of transporters can also be examined using sensors, demonstrated in Figure 3. In these experiments the cells were pre-loaded with glutamine, and then various amino acids were added to the extracellular perfusate to examine whether those amino acids can induce glutamine efflux. As expected, ASCT2 substrates (Ala, Ser, Cys, Thr, D-serine) induced glutamine efflux (Fig. 3A), whereas non-substrate amino acids (Pro, His, Lys) did not (Fig. 3B), corroborating with previous studies 18. Usually, substrate specificity is measured by competition assays using a radio isotope-labeled substrate mixed with competing substrate, which is fairly laborious and requires a population of cells that are evenly expressing the transporter to be studied. Optical imaging exemplified here offers an alternative approach.
When no FRET efficiency changes are observed upon addition of the substrate, several reasons could be considered. One possible reason is the low uptake capacity for the substrate being tested and/or high activities of enzymes that maintain the concentration in the cells. For example, glutamine concentration change was minimal in cos7 cells that do not express ASCT2 transporter under the condition tested, even though this cell line can clearly grow in the media in which glutamine in the main nitrogen source (Figure 4). In addition, if the affinity of the sensor is either too high or too low compared to the intracellular concentration, most of the sensor proteins will remain constitutively bound or unbound respectively; hence no FRET efficiency change will be detected.
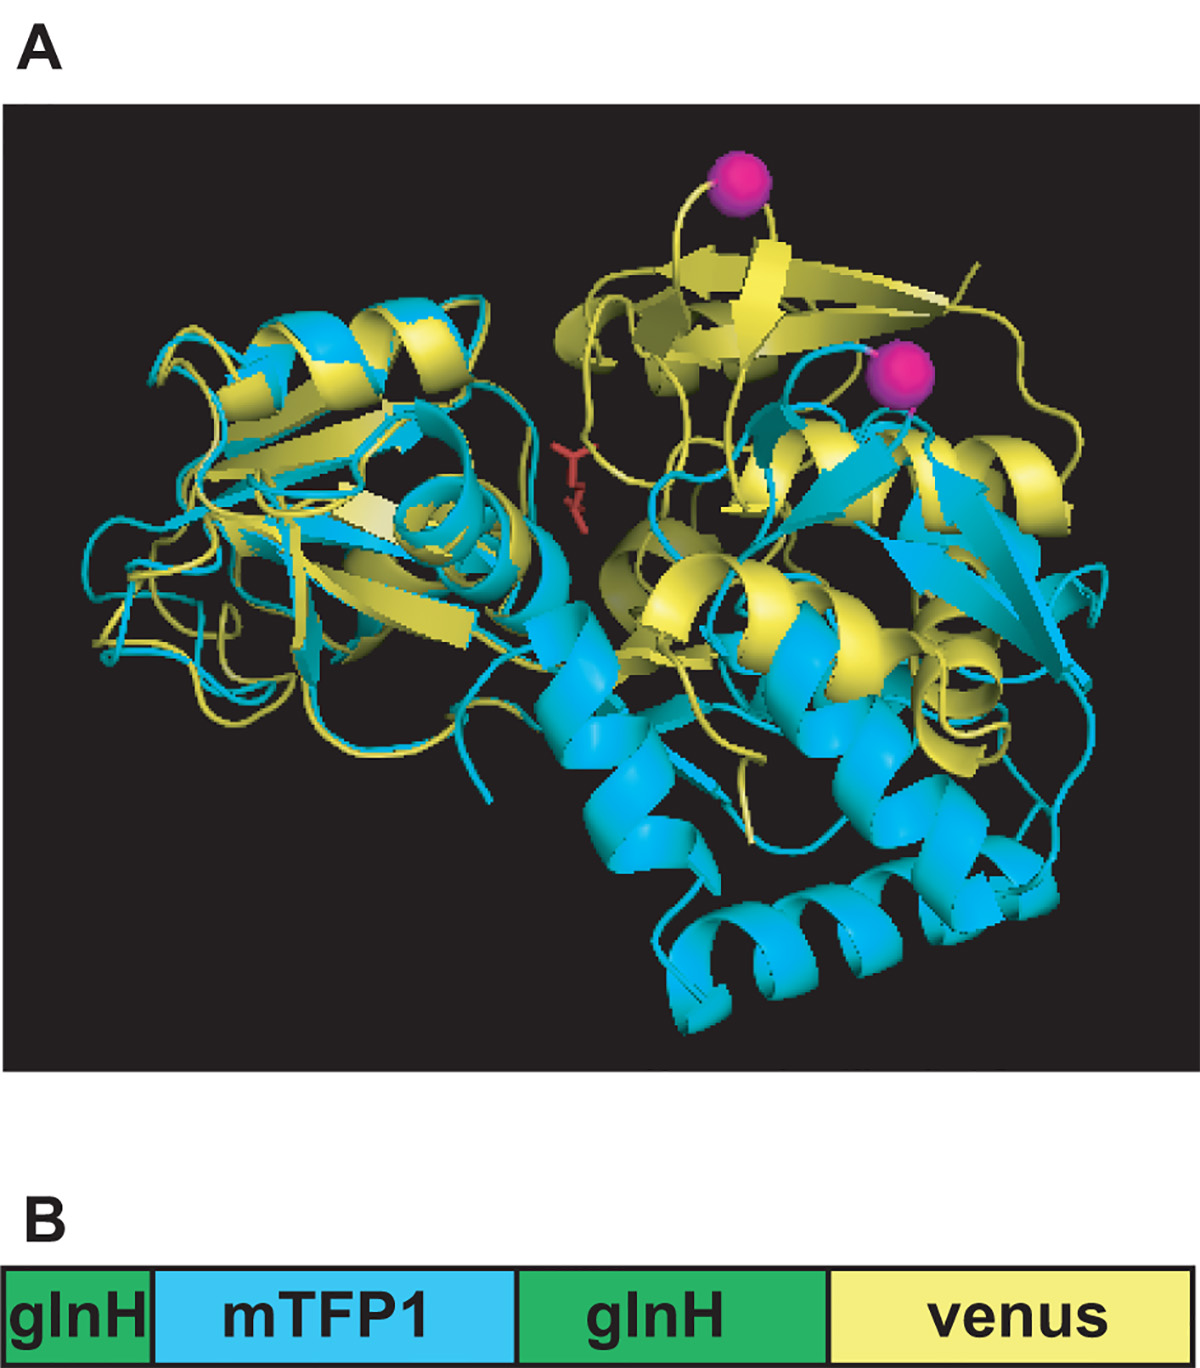
Figure 1. Configuration of a FRET glutamine sensor. (A) Open (cyan) and closed (yellow) conformation of glnH, glutamine binding protein from E.coli. The position where mTFP1 is inserted is marked in magenta. (B) Schematic representations of FLIPQTV_3.0 sensors.
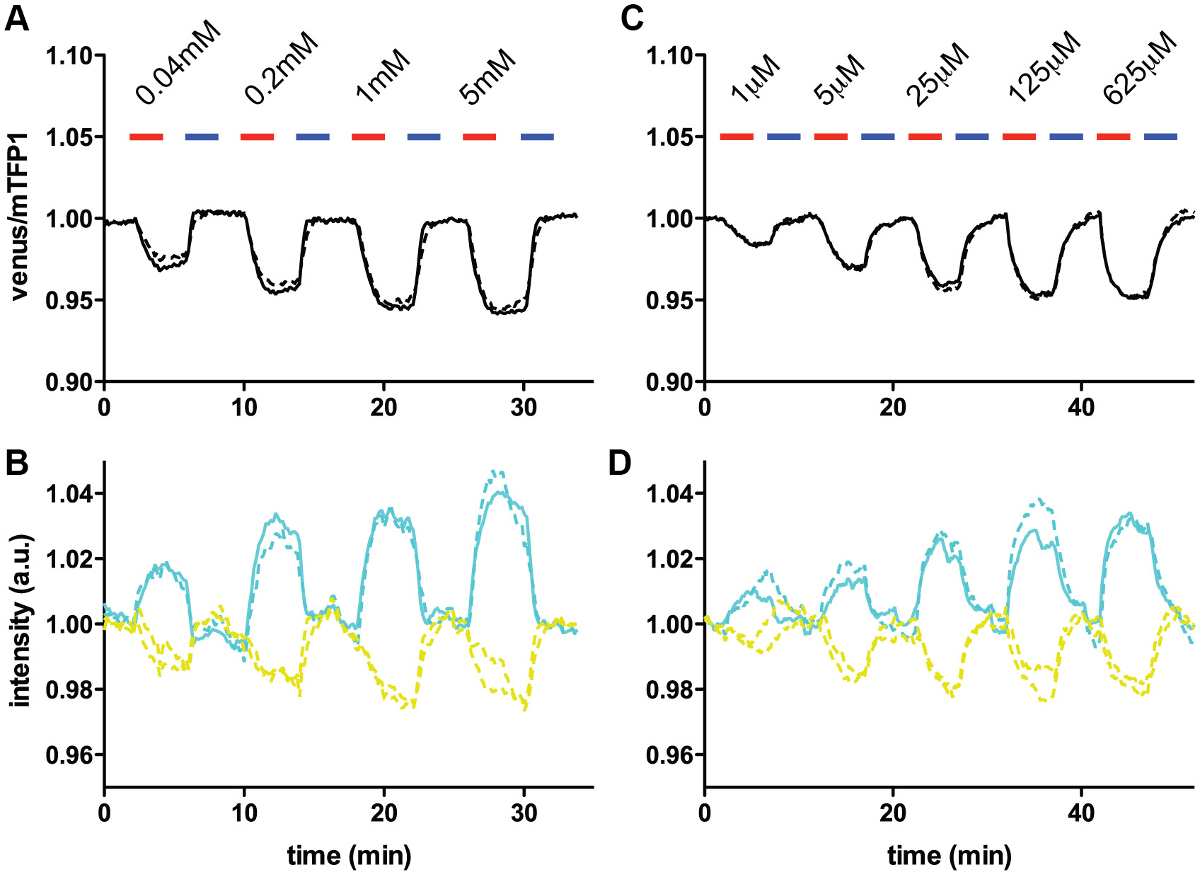
Figure 2. In vivo glutamine measurements using FLIPQ-TV3.0_8m and 100μ sensors. (A) The venus/mTFP1 ratio of cos7 cells co-expressing FLIPQ-TV3.0_8m sensor and ASCT2-mCherry. mCherry tag was used to identify the cells expressing the transporter without interfering the mTFP1 or venus emission channels. The cells were perfused with HEPES-buffered Hank’s buffer (pH 7.35). Timepoints when extracellular glutamine (red) and alanine (blue) was added to the perfusion media are indicated as boxes above the graph. Solid and dashed lines represent two individual cells measured in the same experiment. (B) The intensities of donor (mTFP1) and acceptor (venus) channels in the experiment shown in (A). The values were corrected for photobleaching and normalized to the baseline. (C) and (D) A similar experiment as in (A) and (B), performed with cos7 cells expressing the FLIPQ-TV3.0_100μ sensor. (Figure modified from 10).
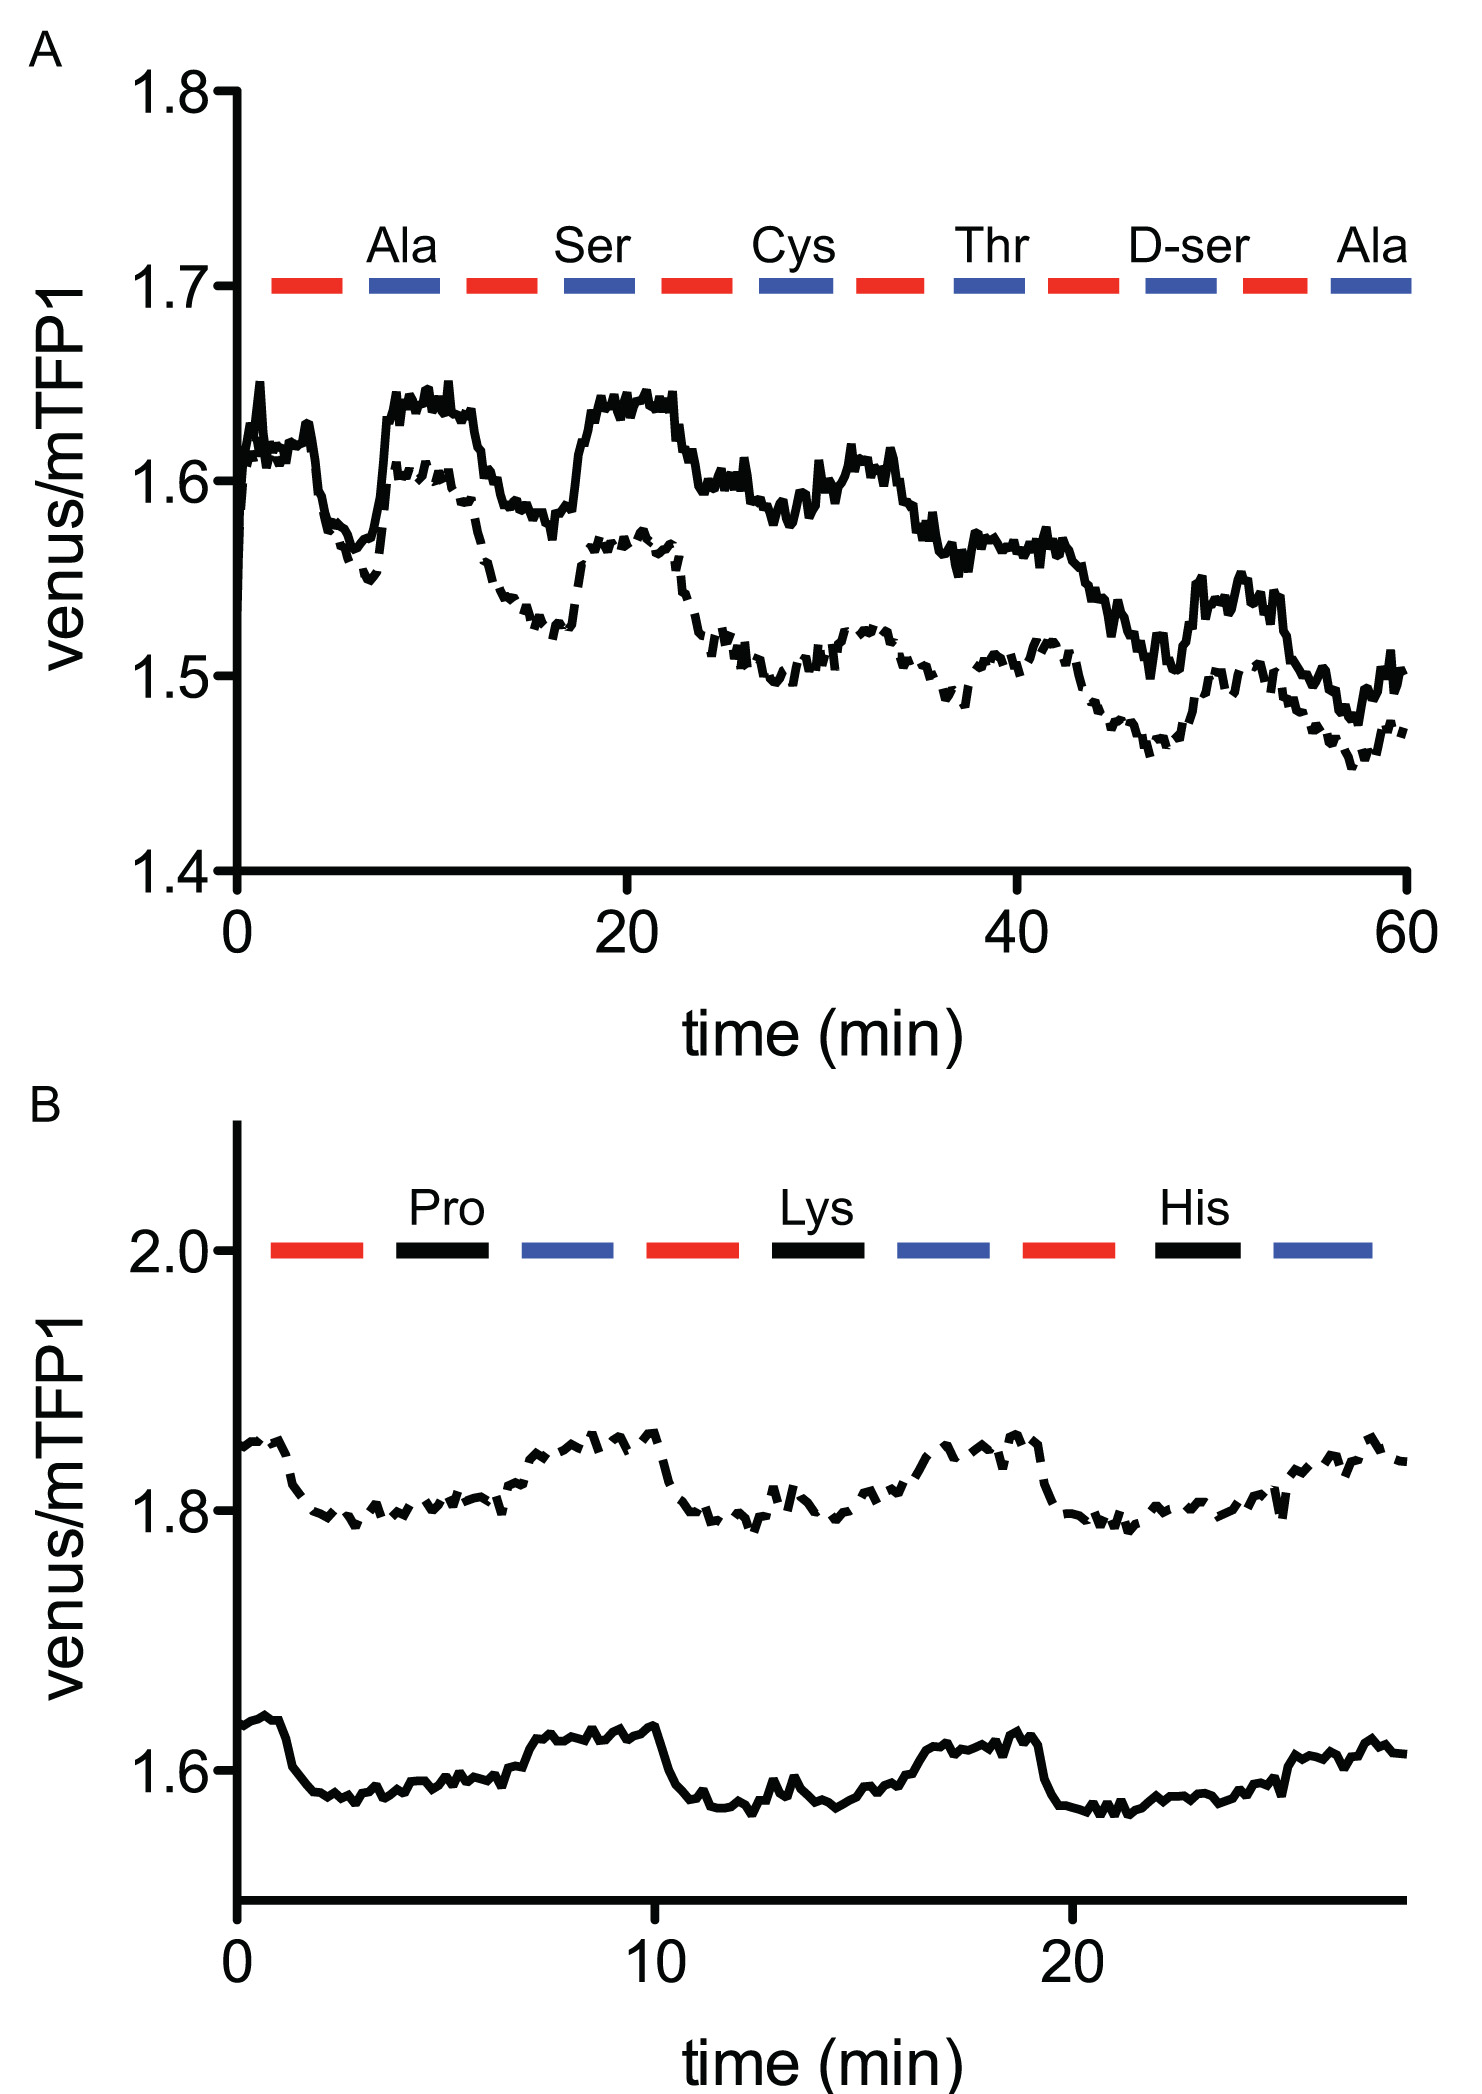
Figure 3. Elimination of cellular glutamine through the ASCT2 transporter in the presence of external amino acids, visualized using FLIPQ-TV3.0_8m sensor. (A) Cytosolic glutamine is exported by the addition of extracellular Ala, Ser, Cys, Thr, and D-ser. Timepoints when extracellular glutamine (red boxes) or other amino acids (blue boxes) were added to the perfusion media are indicated as boxes above the graph. (B) Addition of Pro, Lys, His (black boxes) does not alter cytosolic glutamine concentration, whereas the addition of Ala (blue boxes) promotes the export of glutamine. Solid and dashed lines represent two individual cells measured in the same experiment. All amino acids were added at 5 mM external concentrations. (Figure was originally published in 10).
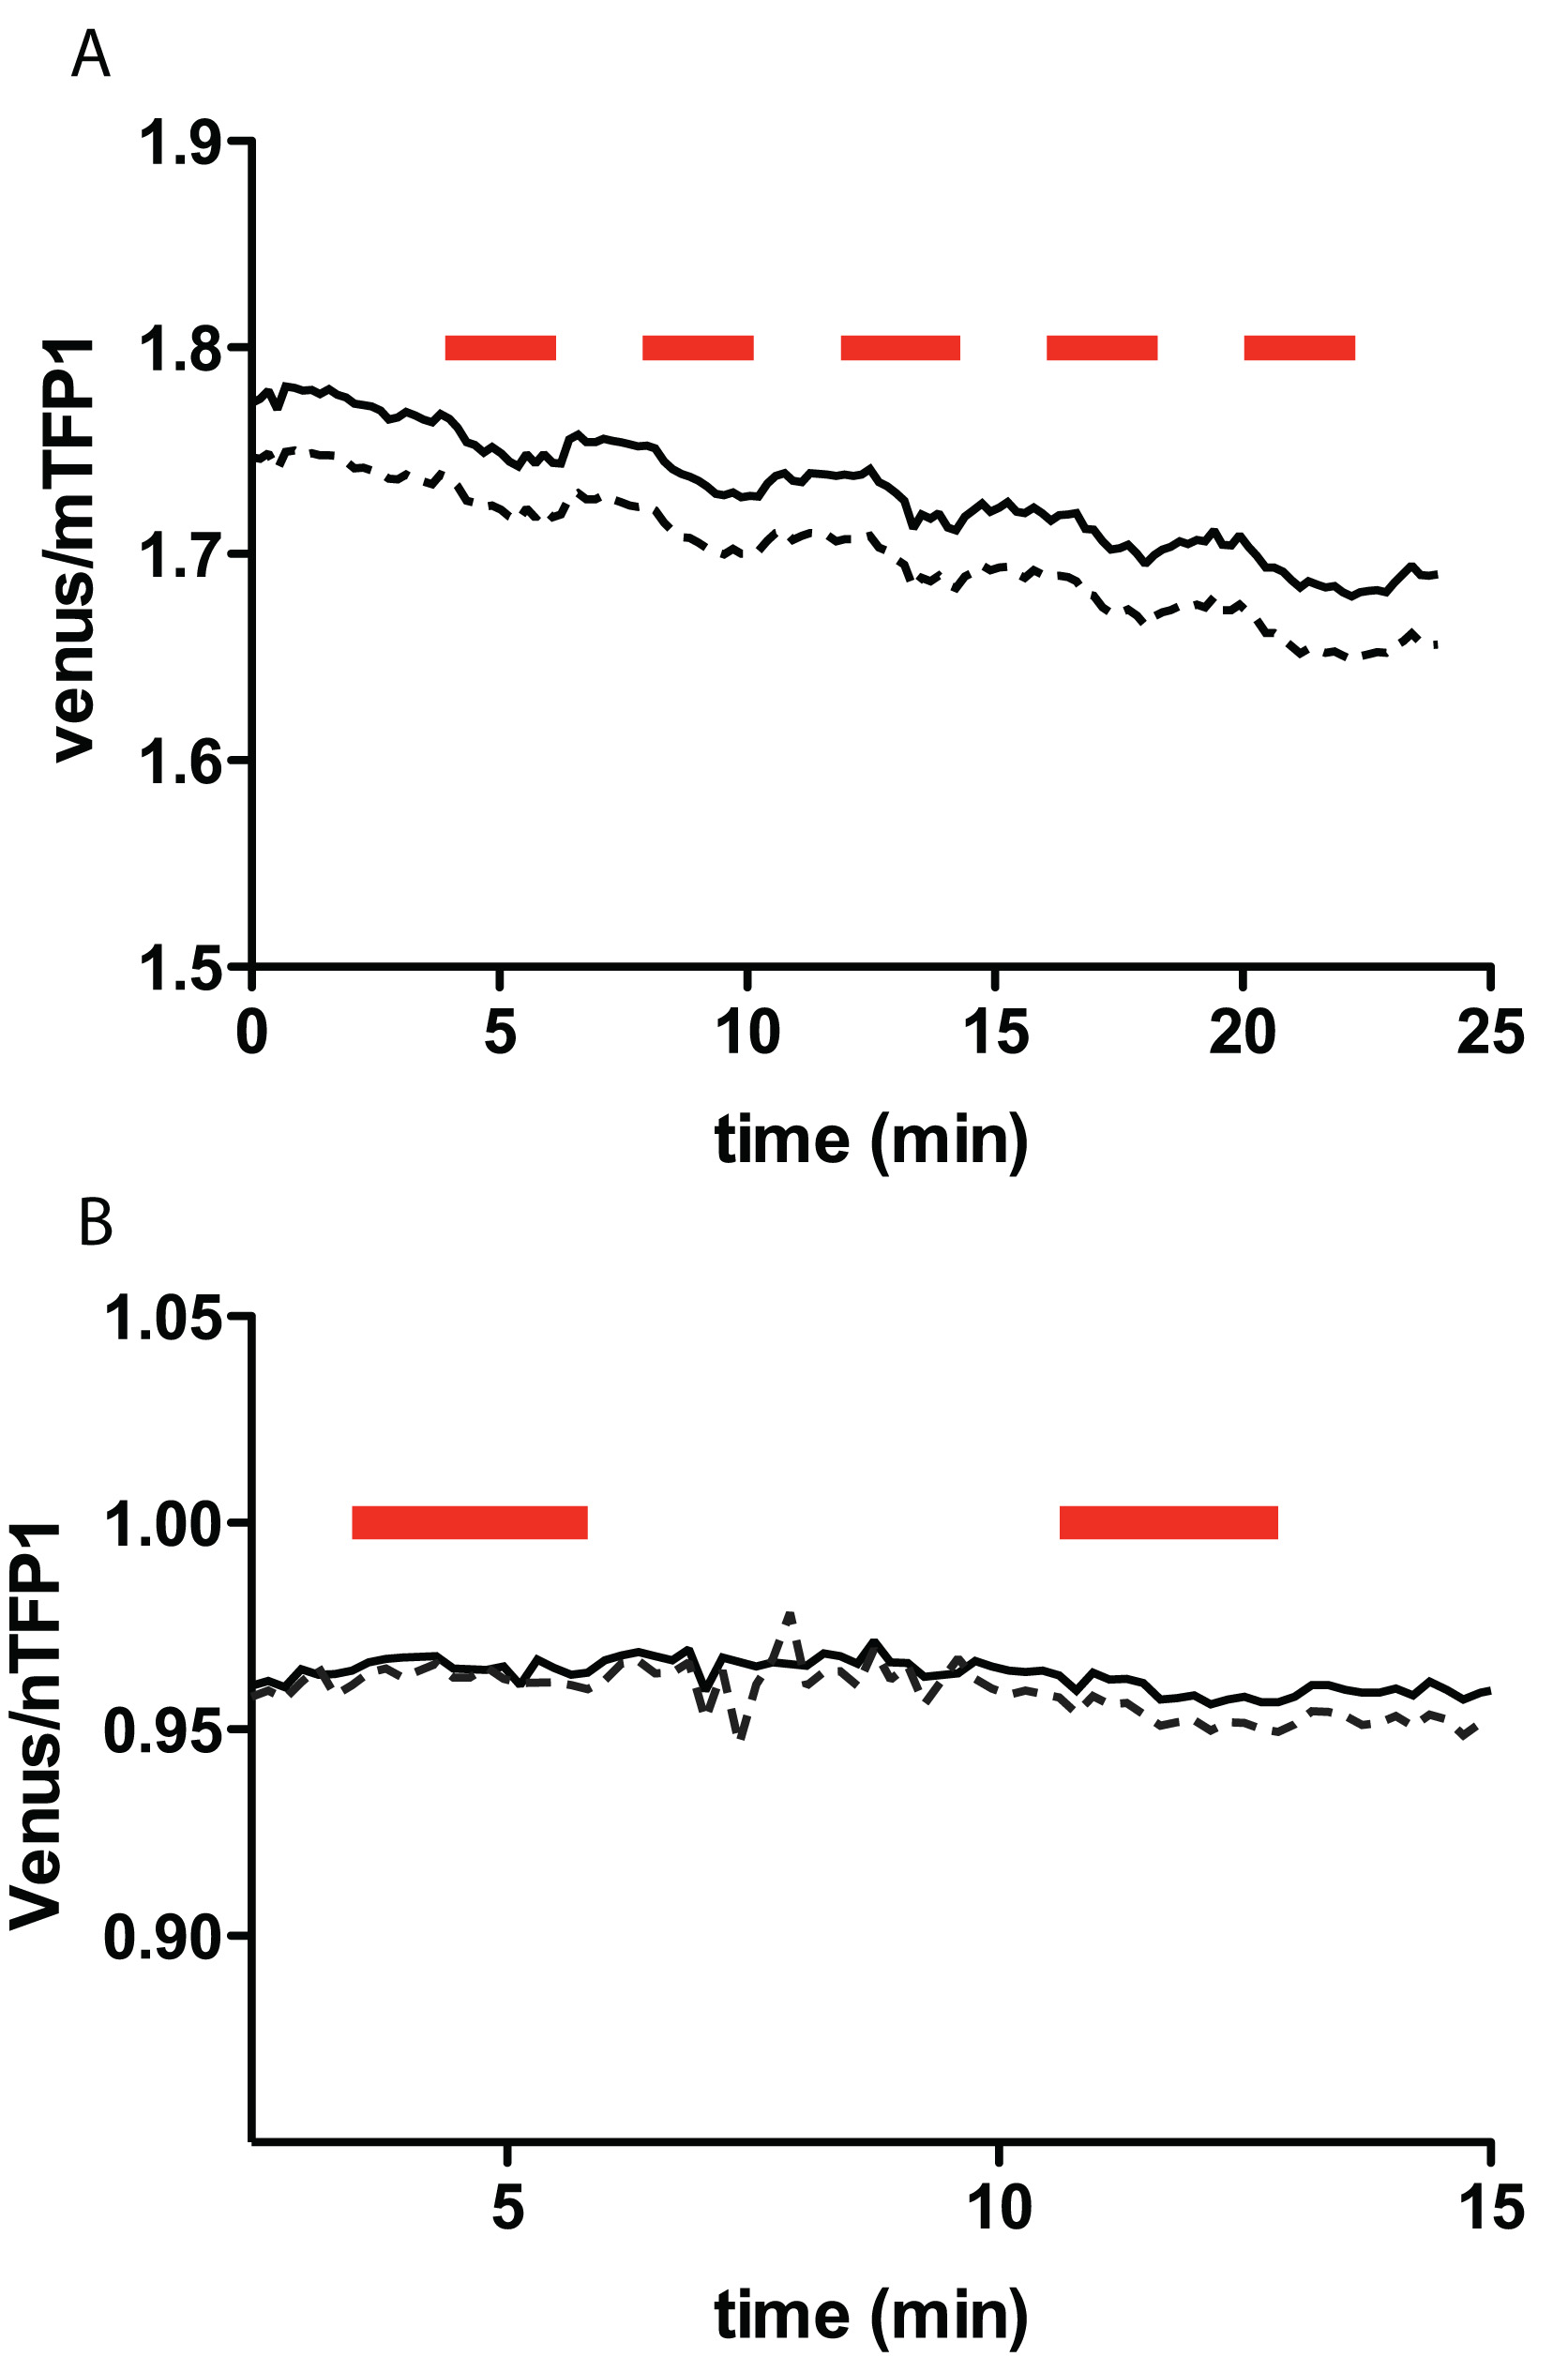
Figure 4. The venus/mTFP1 ratio of cos7 cells expressing FLIPQ-TV3.0_8m sensor (A) and 100μ sensor (B). The cells were perfused with HEPES-buffered Hank’s buffer. Timepoints when extracellular glutamine (5 mM) was added to the perfusion media are indicated as red boxes above the graph. Solid and dashed lines represent two individual cells measured in the same experiment.
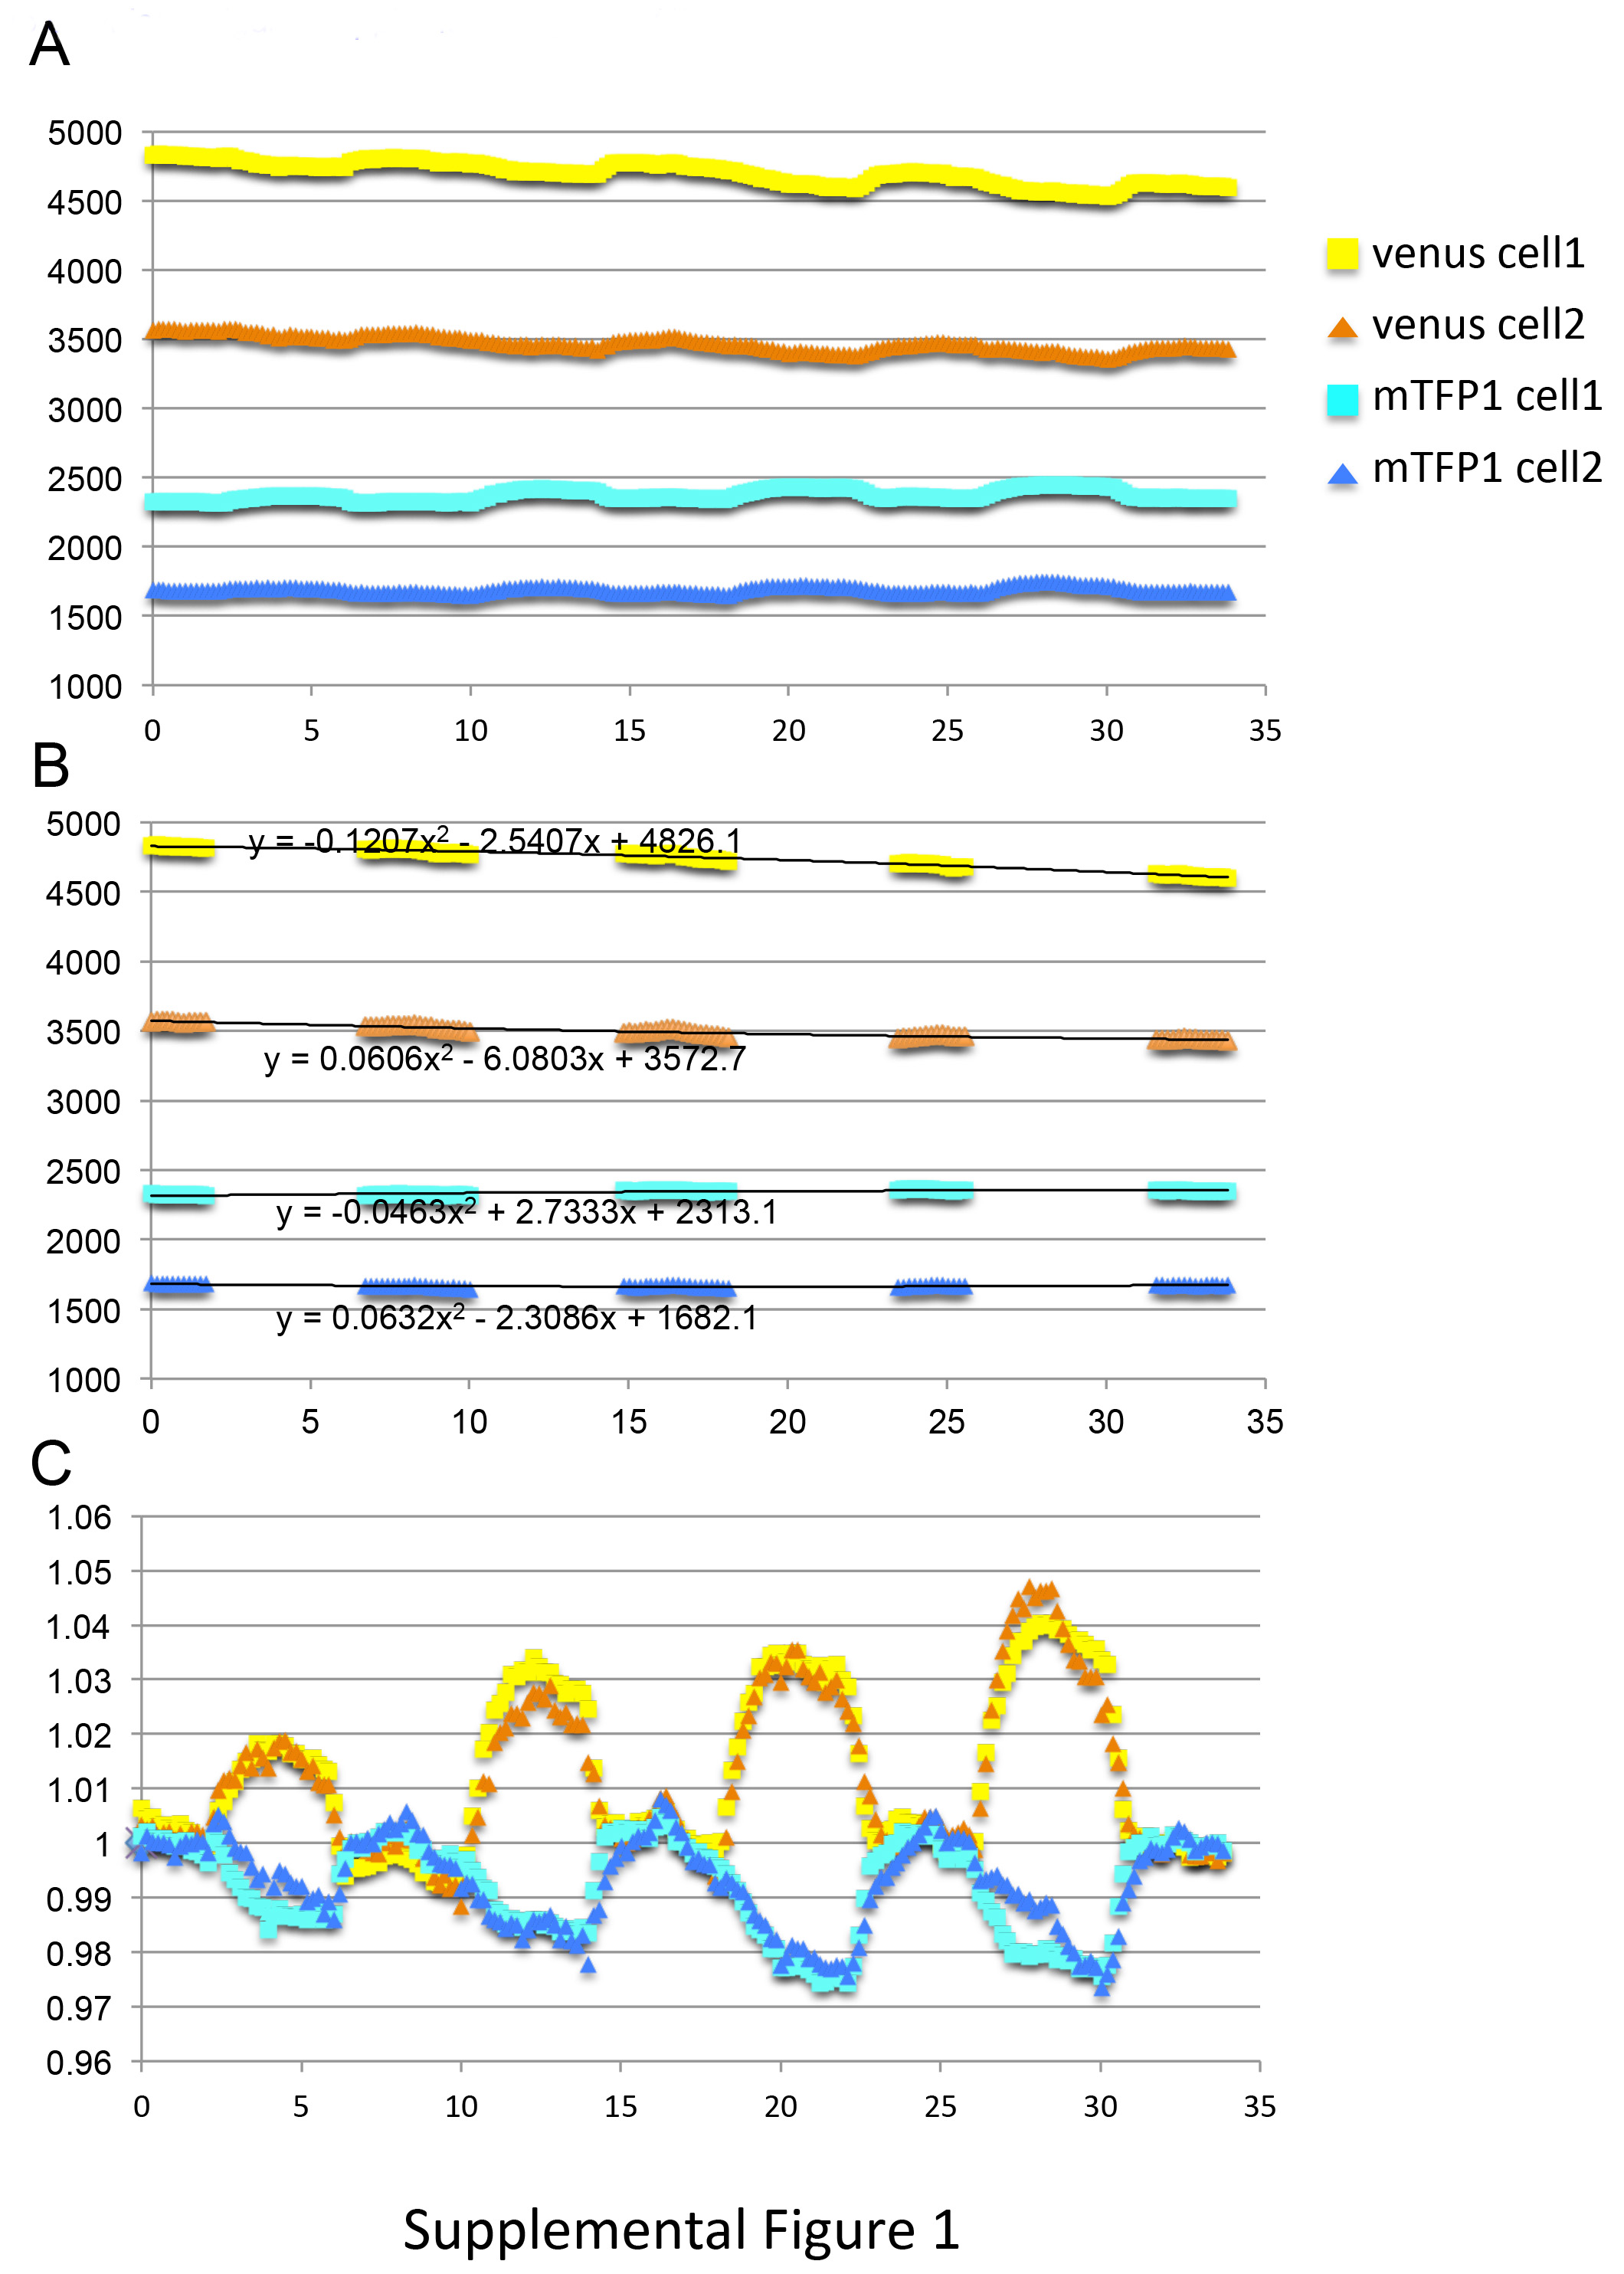
Figure 5. Correcting for photobleaching. (A) Raw intensities from two cells represented in Figure 2A and 2C. (B) Datapoints that were selected for calculating the baselines. Polynominal fitting curves are shown in the figure. (C) Intensities of channels shown in A, normalized against the baseline calculated in B. The dataset used in this figure is identical to the one shown in Figure 2A and 2C.
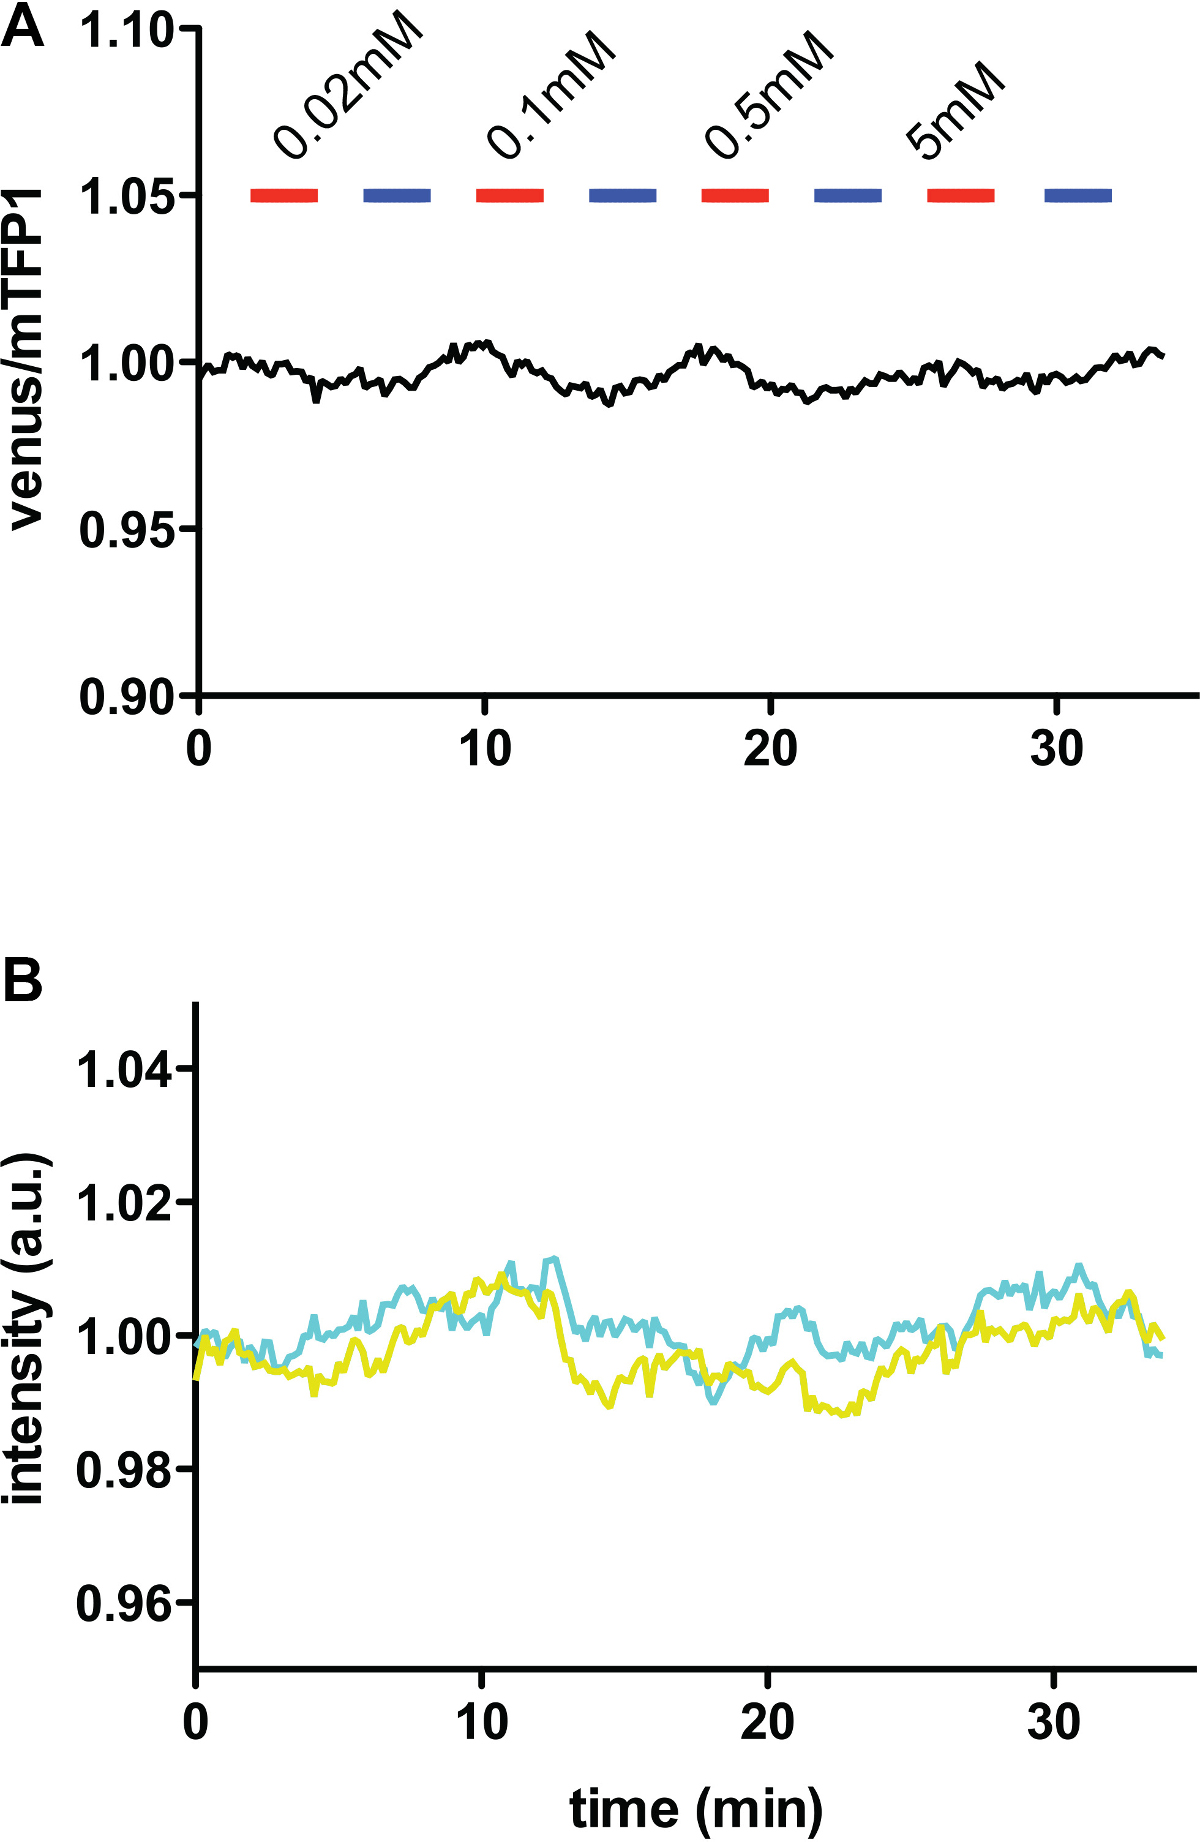
Figure 6. In vivo glutamine measurements using FLIPQ-TV3.0_1.5m sensor. (A) The venus/mTFP1 ratio of cos7 cells co-expressing FLIPQ-TV3.0_1.5m sensor and ASCT2-mCherry. mCherry tag was used to identify the cells expressing the transporter without interfering the mTFP1 or venus emission channels. The cells were perfused with HEPES-buffered Hank’s buffer (pH 7.35). Timepoints when extracellular glutamine (red) and alanine (blue) was added to the perfusion media are indicated as boxes above the graph. Solid and dashed lines represent two individual cells measured in the same experiment. (B) The intensities of donor (mTFP1) and acceptor (venus) channels in the experiment shown in (A). The values were corrected for photobleaching and normalized to the baseline.
Time (min) | Solution A | Solution B | Solution C | Solution D | Solution E | Solution F |
0 | valve on | |||||
2 | valve off | valve on | ||||
4 | valve on | valve off | ||||
6 | valve off | valve on | ||||
8 | valve on | valve off | ||||
10 | valve off | valve on | ||||
12 | valve on | valve off | ||||
14 | valve off | valve on | ||||
16 | valve on | valve off | ||||
18 | valve off | valve on | ||||
20 | valve on | valve off | ||||
22 | valve off | valve on | ||||
24 | valve on | valve off | ||||
26 | valve off | valve on | ||||
28 | valve on | valve off | ||||
30 | valve off | valve on | ||||
32 | valve on | valve off | ||||
34 | valve off |
Table 1. Example of the perfusion protocol used in this experiment. Solution A: 9.7 g HANK salt (H1387), 0.35 g NaHCO3, 5.96 g HEPES to 1 L pH adjusted to 7.35 with NaOH. Solution B: Solution A + 0.04 mM Gln. Solution C: Solution A + 0.2 mM Gln. Solution D: Solution A + 1 mM Gln. Solution E: Solution A + 5 mM Gln. Solution F: Solution A + 5 mM Ala.
The success of imaging experiments depends upon a few critical factors. One of these factors is the affinity of sensors used, as discussed above. Absolute concentration of the substrate in the subcellular compartment of interest, however, is often unknown. Therefore we recommend trying multiple sensors with staggered affinities to find the one that works best under the desired experimental condition. For example, in our case we transfected the cos7 cells with glutamine sensors with 1.5μ, 100μ, 2m, and 8m (Figure 3 and data not shown).
Another important factor is the expression level of sensor proteins. The level of expression required for the detection varies between, experiments, For example, when a short-lived event (e.g., single action potential) needs to be observed a higher expression level could become necessary 19. Therefore, in most cases, the level required needs to be empirically determined. If the target exists in very low concentration in the cell, perturbation of the endogenous processes due to target depletion can become an issue 20. An independent assay to assess such possibility, if available, is therefore desirable. In the experiments shown in this article, protein expression driven by CMV promoter was found to be sufficient. In situations where promoters with much weaker activities need to be used, adjustments to increase the signal intensities might become necessary. For example, compromise between the signal intensity and photo-bleaching during the exposure need to be reached. In addition to longer exposure time, factors as such as the brightness of the fluorophores, maximal intensity change of the sensor, binning, and the sensitivities of CCD camera can be changed to enhance the signal intensity.
When no ratio change is observed under the experimental condition even though the above two criteria are likely to be met, it is possible that the cellular homeostasis for the given metabolite or ion is strong enough to mask the transport activity (see the result section). In such cases, cell lines with different biochemical activities might be required as a background to detect the transporter activities 10,21.
While these sensors allow one to monitor concentration dynamics of the substrate at much higher spatiotemporal resolution than extraction-based methods, determination of absolute concentration requires further experimental steps and considerations. Usually, substrate concentration is calculated on the assumption that the sensor’s affinity, usually calculated by titrating purified sensor protein, is unchanged when expressed in the cell. The concentration is calculated using the following single binding isotherm,
[S] = Kd x (r – r min) / (r max – r)
[S] is the substrate concentration, Kd is the dissociation constant determined in vitro, r is the acceptor/donor ratio observed at a given timepoint, r min is the acceptor/donor ratio when sensors are in the apo form, and r max is the acceptor/donor ratio when all sensors are bound to the substrate. R min and r max are influenced by parameters such as the concentration of sensors, imaging settings used and the composition of the cellular milleu, and hence need to be measured in situ. To determine r min and r max values, experimental conditions that allows modification of intracellular substrate concentration becomes necessary. For example, selective ionophores (e.g., ionomycin for Ca2+) 22 or a perforating reagent such as digitonin 23 can be used to equilibrate intracellular substrate concentration with the external concentration.
One of the limitations in the type of experiments demonstrated in this protocol is the low throughput; the analysis is limited at analyzing one metabolite in a relatively small (<10) number of cells. Technological advances are being made, however, to overcome such limitations. For example, with the advance in automated, high-content screening, it is now possible to use genetically encoded sensors in combinations with small molecule or RNAi library; cells expressing a biosensor can be grown in a high-throughput format (e.g., 96- or 384-well), then individual wells can be treated with either siRNA or chemicals and imaged. Such experiments allow identification of siRNA constructs or chemicals that disrupt the biological process that can be observed by the biosensor 24 25. Another exciting recent advance includes the development of a time-resolved microfluidic flow cytometer, which allows high-throughput detection of FRET efficiency change at a cellular level 26. Such technical advances will aid discoveries of new drug candidates and new components in biological processes.
The authors have nothing to disclose.
This work was supported by NIH grant 1R21NS064412, NSF grant 1052048 and Jeffress Memorial Trust grant J-908.
Inverted fluorescent microscope | Olympus | IX81F-3-5 | An equivalent inverted fluorescent microscope from other suppliers would also appropriate. |
Exitation filter (mTFP1) | Omega Optical | 3RD450-460 | band width 450-460 nm |
Exitation filter (Venus) | Chroma | ET500/20 | band width 490-510 nm |
Emission filter (mTFP1) | Chroma | HQ495/30m | band width 475-505nm |
Emission filter (Venus) | Chroma | ET535/30m | band width 520-550nm |
Dichroic mirror (FRET channels) | Chroma | 470dcxr | long pass, 470nm cut off |
Dichroic mirror (YFP channel) | Chroma | 89002bs | passes 445-490nm, 510-560nm, 590-680nm |
mCherry filter set | Chroma | 49008 | excitation 540-580nm, long pass dichroic with 585nm cut off, emission filter 595-695nm |
Light source | Olympus | U-LH100L-3-5 | LED- or halogen light source that produces stable light intensity, mercury lamps are not recommended |
CCD camera | Qimaging | Rolera-MGi EMCCD | |
apochromatic fluorescence objective | Olympus | ||
perfusion system, ValveBank II | AutoMate Scientific | [01-08] | Other perfusion systems that allow fast solution exchange would also work |
Laminar-flow chambers | C&L Instruments | VC-MPC-TW | Other larminar-flow chambers would also work |
Chambered slide | Lab-Tek | 154534 | For open-chamber experiments |
perfusion pump | Thermo Scientific | 74-046-12131 | For open-chamber experiments |
Software supporting ratiometric measurements | Intellegenent Imaging Innovation | Slidebook 5.5 | |
Laminar flow biosafety cabinet | ESCO | LA-3A2 | |
Isotemp CO2 Incubator | Thermo Scientific | 13-255-25 | |
Dulbecco's MEM (DMEM) | Hyclone | SH30243.01 | |
Cosmic Calf Serum | Hyclone | SH3008703 | |
penicillin/streptomycin | Hyclone | SV30010 | |
Serum-free medium for transfection (OPTI-MEM I) | Invitrogen | 31985 | Used with Lipofectamine 2000 |
Poly-L-Lysine solution | sigma | P4707 | |
25mm circular glass cover slips | Thermo Scientific | 12-545-102 | in case VC-MPC-TW is used |
Lipofectamine 2000 | Invitrogen | 11668027 | Other transfection reagents can also be used |
Solution A (Hank's buffer) | – | – | 9.7g HANK salt (Sigma H1387), 0.35g NaHCO3, 5.96g HEPES to 1L, pH adjusted to 7.35 with NaOH |
Solution B | Solution A + 0.04mM Gln | ||
Solution C | Solution A + 0.2mM Gln | ||
Solution D | Solution A + 1mM Gln | ||
Solution E | Solution A + 5mM Gln | ||
Solution F | Solution A + 5mM Ala |