An Immunofluorescent Method for Characterization of Barrett’s Esophagus Cells
Summary
There is a discernible need for improved information on molecular drivers of Barrett’s Esophagus. Immunofluorescent staining is a useful technique for understanding the effects of cell signaling on cell morphology. We present a simple, effective protocol for the use of immunofluorescent staining to assess therapeutic treatment in Barrett’s Esophagus cells.
Abstract
Esophageal adenocarcinoma (EAC) has an overall survival rate of less than 17% and incidence of EAC has risen dramatically over the past two decades. One of the primary risk factors of EAC is Barrett’s esophagus (BE), a metaplastic change of the normal squamous esophagus in response to chronic heartburn. Despite the well-established connection between EAC and BE, interrogation of the molecular events, particularly altered signaling pathways involving progression of BE to EAC, are poorly understood. Much of this is due to the lack of suitable in vitro models available to study these diseases. Recently, immortalized BE cell lines have become commercially available allowing for in vitro studies of BE. Here, we present a method for immunofluorescent staining of immortalized BE cell lines, allowing in vitro characterization of cell signaling and structure after exposure to therapeutic compounds. Application of these techniques will help develop insight into the mechanisms involved in BE to EAC progression and provide potential avenues for treatment and prevention of EAC.
Introduction
Barrett’s esophagus (BE) is a metaplastic change in the normal squamous epithelium of the esophagus and a consequence of chronic exposure to the gastric contents resulting from gastroesophageal reflux disease (GERD)1. BE is thought to be a protective mechanism in response to GERD, however the presence of BE imparts an increased risk of esophageal adenocarcinoma (EAC), a disease which carries a significantly poor survival1. Current estimates suggest that up to 5.6% of the American population have BE, however as BE is often asymptomatic, it is thought that the majority of BE remains undiagnosed2. As incidence rates of both GERD and EAC have seen continued growth3, it has become important to understand the molecular mechanisms involved in progression of BE to EAC, particularly as this information could potentially provide therapeutic approaches towards preventing progression of BE to EAC.
Patient directed studies have resulted in the current paradigm of BE-EAC pathogenesis1. Chronic inflammation, injury, and genotoxic damage resulting from prolonged exposure to gastric contents exert selective pressure on the BE lesion promoting neoplastic progression to EAC. A number of genetic alterations have been identified during BE to EAC progression. However, despite this there is a distinct lack of understanding about the exact changes in cell signaling and subsequent effects upon cell structure and function.
Immortalized in vitro cell lines are useful tools for studying the effects of cell signaling, particularly in investigating the effects of targeted therapeutic compounds. The recent commercial availability of immortalized BE cell lines allows for such studies. Although high-throughput assays, such as the widely used viability assays, can be valuable in assessing the effects of targeted therapies upon cell proliferation and survival4-6, these assays are not useful for interrogating the effects of cell signaling upon cell morphology. Immunofluorescent staining (IF) is a useful technique for investigating the effects of targeted therapies upon the morphological, growth, and survival characteristics of cells and the proteins that are involved. Our laboratory has adapted these methods towards immortalized BE cell lines, using IF to evaluate the effects of a clinically available drug upon BE cell lines in hopes of delineating a possible chemopreventative treatment and biomarker for drug treatment7. Similarly, application of these techniques in EAC, BE and immortalized esophageal cell lines has delineated critical findings regarding BE to EAC progression8-10. We find IF analysis of BE cells treated with targeted therapies has value, allowing for characterization of changes in cell structure and protein localization. Here, we present our methods for IF of immortalized BE cells to characterize drug treatment.
Protocol
1. Cell Line Maintenance
- Immortalized Human BE high-grade dysplastic (CP-B, CP-C, CP-D) and metaplastic (CP-A) cell lines by stable transfection of the human telomerase reverse transcriptase (TERT) protein11.
- Maintain BE cell lines in keratinocyte media supplemented with bovine pituitary extract (BPE), epidermal growth factor (EGF), 5% fetal bovine serum (FBS), nonessential amino acids (NEAA), penicillin-streptomycin-neomycin (PSN), and standard tissue culture conditions (37 °C, 5% CO2, 98% humidity).
2. BE Cell Plating
- Preparation of 12-well plate/coverslips. Place 18 mm coverslips into a glass Petri dish and autoclave. Transfer autoclaved 18 mm glass coverslips into a 12-well tissue culture dish using a sterile glass pipette attached to a vacuum tube. Wash the coverslip with sterile PBS and media.
- Trypsinize and count immortalized BE cells. Count cells using an automated cell counter or a hemocytometer. Dilute cells in culture media to a concentration of 20,000-40,000 cells/ml.
- Place 1 ml of cells into each well containing a coverslip for a total cell count of 20,000-40,000 cells/well.
- Use a sterile pipette tip to gently push the coverslip to the bottom of the well to ensure that cells attach to the coverslip.
3. Drug Treatment of BE Cells
- Dilute selected drug in warm (37 °C) media to desired concentration and mix well by inverting the tube repeatedly or using a vortex mixer. Determined drug concentrations empirically. Begin treatment 24 hr following the initial seeding of the BE cells to allow cells attachment on to the coverslip
- For comparison and control, treat an additional coverslip of BE cells with 0.1% vehicle (dimethyl sulfoxide [DMSO] or agent used to solubilize compound) diluted in culture media. Label plate with a lab pen to identify drug and vehicle treated samples. Place cells into a cell culture incubator set to 37 °C, 5% CO2, 98% humidity and incubate for desired time points.
4. Immunofluorescent Staining
- Fixation
- Following desired incubation time of drug treatment, aspirate the media and wash the coverslips quickly with 1x phosphate buffered saline (PBS) at room temperature (RT, 25 °C).
- Aspirate the PBS and add 1 ml of PBS containing 4% PFA [4% PFA/PBS] to each well and incubate at RT for 30 min.
- Aspirate the 4% PFA/PBS and wash the coverslips 3x, 5 min each with PBS at RT. Store coverslips for one week in PBS/0.1% PFA at 4 °C if desired.
- Permeabilization/Blocking
Permeabilize fixed PFA cells to allow the antibody to access the intracellular targets. For extracellular surfaced proteins, perform all subsequent steps without saponin added to the 1x PBS/0.5% BSA solution.- Reduce background by incubating with 50 mM NH4Cl diluted in PBS for 10 min at RT and wash with RT PBS once for 5 min.
- Incubate BE cells for 30 min in 100-300 μl of PBS containing 0.1% saponin and 0.5% bovine serum albumin (BSA). Dilute saponin from filter-sterilized 10% stock, prepared in water and stored at 4 °C.
- Preparation of Human Chamber
- Prepare a square bioassay dish by layering the bottom of the chamber with wet paper towels and place a layer of Parafilm on top.
- Gently transfer the coverslips, cells facing upward, onto the Parafilm using forceps and a syringe needle.
- Mark the Parafilm with a lab pen to identify coverslips.
- Primary Antibody Incubation
- Dilute the primary antibody in PBS containing both 0.5% BSA and 0.1% saponin.
- Gently blot off the blocking solution using a laboratory tissue and add 100 μl of the primary antibody solution. Incubate the primary antibody on the BE cells overnight at 4 °C.
- Secondary Antibody Incubation
- Wash the slides 3x with PBS/0.5% BSA/0.1% saponin for 5 min each at RT.
- Dilute secondary antibody conjugated with a fluorescent tag in PBS/0.5% BSA/0.1% saponin that the secondary antibody recognizes the species in which the primary antibody was raised.
- Add 100 μl of diluted antibody to each coverslip. Incubate the secondary antibody for 2 hr at RT.
- Washing and Mounting of Coverslips
- Wash the coverslips 3x, 5 min each in PBS/0.5% BSA/0.1% saponin. Remove the wash buffer and add 100-300 μl of PBS to the coverslips.
NOTE: For double antibody staining, repeat steps 4.4-4.5 with the desired additional primary and secondary antibody according to information outlined in the discussion. - Using forceps, gently lift up the coverslip and blot off the PBS using a laboratory tissue or paper towel.
- Add 15 μl of a suitable anti-fade mounting media containing 4',6-diamidino-2-phenylindole (DAPI) to the coverslip and invert the coverslip, cells down, onto a glass microscope slide.
- Place the slides into a slide folder and incubate away from direct light overnight at RT to allow the hard set anti-fade medium to cure, according to manufacturer’s instructions. Once the anti-fade medium has set, slides can be stored at either 4 °C or -20 °C until microscopic visualization.
- Wash the coverslips 3x, 5 min each in PBS/0.5% BSA/0.1% saponin. Remove the wash buffer and add 100-300 μl of PBS to the coverslips.
5. Microscopic Visualization of Coverslips
Stained cells can be imaged via either confocal microscopy or an IF capable upright microscope. Although confocal microscopy provides high-resolution images at discrete depths, an upright microscopic is capable of producing useful images faster. For brevity, a method of imaging stained BE cells using standard microscopy is presented. In general, to image fluorescein isothiocyanate (FITC) or similar fluorophores (i.e. green fluorescent protein), Texas Red and DAPI, requires a microscope with filters capable of discriminating these fluorophores. Check the microscope before beginning protocol to determine compatible fluorophores.
- Imaging on a Standard IF Microscope
- Remove stored slides/coverslips from -20 °C or 4 °C and allow them to warm to room temperature. Power on microscope and mercury arc lamp.
- Place microscope slide with coverslip facing towards objective onto microscope stage. For use of an oil immersion objective, add a drop of immersion oil onto coverslip.
- Select the DAPI filter and open the shutter.
- Focus the objective while looking through the eyepieces until the image appears. Since all cells will stain with DAPI, the nuclei should be easily observable.
- Collect images using respective image processing software.
Representative Results
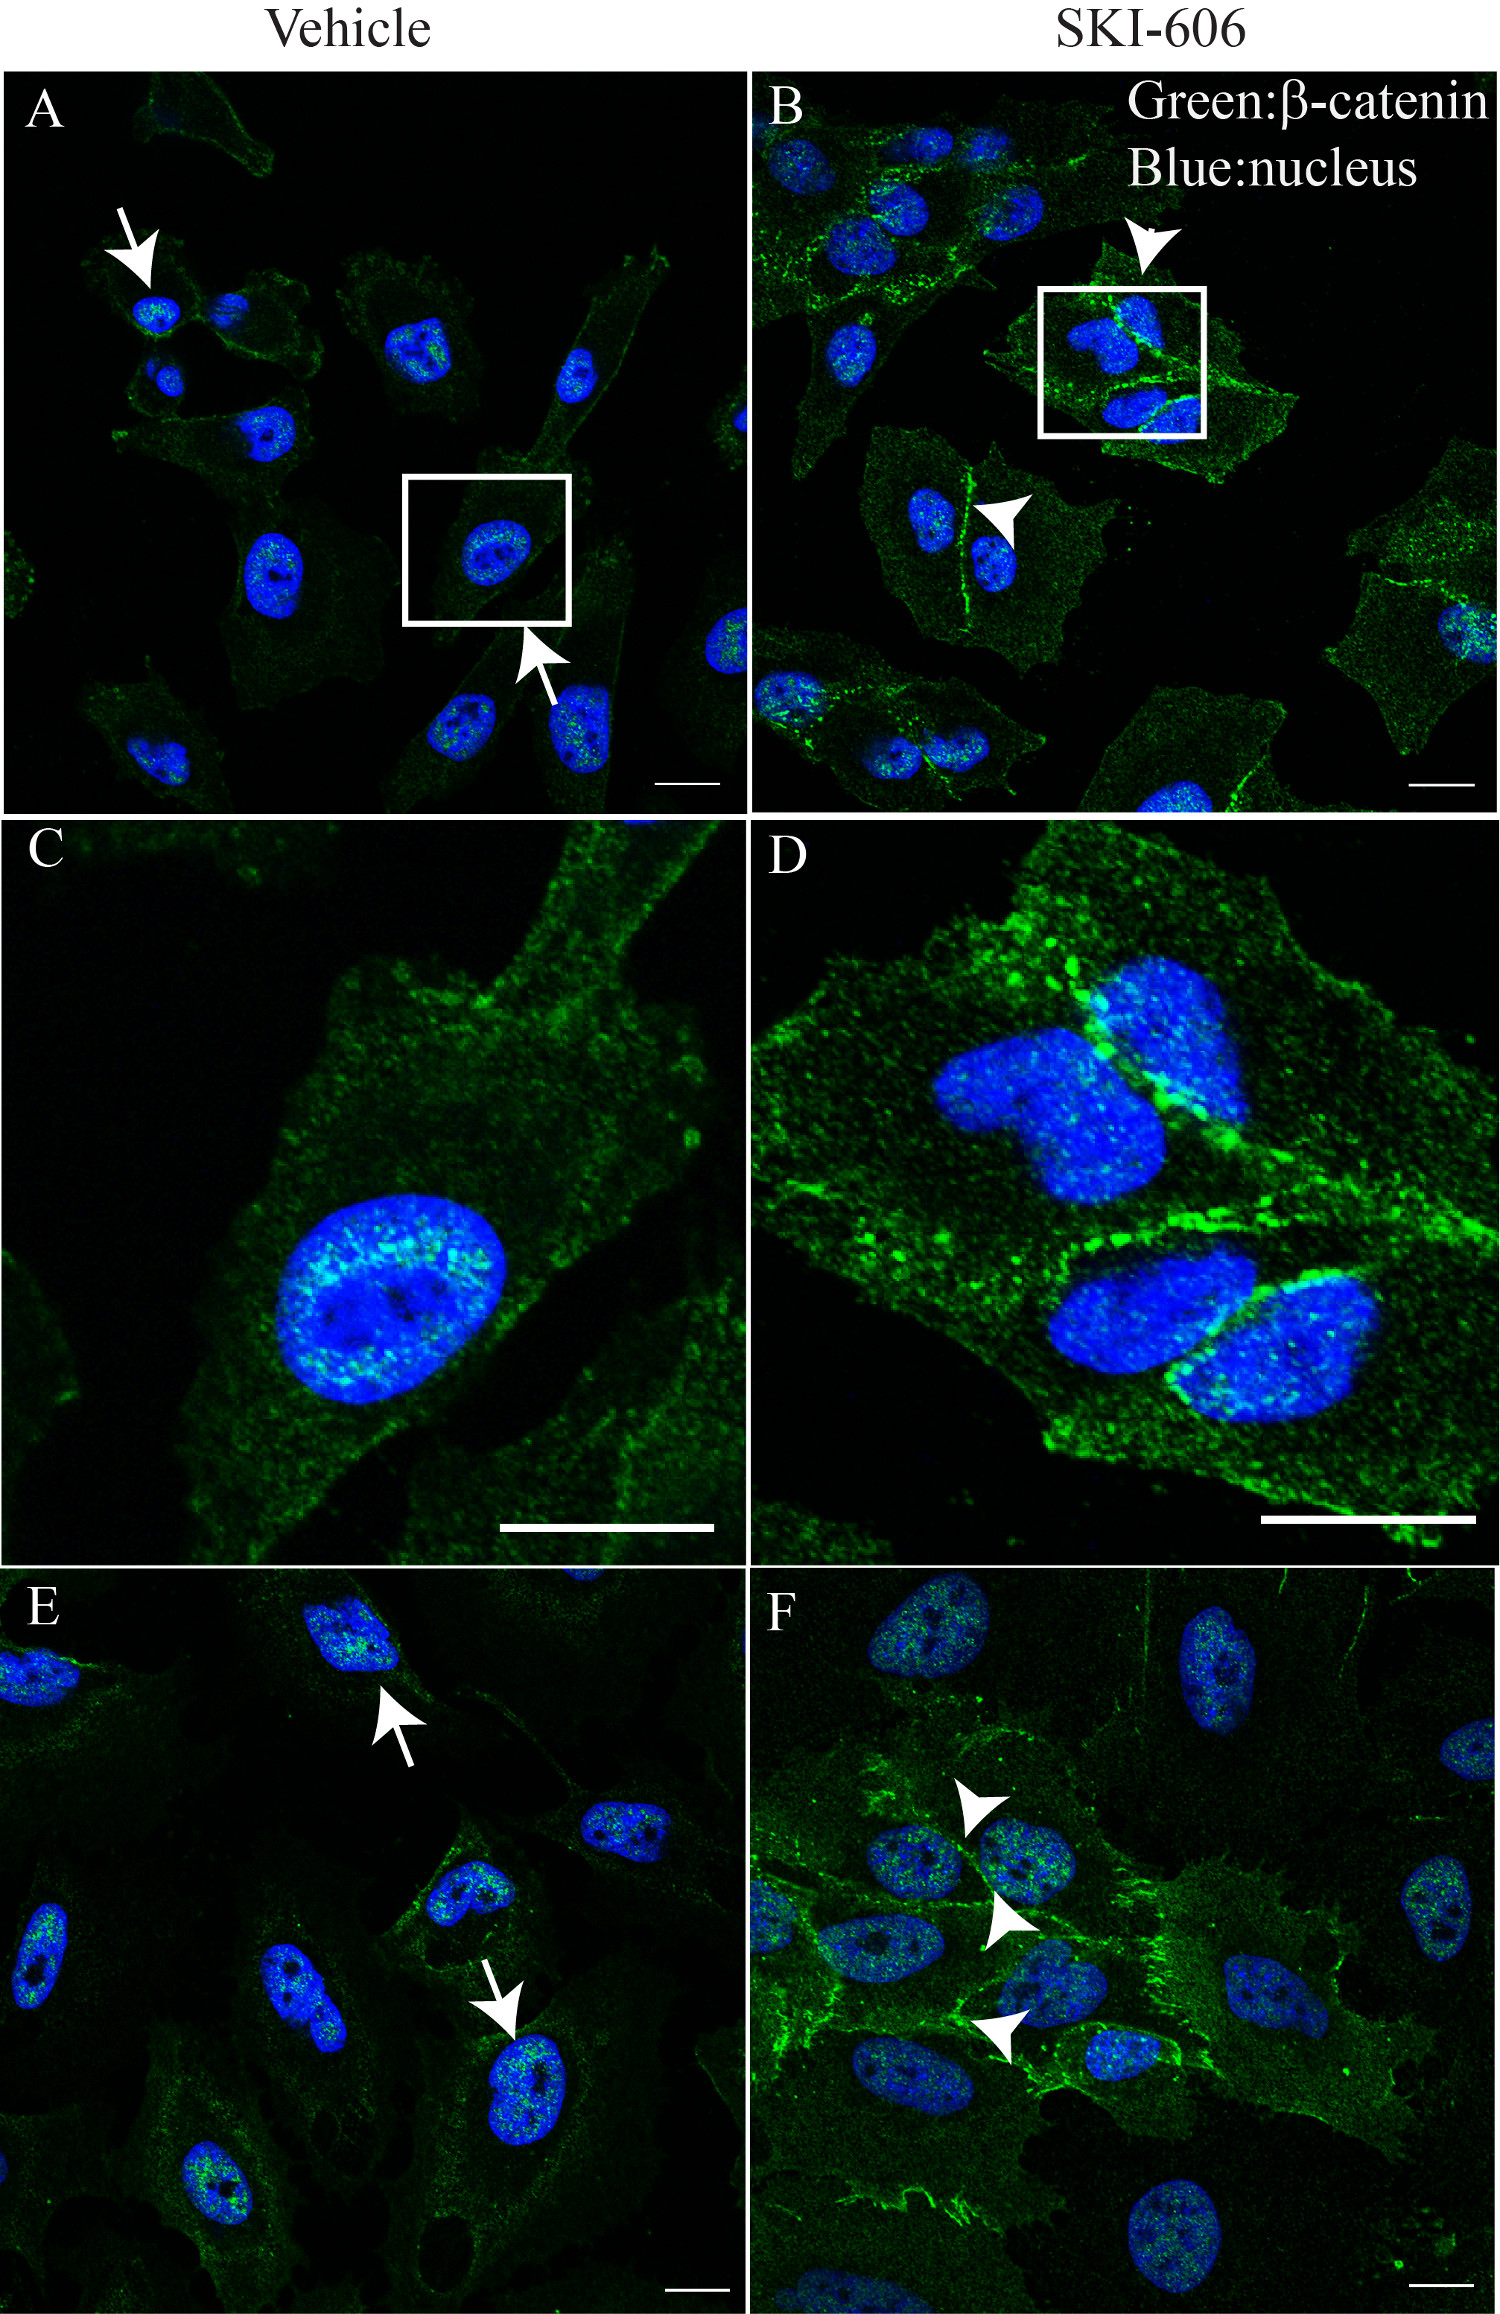
An example of the results obtained from application of the described procedures is illustrated in Figures 1A-D. Coverslips with CP-D and CP-C BE cells were treated for 24 hr with 1 μM of the Src family inhibitor, SKI-606, or vehicle (DMSO) and stained using the above procedures for the Adherens Junction and Wnt signaling protein, β-catenin. Visualization of β-catenin was achieved by labeling with an anti-rabbit IgG coupled to a green fluorophore, while labeling of the cell nucleus was accomplished by labeling with DAPI (blue). Coverslips were mounted to microscope slides using hard set mounting and cells were imaged using laser scanning confocal microscope using a 63X/1.4N plan-apochromat objective. The chosen green fluorophore was excited at 488 nm and visualized using an emission filter at 505-525 nm. Similarly, DAPI was excited at 405 nm and emission collected using a filter at 410-460 nm. Activity of the tyrosine kinase, Src is increased in BE, particularly in high grade dysplasia12. In concordance with observations in colorectal and prostate cancer cells13-15, inhibition of Src results in relocalization of β-catenin from the cytoplasm/nucleus (arrows, Figures 1A, 1C, and 1E) to the cell membrane (arrowheads, Figures 1B, 1D, and 1F). Using these techniques, we and others have previously shown that inhibition of Src also alters the expression and localization of the tumor suppressor, p27kip17,16 and these methods are currently used within our laboratory.
 μ
μ
Figure 1. IF of immortalized BE cells following treatment with an inhibitor of Src kinase. CP-C (A-D) and CP-D (E, F) were treated with vehicle (DMSO, left panels) or 1 μM of the Src inhibitor, SKI-606, for 24 hr (right panels). BE cells were fixed and stained according to the described protocol. β-catenin (green) was visualized using a specific antibody and a secondary antibody coupled to Alexa Fluro 488, while the nucleus was stained with DAPI (blue). Note the change in localization for β-catenin from the nucleus (arrows) to the cell membrane (arrowheads) following treatment with SKI-606. C,D) Magnified images of white boxes in A and B, further highlight the changes in β-catenin localization. These images represent ideal staining with minimal background and distinct staining for the chosen target. Bars, 7 μm (A, B, D, F), 0.5 μm (C, D).
Discussion
We have outlined a method for application of IF of BE cells towards elucidating the physiological effects of targeted therapies upon these cells. While we have described the use of these procedures towards BE cells, we have found that these methods are also applicable to a variety of different cell types13,17,18. Further, these procedures can be altered in several ways to optimize staining for specific targets.
We find one parameter that has a direct effect upon proper IF is the choice of fixation. We have described the use of 4% PFA/PBS for fixation in the above procedures but alternative fixatives are also applicable. Fixation with cold methanol (-20 °C) for 20 min after washing with PBS is suitable for certain proteins/antibodies13. Use of cold methanol for fixation negates the need to permeabilize cells. However, the choice of fixative (4% PFA/PBS or cold methanol) must be determined empirically.
The procedures outlined above describe visualization of a single protein; however this method is easily adaptable to identification of an additional target13. For optimal IF of two proteins, primary antibodies raised in two different species (e.g., one raised in rabbit and one in mouse), and secondary antibodies specifically recognizing each species, coupled to different fluorophores, are necessary. Secondary antibodies coupled to green and red fluorophores, combined with DAPI provide an excellent contrast between targets, in addition to generally avoiding interference from the multiple fluorophores. For IF of two targets in BE cells, perform sequential incubation of two primary and their respective secondary antibodies following fixation. Steps for washing and mounting of slides remain the same.
In summary, we provide a simple and useful protocol for IF of BE cells. Application of these procedures can yield information regarding the effects of drug treatment, introduction of ectopic genes of interest, or RNAi downregulation of genes of interest in BE cells.
Divulgazioni
The authors have nothing to disclose.
Acknowledgements
This work was supported by grants from the St, Joseph’s Foundation (AJF, LJI) and American Lung Association, RG-224607-N (LJI).
Materials
| Name of the Material/Equipment | Company | Catalog Number | Comments/ Description (optional) |
| CP-A (Metaplastic Cell Line) | ATCC | CRL-4027 | |
| CP-B (High-grade Dysplastic Cell Line) | ATCC | CRL-4028 | |
| CP-C (High-grade Dysplastic Cell Line) | ATCC | CRL-4029 | |
| CP-D (High-grade Dysplastic Cell Line) | ATCC | CRL-4030 | |
| Keratinocyte-SFM (1X), Liquid | Life Technologies | 17005-042 | |
| 0.25% Trypsin-EDTA (1X), Phenol Red | Life Technologies | 25200056 | |
| Fetal Bovine Serum, Qualified, HI | Life Technologies | 10438026 | |
| PSN ANTIBIOTIC MIXTURE | Life Technologies | 15640 | |
| PBS – Phosphate-Buffered Saline | Life Technologies | 10010049 | |
| Pro-long Gold Antifade Reagent with DAPI | Life Technologies | P36931 | |
| Circular Glass Coverslip 18mm | Fisher Scientific | 15-183-86 | |
| β-catenin Primary Antibody (Rabbit) | Cell Signaling | 9562S | |
| Alexafluor 488 (Goat Anti-Rabbit) | Life Technologies | A11008 | |
| 10cm TC treated PS dish, sterile | USA Scientific | CC7682-3394 | |
| 12-well TC treated PS plate, sterile | USA Scientific | 5666-5180 | |
| DMSO | Sigma-Aldrich | 276855 | |
| Paraformaldehyde | Sigma-Aldrich | P6148 | |
| Ammonium chloride | Sigma-Aldrich | A9434 | |
| Saponin | Sigma-Aldrich | 47036 | |
| Bovine Serum Albumin – Fraction V | Sigma-Aldrich | 85040C | |
| SKI-606 (Bosutinib) | Selleck Chemicals | S1014 | |
| Square Bioassay Dish | Thermo Scientific | 240835 | |
| Parafilm | VWR | 82024-546 | |
| Disposable Pasteur Pipets, Flint Glass | VWR | 14672-380 | |
| Nexcelom Mini Cell Counter | Nexcelom | ||
| Cellometer Counting Chambers | Nexcelom | CHT4-SD100-014 | |
| Zeiss Apotome microscope | Zeiss |
Riferimenti
- Reid, B. J., Li, X., Galipeau, P. C., Vaughan, T. L. Barrett’s oesophagus and oesophageal adenocarcinoma: time for a new synthesis. Nat. Rev. Cancer. 10, 87-101 (2010).
- Hayeck, T. J., Kong, C. Y., Spechler, S. J., Gazelle, G. S., Hur, C. The prevalence of Barrett’s esophagus in the US: estimates from a simulation model confirmed by SEER data. Dis. Esophagus. 23, 451-457 (2010).
- Brown, L. M., Devesa, S. S., Chow, W. H. Incidence of adenocarcinoma of the esophagus among white Americans by sex, stage, and age. J. Natl. Cancer Inst. 100, 1184-1187 (2008).
- Konturek, P. C., Burnat, G., Hahn, E. G. Inhibition of Barret’s adenocarcinoma cell growth by simvastatin: involvement of COX-2 and apoptosis-related proteins. J. Physiol. Pharmacol. 58 Suppl 3, 141-148 (2007).
- Peng, D., et al. Glutathione peroxidase 7 protects against oxidative DNA damage in oesophageal cells. Gut. 61, 1250-1260 (2012).
- Vona-Davis, L., et al. MAPK and PI3K inhibition reduces proliferation of Barrett’s adenocarcinoma in vitro. Surg. Res. 127, 53-58 (2005).
- Inge, L. J., et al. a small molecule inhibitor of the Src kinase, reduces the growth and activates apoptosis in pre-neoplastic Barrett’s esophagus cell lines: evidence for a noninvasive treatment of high-grade dysplasia. Thoracic Cardiovasc. Surg. 145, 531-538 (2013).
- Jovov, B., et al. Ion transport and barrier function in a telomerase-immortalized human nondysplastic, Barrett’s cell line (BAR-T). Dis. Esophagus. 22, 386-395 (2009).
- Merlo, L. M., Kosoff, R. E., Gardiner, K. L., Maley, C. C. An in vitro co-culture model of esophageal cells identifies ascorbic acid as a modulator of cell competition. BMC Cancer. 11, 461 (2011).
- Zhang, H. Y., Hormi-Carver, K., Zhang, X., Spechler, S. J., Souza, R. F. In benign Barrett’s epithelial cells, acid exposure generates reactive oxygen species that cause DNA double-strand breaks. Cancer Res. 69, 9083-9089 (2009).
- Palanca-Wessels, M. C. A., et al. Extended lifespan of Barrett’s esophagus epithelium transduced with the human telomerase catalytic subunit: a useful in vitro model. Carcinogenesis. 24, 1183-1190 (2003).
- Kumble, S., Omary, M. B., Cartwright, C. A., Triadafilopoulos, G. Src activation in malignant and premalignant epithelia of Barrett’s esophagus. Gastroenterology. 112, 348-356 (1997).
- Inge, L. J., et al. alpha-Catenin overrides Src-dependent activation of beta-catenin oncogenic signaling. Mol. Cancer Ther. 7, 1386-1397 (2008).
- Coluccia, A. M. L., et al. SKI-606 Decreases Growth and Motility of Colorectal Cancer Cells by Preventing pp60(c-Src)-Dependent Tyrosine Phosphorylation of β-Catenin and Its Nuclear Signaling. Cancer Res. 66, 2279-2286 (2006).
- Nam, J. -. S., Ino, Y., Sakamoto, M., Hirohashi, S. Src Family Kinase Inhibitor PP2 Restores the E-Cadherin/Catenin Cell Adhesion System in Human Cancer Cells and Reduces Cancer Metastasis. Clin. Cancer Res. 8, 2430-2436 (2002).
- Chu, I., et al. p27 phosphorylation by Src regulates inhibition of cyclin E-Cdk2. Cell. 128, 281-294 (2007).
- Inge, L. J., et al. Soluble E-cadherin promotes cell survival by activating epidermal growth factor receptor. Exp. Res. 317, 838-848 (2011).
- Gan, Y., et al. Differential roles of ERK and Akt pathways in regulation of EGFR-mediated signaling and motility in prostate cancer cells. Oncogene. 29, 4947-4958 (2010).
