Analyzing Mixing Inhomogeneity in a Microfluidic Device by Microscale Schlieren Technique
Summary
Herein, we describe a procedure that employs microscale schlieren technique to measure mixing inhomogeneity in a microfluidic device. Through calibration, distribution of concentration gradient can be derived from the micro-schlieren image.
Abstract
In this paper, we introduce the use of microscale schlieren technique to measure mixing inhomogeneity in a microfluidic device. The microscale schlieren system is constructed from a Hoffman modulation contrast microscope, which provides easy access to the rear focal plane of the objective lens, by removing the slit plate and replacing the modulator with a knife-edge. The working principle of microscale schlieren technique relies on detecting light deflection caused by variation of refractive index1-3. The deflected light either escapes or is obstructed by the knife-edge to produce a bright or a dark band, respectively. If the refractive index of the mixture varies linearly with its composition, the local change in light intensity in the image plane is proportional to the concentration gradient normal to the optical axis. The micro-schlieren image gives a two-dimensional projection of the disturbed light produced by three-dimensional inhomogeneity.
To accomplish quantitative analysis, we describe a calibration procedure that mixes two fluids in a T-microchannel. We carry out a numerical simulation to obtain the concentration gradient in the T-microchannel that correlates closely with the corresponding micro-schlieren image. By comparison, a relationship between the grayscale readouts of the micro-schlieren image and the concentration gradients presented in a microfluidic device is established. Using this relationship, we are able to analyze the mixing inhomogeneity from associate micro-schlieren image and demonstrate the capability of microscale schlieren technique with measurements in a microfluidic oscillator4. For optically transparent fluids, microscale schlieren technique is an attractive diagnostic tool to provide instantaneous full-field information that retains the three-dimensional features of the mixing process.
Introduction
Fluid mixing is an important issue that is found in many industrial processes and biological systems. With the emergence of microfluidics, mixing in microscale has brought much attention due to its challenge in diffusion domination among the mass transport mechanisms. Since designing an effective micromixer required quantitative validation, several measuring methods were developed5-7. Nevertheless, the three-dimensional structure, commonly found in efficient micromixers5, demands a more accurate representation of the concentration field that the common measuring techniques fail to deliver. Due to the limit of viewing angle8 or reaction kinetics6, the aforementioned methods may produce misleading results that do not correctly account for the homogeneity of the mixture.
For optically transparent fluids mixing in optically transparent microstructures, microscale schlieren technique3,9-14 provides an attractive alternative to analyze mixing inhomogeneity. In the past, microscale schlieren technique has been mostly used to visualize compressible flow9-13,15 or phase gradient16. Microscale schlieren technique benefits from both a simple optical layout and high sensitivity and enables not only the non-invasive investigation of specific flow feature that causes optical disturbance but is well suited for use in assessing mixing. In this paper, we construct the microscale schlieren system by inserting a knife-edge in the back focal plane of the objective of a microscope, describe a calibration procedure to realize quantitative analysis, and report a validation measurement in a microfluidic oscillator4. To implement measurements, the working fluids are properly selected so that the refractive index of the mixed fluids varies linearly with the composition, and the thickness of the target microfluidic device is identical to the one used in calibration. Besides species concentration, microscale schlieren technique can be extended to measure the gradient of other scalar quantity that is linearly correlated to the index of refraction, such as temperature or salinity.
Protocol
1. Fabrication of Microfluidic Device
- Use a graphic layout software (e.g., AutoCAD) to draw the outline of a T-microchannel. For the T-microchannel, the two feed channels are 90 µm wide and 2,500 µm long, and the confluence channel is 180 µm wide and 3,000 µm long. Connect the end of each channel to an individual circle with a diameter of 1,100 µm.
- Mark ‘clear’ and ‘dark’ for the exposure and covered areas, respectively. For a negative photoresist (e.g., SU-8), the shape of the T-microchannel is ‘clear’ and the surrounding is ‘dark.’
- Use a laser pattern generator with a wavelength of 442 nm and a minimum feature size of 2 μm to transfer the pattern of the T-microchannel onto a chrome-on-glass photomask.
- Use the photomask, a substrate (e.g., single-side polished silicon wafer) and a permanent epoxy photoresist (e.g., SU-8) to make a mold through a standard lithography process. The photoresist layer is 55.2 μm thick. In general, the photoresist thickness should be thinner than the depth of correlation of the objective lens17-19.
- Use the mold and a transparent material such as polydimethylsiloxane (PDMS) to fabricate the T-microchannel20.
- For fluidic connection, use a stainless steel tube of 2 mm in outer diameter to punch through-holes aligned to the circular patterns on the PDMS.
- Treat the surfaces of the PDMS and a glass slide with oxygen plasma at 60 W for 30 sec. Attach the PDMS to the glass slide. The oxidized surfaces of the two materials create a strong bond. Place the bonded PDMS structure on a hot plate for 5 min at 120 °C.
- Insert Teflon tubes into the punched holes for fluidic connection.
2. Experimental Setup
- Construct the microscale schlieren system from a Hoffman modulation contrast microscope by removing the slit plate in the front focal plane of the condenser and replacing the modulator with a knife-edge in the rear focal plane of the 5X objective3. The depth of correlation, which depends on the numerical aperture of the objective17-19, should be sufficient to cover the entire depth of the microfluidic device. The surface of the knife-edge is blackened by anodic aluminum oxide to reduce its reflectivity.
- Mount the high-speed camera to the trinocular tube of the microscope via a C-mount adapter. Have the camera face the optical path of the microscope through a beam splitter. Connect the camera to a desktop computer via an Ethernet cable. Set the gamma correction to 1 for the camera so that its grayscale readout is proportional to the input luminance.
- Turn on the light source. In order to avoid excess heat, use LED (light emitting diode) lighting.
- Use an image processing software (e.g., function imread in MATLAB) to obtain the grayscale values of an acquired image. Remove the knife-edge, adjust the illumination, the aperture and the exposure time so that the average grayscale readout of the image is about 10% less than the maximal value. This denotes the background intensity for a 0% cutoff and we use a value of 230 for an 8-bit image.
- Insert the knife-edge to block the incident light completely. Record the average grayscale readout of the image. This denotes the background intensity for a 100% cutoff and the value is about 15 for an 8-bit image.
- Adjust the position of the knife-edge such that the average grayscale readout of the acquired image lies in the middle of the values for 0% and 100% cutoff. Now the degree of the cutoff is set to 50%.
- Prepare two transparent fluids with known refractive indices21 that are completely miscible with each other as the constituents. To evaluate the dependence of refractive index on concentration of the mixture, check the literature21 or use the Gladstone-Dale equation22. If the curve is nonlinear over the entire range, pick other fluid components. Then, choose a designated composition below which the refractive index of the solution varies linearly with the concentration. For example, use dilute aqueous ethanol with a mass fraction of 0.05 and water as the working fluids.
- Put the T-microchannel on the specimen stage. Arrange the T-microchannel so with the confluent channel parallel to the knife-edge (Figure 1).
- Prepare two identical syringes: syringe A is filled with the working fluid that serves as the reference fluid (water), and syringe B is filled with the other working fluid (dilute aqueous ethanol). The size of the syringe depends on the desired flow rate Q and the specification of the syringe pump: Q = πd2V/4, where d is the inner diameter of the syringe and V is the speed of the plunger. Flow pulsation usually can be prevented by choosing a small syringe to increase V23.
- Collect the outlet fluid from the T-microchannel in a beaker. Ensure the Teflon outlet tube is fixed to the beaker's wall and its end is below the liquid level in the beaker in order to avoid vibration that would be caused by droplet breakoff.
3. Calibration
- Acquire the images of the two fluids mixing and the reference images.
- At a given Reynolds number Re, set the flow rate of the syringe pumps, Q. Q is calculated from Q = µ(W+D)Re/4ρ, where µ and ρ are the viscosity and density of the working fluid, and W and D are the width and depth of the confluence channel of the T-microchannel, respectively.
- Load one pump with syringe A and the other pump with syringe B. Connect the two inlets of the T-microchannel to syringe A and syringe B via Teflon tubing. Start the syringe pumps to deliver the working fluids into the T-microchannel at identical volume flow rates.
- Wait until steady flow establishes. The steady flow condition is defined by the emergence of a stationary schlieren pattern.
- Use the camera controlled software to record twenty frames of fluidic mixing at a frame rate of 30 fps.
- Stop the pump which is loaded with syringe B. Only pump the reference fluid (water) through one inlet into the confluence channel of the T-microchannel at constant rate.
- Wait until steady flow condition is reached and no schlieren pattern is observed.
- Use the camera controlled software to take the reference image, when no optical inhomogeneity is present in the T-microchannel. Record twenty frames at a frame rate of 30 fps.
- Repeat 3.1.1 to 3.1.7 at different Reynolds number: Re = 1, 5, 10, 20 and 50 so that no complex flow structure emerges in the confluence region of the T-microchannel24.
- Use an image processing software to divide the acquired image I(i, j) by the reference image I0(i, j)25, where i and j are the pixel indices.
- Employ a CFD (Computational Fluid Dynamics) package to simulate mixing of the designated fluids in the T-microchannel.
- Construct the three-dimensional model for the geometry of the T-microchannel. Discretize the flow domain into structured grids. To increase the accuracy, employ finer mesh in the confluence and the central region of the T-microchannel.
- Assign the physical properties of fluids and establish the boundary conditions to the flow domain. During the solving process, determine the concentration-dependent diffusion coefficient from the concentration obtained in the last iteration26 in order to update the local concentration.
- Examine the sensitivities of the computed results by performing the grid study27.
- For each node (xi, yi) on the xy-plane, employ the CFD post-processing tool to take the average values of the concentration field across the channel depth by the trapezoidal rule: w(xi, yj) = {∑k [w(xi, yj, zk) + w(xi, yj, zk+1)]∙(zk+1 – zk)/2}/D28, where D is the channel depth. Use the central differencing scheme to compute the derivative of concentration with respect to the cross-stream direction: (∂w/∂y)i, j = [w(xi, yj+1) – w(xi, yj-1)]/(yj+1 – yj-1).
- For both positive and negative gradients, extract the ratio of grayscale values I/I0 (obtained in 3.2) and the gradient of mass fraction ∂w/∂y (obtained in 3.4) at specified locations such as y = 0 (centerline, streamwise direction) or various given x (cross-stream direction).
- Plot the results and determine the relationship between I/I0 and ∂w/∂y, I/I0 = C1∂w/∂y + C2 (C1 and C2 are constants), with linear regression.
4. Quantitation
- Repeat steps 3.1 to 3.2 for mixing in the target microfluidic device. The depth of the target microfluidic device should be identical or close to that of the T-microchannel. If unsteady phenomenon is expected, acquire a video clip (sequence of images) in step 3.1.4 instead. The frame rate should be high enough to resolve the dynamics of the transient flow clearly, while the exposure time should be identical to the value used in 2.4, 2.5, 3.1.4 and 3.1.7.
- Use the relationship obtained in step 3.6 to convert the ratio of grayscale values to the gradient of mass fraction in the target microfluidic device.
Representative Results
The grayscale ratio I/I0 under different Reynolds number for both positive and negative gradients of mass fraction is shown (Figure 2) with a symmetrical band appearing in the middle of the T-microchannel. At low Reynolds number, the tail of the schlieren band is expanded and blurred due to the dispersion across the mixing interface. As the Reynolds number increases, the diffusion length shortens leading to a narrower band. At different downstream locations, the variations of the intensity change ΔI/I0 along the cross-stream direction are depicted quantitatively (Figure 3). The results from the calibration process are represented (Figure 4A and 4B). The relationship between I/I0 and ∂w/∂y is linear and independent of the Reynolds number. From the regression analysis, I/I0 = -110∂w/∂y + 1.03 for ∂w/∂y > 0 and I/I0 = -160∂w/∂y + 0.83 for ∂w/∂y < 0, ∂w/∂y is in µm-1. The relative uncertainties are ±3.8% and ±3.2% in Figure 4A and 4B, respectively. The detection limit is reached where the data points level out. It is noted that the deviation in slopes of the positive and negative gradients is not uncommon3. Using these equations, the variation of mass fraction gradient with time in a microfluidic oscillator4 is seen (Figure 5). The mixing interface is deflected in the cavity region and flow instability commences. This video figure clearly reveals the oscillating nature of the flow in the microfluidic oscillator and demonstrates the capability of the microscale schlieren technique to capture the time-resolved full-field concentration gradient in a microfluidic device.
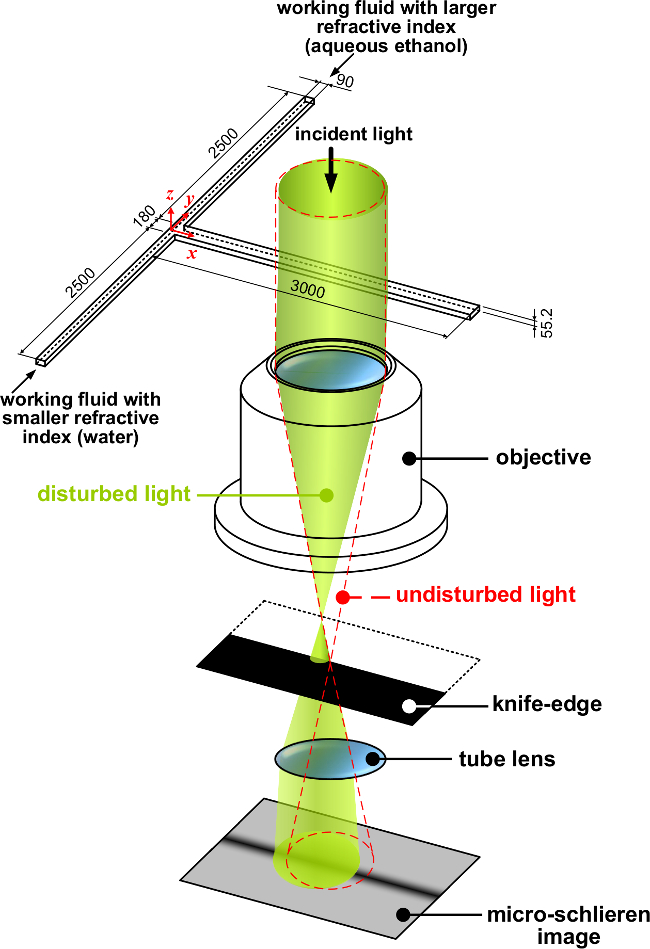
Figure 1. Schematic of the optical setup. The orientation of the knife-edge produces a dark band with a positive gradient of refractive index. The light deflects toward the direction of increasing refractive index. Because the objective lens inverts the image, blocking the –y region shields the distorted light and produces a dark band.
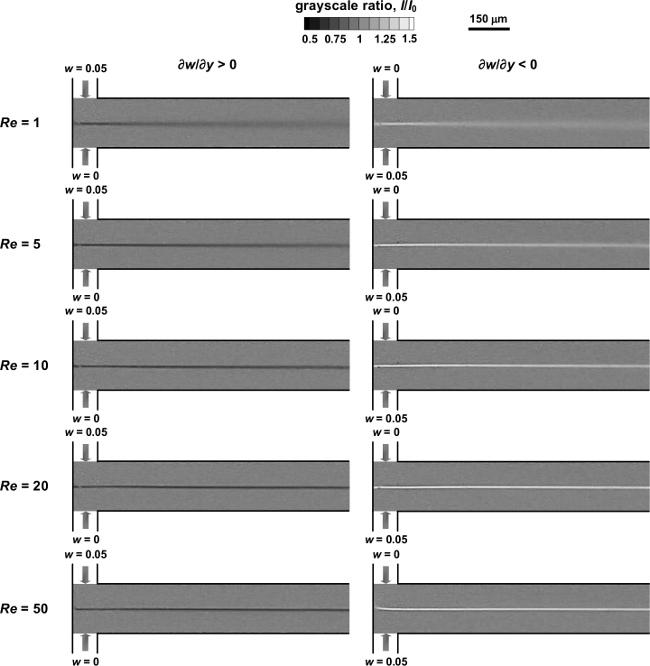
Figure 2. Ratio of grayscale readouts for mixing in the T-microchannel under different flow configuration. Positive and negative gradients result in dark and bright bands, respectively. As the Reynolds number increases, the band becomes more concentrated.
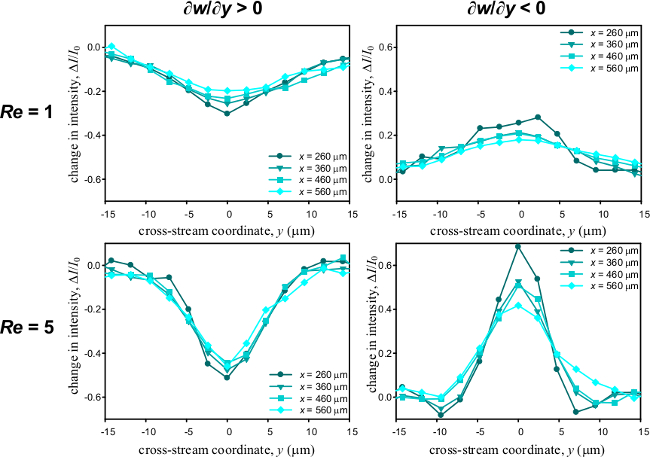
Figure 3. The variation of the intensity change along the cross-stream direction for both positive and negative gradients. Re = 1 and Re = 5.
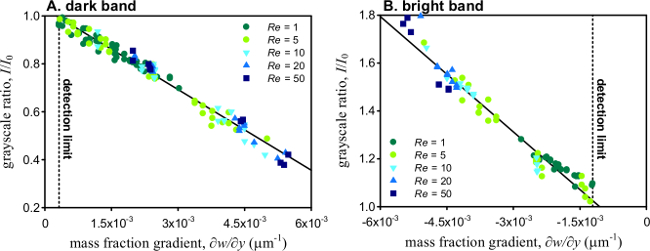
Figure 4. Relationship between the gradient of mass fraction and the grayscale ratio. For both positive and negative gradients, grayscale ratio varies linearly with the mass fraction gradient.
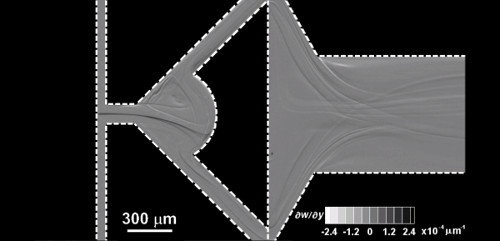
Figure 5 (Video Figure). Evolution of mass fraction gradient in a microfluidic oscillator at Re = 250. The mixing characteristic through flow oscillation is successfully captured by microscale schlieren technique.
Discussion
For fluidic mixing in a microfluidic device, the microscale schlieren technique is able to measure the magnitude of concentration gradient through quantifying change in light intensity. Because the principle of this technique relies on detecting the alternation of light propagation, the working fluids and the microfluidic device have to be transparent to the incident light. In addition, the protocol requires a linear relationship between the refractive index of the solution and its composition so that preliminary assessment of the working fluids is essential. Besides aqueous ethanol solution demonstrated herein, microscale schlieren technique is successfully applied to measure salinity gradient29 and solutocapillary convection30. For accurate measurements, aperture range, illumination level, exposure time, objective lens and microchannel depth used in the calibration procedure have to be identical to those used in the quantitation procedure. Moreover, the depth of correlation of the objective lens has to be sufficiently large to cover the entire depth of the microfluidic device.
The calibration process of mixing in the T-microchannel is the most critical step in the accurate quantitation of microscale schlieren technique. For successful implementation of the proposed method, users need to align the tube connection properly, exploit a small syringe or pneumatics for fluid delivery to avoid flow oscillation23, use a LED light source to reduce excess heat, conduct the calibration procedure at low Reynolds numbers24, and place the microfluidic device in focus to eliminate higher-order optical effects31. The lowest measurable gradient (bright pattern, ∂w/∂y < 0) is linked to the dynamic range of the camera, whereas the highest measurable gradient (dark pattern, ∂w/∂y > 0) is reached when the knife-edge completely blocks the deflected light. To detect a wide range of concentration gradient, a high ISO value is advantageous as long as underexposure or overexposure does not occur. The detection limit, below which the micro schlieren system is unable to discern, depends on the minimal intensity change that the camera is able to resolve. The minimal intensity change is constrained by the degree of noise and the levels of tonal gradation. Hence, a high-sensitivity camera with great pixel depth is desired for low-signal application.
The significance of microscale schlieren technique is two folds; on one hand, it enables unsteady full-field measurements in real time with a simple optical configuration. On the other hand, it is non-invasive so that no alien substance is introduced to disturb the flow field. Because micro-schlieren technique produces two-dimensional projection of the three-dimensional inhomogeneity in a microfluidic device, complex mixing phenomenon that remains veiled by existing methods can be clearly seen. Future applications of this technique include quantifying concentration gradients during an electrochemical process or determining nutrient gradient to study microbial chemotaxis in a micro flow environment.
Divulgazioni
The authors have nothing to disclose.
Acknowledgements
This work was supported by the Ministry of Science and Technology of Taiwan under Grant Number 101-2221-E-002-064-MY3.
Materials
| Permanent Epoxy Negative Photoresist | MicroChem | SU-8 2150 | |
| single side polished silicon wafer | Light Technology | S4W1PP5SABUP1 | p-type, diameter: 100±0.5 mm, thickness: 525 ±25 mm, orientation: (1 0 0) |
| syringe pump | kdScientific | kds210 | |
| syringe, i.e. 10 ml | Terumo | SS-10L2138 | |
| Hoffman modulation contrast microscope | Leica Microsystems | DM IL LED | |
| 5X objective lens | Leica Microsystems | N PLAN | NA = 0.12 |
| knife-edge | custom made part | ||
| camera, i.e. high speed | Integrated Design Tools | NX7-S1 | |
| C-mount adapter HC 0.63x | Leica Microsystems | 541537 | |
| camera operating software | Integrated Design Tools | MotionPro X Studio 2.02.01 | |
| polydimethylsiloxane (PDMS) | Dow Corning | Sylgard-184 silicone elastomer kit | |
| Teflon tubing, i.e. O.D. x I.D. 1/16 in. x 0.031 in. | Supelco | 58700-U | |
| micro glass slide | Matsunami Glass | S2215 | |
| hot plate | Yeong-Shin | HP-303DN | |
| distilled water, i.e. HPLC grade | Alps Chemicals | ||
| ethyl alcohol, i.e. reagent grade | Nihon Shiyaku Reagent | EA448652 | |
| image processing software | Mathworks | MATLAB R2009a | |
| computational fluid dynamics package | ESI group | CFD-ACE+ 2008 |
Riferimenti
- Merzkirch, W. . Flow Visualization. , (1974).
- Settles, G. S. . Schlieren and Shadowgraph Techniques. , (2001).
- Sun, C. -. l., Hsiao, T. -. h. Quantitative analysis of microfluidic mixing using microscale schlieren technique. Microfluidics and Nanofluidics. 15 (2), 253-265 (2013).
- Sun, C. -. l., Sun, C. -. Y. Effective mixing in a microfluidic oscillator using an impinging jet on a concave surface. Microsystem Technologies. , (2011).
- Strook, A. D. Chaotic mixer for microchannels. Science. 295 (5555), 647-651 (2002).
- Wheat, P. M., Posner, J. D. Quantifying mixing using equilibrium reactions. Physics of Fluids. 21 (3), 037101 (2009).
- Liu, R. H. Passive mixing in a three-dimensional serpentine microchannel. Journal of Microelectromechanical Systems. 9 (2), 190-197 (2000).
- Munson, M. S., Yager, P. Simple quantitative optical method for monitoring the extent of mixing applied to a novel microfluidic mixer. Analytica Chimica Acta. 507 (1), 63-71 (2004).
- Bradfield, W. S., Sheppard, J. J. Microschlieren-a technique for the study of details in compressible flow. Aero/Space Engineering. 5 (18), 37-56 (1959).
- Scroggs, S. D., Settles, G. S. An experimental study of supersonic microjets. Experiments in Fluids. 21, 401-409 (1996).
- Phalnikar, K. A., Alvi, F. S., Shih, C. . 31st AIAA Fluid Dynamics Conference & Exhibit. , (2001).
- Phalnikar, K. A., Kumar, R., Alvi, F. S. Experiments on free and impinging supersonic microjets. Experiments in Fluids. 44 (5), 819-830 (2008).
- Naughton, J. W., Bishop, D. S., Walrath, D. E., Lindberg, W. R. Micro-schlieren characterization of a high momentum micro-fluidic actuator. , (2002).
- Chen, H. -. M., Wu, H. -. W., Lee, J. -. N., Ting, C. -. C. . 23th National Conference of the Chinese Society of Mechanical Engineers. , (2006).
- Davidson, G. P., Emmony, D. C. A schlieren probe method for the measurement of the refractive index profile of a shock wave in a fluid. Journal of Physics E: Scientific Instruments. 13, 92-97 (1980).
- Xie, H. Schlieren confocal microscopy for phase-relief imaging. Optics Letters. 39, 1238-1241 (2014).
- Inoué, S., Spring, K. R. . Video Microscopy: The Fundamentals. , (1997).
- Meinhart, C. D., Wereley, S. T., Gray, M. H. B. Volume illumination for two-dimensional particle image velocimetry. Measurement Science and Technology. 11 (6), 809-814 (2000).
- Olsen, M. G., Adrian, R. J. Out-of-focus effects on particle image visibility and correlation in microscopic particle image velocimetry. Experiments in Fluids. 29 (1), S166-S174 (2000).
- Friend, J., Yeo, L. Fabrication of microfluidic devices using polydimethylsiloxane. Biomicrofluidics. 4 (2), 026502 (2010).
- Wohlfarth, C., Lechner, M. D. Landolt-Börnstein: Numerical Data and Functional Relationships in Science and Technology. Optical Constants: Refractive Indices of Pure Liquids and Binary Liquid Mixtures (Supplement to III/38). 47, (2008).
- Heller, W. Remarks on refractive index mixture roles. Journal of Physical Chemistry. 69 (4), 1123-1129 (1965).
- Korczyk, P. M., Cybulski, O., Makulska, S., Garstecki, P. Effects of unsteadiness of the rates of flow on the dynamics of formation of droplets in microfluidic systems. Lab on a Chip. 11 (1), 173-175 (2011).
- Dreher, S., Engler, M., Kockmann, N., Woias, P., Bockhorn, H., Mewes, D., Peukert, W., Warnecke, H. .. -. J. Theoretical and experimental investigations of convective micromixers and microreactors for chemical reactions. Micro and Macro Mixing: Analysis, Simulation and Numerical Calculation. , (2010).
- Huang, C. Y., Gregory, J. W., Sullivan, J. P. A Modified schlieren technique for micro flow visualization. Measurement Science & Technology. 18 (5), N32-N34 (2007).
- Tyn, M. T., Calus, W. F. Temperature and concentration dependence of mutual diffusion coefficients of some binary liquid systems. Journal of Chemicaland Engineering Data. 20 (3), 310-316 (1975).
- Celik, I. B. Procedure for estimation and reporting of uncertainty due to discretization in CFD applications. Journal of Fluids Engineering. 130 (7), 078001 (2008).
- Tasić, A. &. #. 3. 8. 1. ;., Djordjević, B. D., Grozdanić, D. K., Radojković, N. Use of mixing rules in predicting refractive indices and specific refractivities for some binary liquid mixtures. Journal of Chemical and Engineering Data. 37 (3), 310-313 (1992).
- Hsiao, P. -. J., Chen, S. -. T., Hsiao, T. -. H., Sun, C. -. l. A comparison of coarse-resolution numerical simulation with experimental measurements of wind turbine aerodynamic performance. , (2013).
- Sun, C. -. l., Huang, C. -. Y. Microscale schlieren visualization of near-bubble mass transport during boiling of 2-propanol/water mixtures in a square capillary. Experiments in Fluids. 55 (7), 1778 (2014).
- Panigrahi, P. K., Muralidhar, K. . Schlieren and Shadowgraph Methods in Heat and Mass Transfer. , (2012).
