Integration of data from genome-wide sequencing experiments and metabolomics experiments is a challenge. In this paper we report, for the first time, generation, analysis and integration of transcriptome, cistrome and metabolome data from breast cancer cells treated with estradiol.
With the advent of the -omics approaches our understanding of the chronic diseases like cancer and metabolic syndrome has improved. However, effective mining of the information in the large-scale datasets that are obtained from gene expression microarrays, deep sequencing experiments or metabolic profiling is essential to uncover and then effectively target the critical regulators of diseased cell phenotypes. Estrogen Receptor α (ERα) is one of the master transcription factors regulating the gene programs that are important for estrogen responsive breast cancers. In order to understand to role of ERα signaling in breast cancer metabolism we utilized transcriptomic, cistromic and metabolomic data from MCF-7 cells treated with estradiol. In this report we described generation of samples for RNA-Seq, ChIP-Seq and metabolomics experiments and the integrative computational analysis of the obtained data. This approach is useful in delineating novel molecular mechanisms and gene regulatory circuits that are regulated by a particular transcription factor which impacts metabolism of normal or diseased cells.
Estrogens are important regulators of many physiological processes in both females and males including reproductive tissues, metabolic tissues, brain and bone1. In addition to beneficial effects in these tissues, estrogens also drive cancers that arise from mammary and reproductive tissues. Estrogens mainly work through ERs to induce cell type specific effects. Deep sequencing of transcripts regulated by ERα using RNA-Seq and genome-wide ERα DNA binding sites analysis using ChIP-Seq proved to be useful to understand how ERα works in different tissues and cancers that arise from them. We and others have published gene expression profiles associated with different receptors (ERα v.s. ERβ)2,3, different ligands3-5 and different coregulators2,4,6,7.
RNA-Seq is the main method to examine the transcriptome, offering higher precision and efficiency compared to microarray based gene expression analysis8. RNA obtained from cell lines2-4,7, tissues or tumor samples are sequenced, mapped to available genomic assemblies and differentially regulated genes are identified. Chromatin Immunoprecipitation (ChIP) is employed to dissect the transcription factor and coregulator chromatin binding to known regulatory binding sites. ChIP-Seq (ChIP followed by high throughput sequencing) provides unbiased detection of global binding sites. Metabolomics is another increasingly used system biology approach, which quantitatively measures, dynamic multiparametric response of living systems to various stimuli including chemicals and genetic perturbations.
By performing global metabolic profiling, a functional readout can be obtained from cells, tissues, and blood. In addition, information from transcriptome experiments do not always reflect actual changes in the level of enzymes that contribute to biochemical pathways. Combined analysis of transcriptome and metabolome data enables us to identify and correlate changes in gene expression with actual metabolite changes. Harnessing the information from all these large scale datasets provide the mechanistic details to understand the role of transcription factors regulating complex biological systems, especially ones that pertain to human development and diseases like cancer and diabetes.
The complex nature of the mammalian genome makes it challenging to integrate and fully interpret the data obtained from the transcriptome, cistrome and metabolome experiments. Identifying functional binding events that would lead to changes in expression of target genes is important because once functional binding sites are identified; ensuing analysis, including transcription binding (TF) motif analysis, could be performed with higher accuracy. This leads to the identification of biologically meaningful TF cascades and mechanisms. Also direct comparison of RNA-Seq and ChIP-Seq experiments are not always possible since the data from each experiment have differing scales and noises and in some cases meaningful signals are obscured by population noise. We are not aware of any study that integrated information from these three independent but related approaches to understand the direct metabolic regulation by ERα in breast cancer. Therefore, our overall goal in this paper is to relate productive binding events to gene expression and metabolite changes. In order to achieve this goal, we integrated data from RNA-Seq, ChIP-Seq and metabolomics experiments and identified those estrogen induced ERα binding events that would lead to gene expression changes in metabolic pathways. For the first time, we provide a complete set of protocols (Figure 1) for generating ChIP-Seq, RNA-Seq and metabolomics profiling and performing integrative analysis of the data to uncover novel gene circuits regulating metabolism of breast cancer cell lines.
1. Preparation of RNA-Seq Samples
2. Preparation of ChIP-Seq Sample
3. Metabolomics Assay Sample Preparation
4. Integrative Analysis
Transcriptomics
To analyze differentially expressed genes by E2 treatment, we chose to perform an RNA-Seq experiment. In addition to providing information about mRNA levels, RNA-Seq data can also be used to monitor changes in non-coding RNA (long non-coding RNAs, microRNAs) and alternative splicing events. We did not provide information on the analysis of non-coding RNAs or alternatively transcribed genes, since scope of our study is to identify protein coding genes that are important for metabolic regulation. However, RNA-Seq is an excellent way of obtaining information on differential gene expression events.
In order to obtain high quality reads, it is important to get high purity RNA. After isolating RNA we purified the RNA using a RNA clean up kit. Unfortunately nearly 50% of the RNA is lost during this process and amount of starting RNA should be taken into consideration to obtain required amount (100-500 ng) by the end of purification step.
We quantified the RNA yields using fluorometer RNA HS assay, which is very accurate and is preferred method for quantification of low-abundance RNA. Next, the integrity and overall quality of the RNA samples were examined using bioanlayzer, which is a viable alternative to gel electrophoresis using a minimal amount of RNA. The analysis shows all the samples have sharp and clean bands of 18S and 28S rRNAs indicating the integrity and purity of the samples (Figure 2B). RNA Integrity Number (RIN) was used as a standard for RNA quality control. RIN 10 indicates intact RNA, RIN 6 partially degraded and RIN3 strongly degraded16.
It is recommended that the RIN to be at least 7 for sequencing experiment. All of our RNA samples received RIN value between 9.6-9.9 (Figure 2A). Sequencing libraries were constructed from 500ng of high-quality RNA from each sample using ultra-high-throughput sequencing system such as Illumina 2500. On average 18,000,000 High-quality sequencing reads were obtained for each sample (Table 1), which was ready for downstream analysis. To check the overall quality of the high-throughput sequence raw data, FastQC was run for each sample's reads. A representative FastQC report for one vehicle RNA-Seq data was shown (Figure 3). The sequence length of the most reads was about 100 bp (Figure 3A). For each read, the quality score was 32-34 for the first 5 bp and 36-38 from 6-100bp (Figure 3B). Among 17,990,863 reads generated from this sample, most of them had quality score higher than 34 (Figure 3C). The GC content per read in the sequence also followed the normal distribution with an average of 48% GC. Overall the quality score of the reads was very high.
Cistromic analysis of ERα binding sites
To achieve the efficient deep sequencing, obtaining DNA fragments at desirable size is one of the important factors. Current sequencing approaches may have different requirements on the DNA fragments, for example 300-600 bp for ultra-high-throughput sequencing system, 100-200 bp for AB/SOLiD17. In this experiment most of the DNA fragments are between 300 bp and 600 bp as shown on gel (Figure 4). As an alternative, readers might chose to prepare their chromatin using MNase digestion, however we feel our established protocol provides the required samples with high-quality and provides reproducible results. Ten ng of DNA from each treatment and its corresponding input sample was prepared in EB buffer. The ChIP DNA was single-read sequenced using ultra-high-throughput sequencing system. ChIP DNA samples yielded about 20,000,000 reads while the input DNA yielded more than 35.000,000 reads (Table 1).
Metabolomics
To quantify the metabolites in mammalian cells using GCMS, at least 10 µg of cell mass are required. We started with 400,000 MCF7 cells with the experiments. By the time of harvest, there were about 500,000 cells in each plate. The overview of the metabolites represented by peaks were compared between the control and the Estradiol treated sample (Figure 5). About 100 metabolites were identified, which count for 60% of the total known in mammalians. Here we present a list of the top 10 metabolites, which show significant changes in E2 treatment (Table 2). Overall, E2 upregulated pathways including fructose and mannose metabolism, histidine metabolism, purine metabolism, cholesterol biosynthesis and vitamin B3 metabolism. The downregulated pathways were butanoate metabolism, de novo fatty acid biosynthesis, pentose phosphate pathway, urea cycle and metabolism of arginine (Table 3).
Data analysis and integration
The data from RNA-Seq, ChIP-Seq and GC-MS were processed and analyzed through a series of steps (Figure 6). After the comparison between genes identified in RNA-Seq and ChIP-Seq, one set of up-regulated and one set of down-regulated genes by Estradiol were extracted. From the metabolic data, we obtained two sets of up- and down-regulated compounds by the Estradiol treatment. Next we used Metscape, an app for Cytoscape, to visualize and interpret the gene expression and metabolic data in the context of human metabolism15. First we chose to include elements of compound, reaction, enzyme, and gene in the network. We selected the compounds/genes as query and two networks of the E2 up-regulation (Figure 7A) and down-regulation (Figure 7B) were shown. The Metscape also provides an option to build networks on selective pathways. For example, using the same set of data as building the down-regulated overall network, a subnetwork of androgen-estrogen biosynthesis and metabolism pathway was generated by switching the query from the compound/gene to specific pathway. The genes or compounds with significant changes were highlighted in brighter color. Besides selecting a specific pathway from the drop-down window as described, one can also create a sub-network by applying "create subnetwork" function to the chosen area. As shown in Figure 6A and B, ERα activation and direct binding to gene regulatory regions impacted many metabolic pathways in breast cancer cells. Our integrative analysis indicated that, ERα directly binds to and regulates expression of FASN gene, which is important for de novo fatty acid biosynthesis pathway (Figure 7C). In addition E2 treatment downregulated androgen-estrogen biosynthesis pathways by repressing expression of CYP4Z1, CYP2E1, CYP4B1, CYP2C8, TPO, GSTA4 and GSTM2 in these pathways.
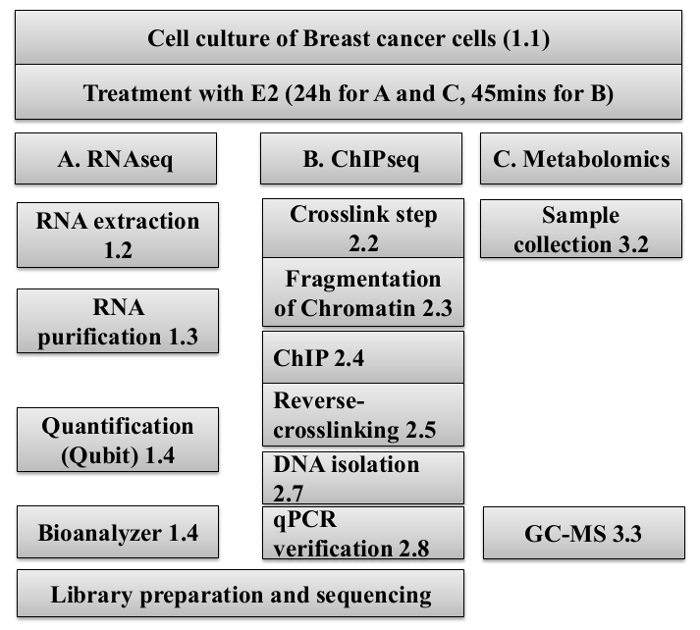
Figure 1: Workflow of the preparation of samples of RNA, DNA and cell lysates for the RNA-Seq, ChIP-Seq, and Metabolomic analysis.
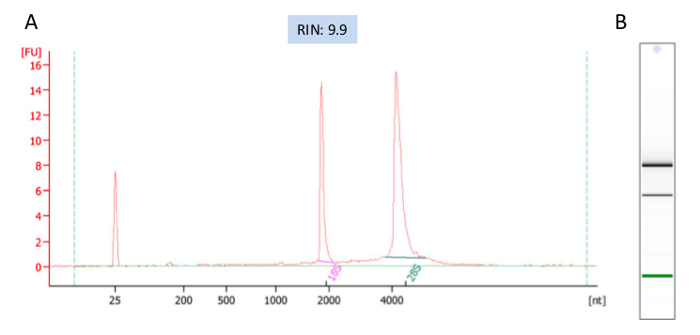
Figure 2: A representative electropherogram of the RNAs analyzed with Agilent 2100 Bioanalyzer. RNA Integrity Number (RIN), indicator of RNA quality, was given by the analysis as 9.9. (A) On a virtual gel picture of the RNA sample both bands of 26S and 18S are sharp. (B) Fluorescent signals of individual trace in the RNA shows that the intensity of 28S peak is greater than 18S peak and no contamination is seen. Please click here to view a larger version of this figure.
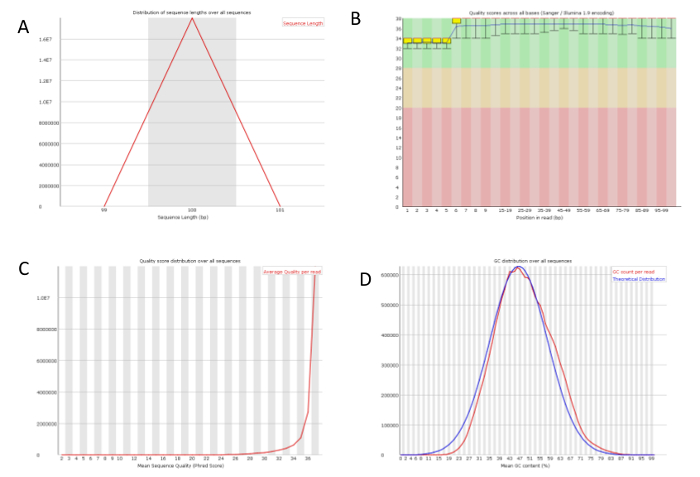
Figure 3: A representative quality check on the RNA-Seq raw data. One of the vehicle sample's sequence data was analyzed using FastQC. (A) The sequence length distribution of the library which is 100 bp. (B) The quality score along the position in read. (C) The quality score per sequence showed the universal high quality of all sequences. (D) The GC content per read matched the theoretical distribution. Please click here to view a larger version of this figure.
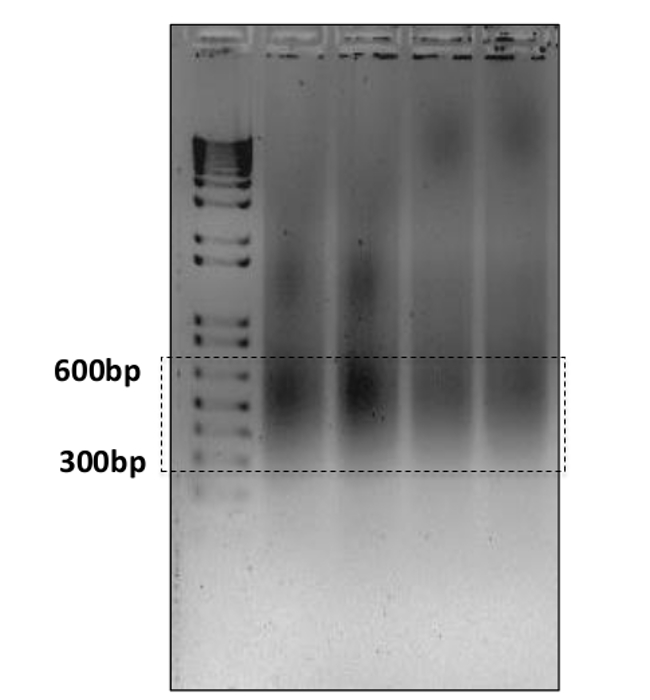
Figure 4: Gel electrophoresis of the sonicated chromatin fragments. 5 µl of the cell lysate from each sample was run on a 1.5% agarose gel with a 1,000 bp plus ladder on the first lane. The majority of the fragments are between 300 and 600 bp. Please click here to view a larger version of this figure.
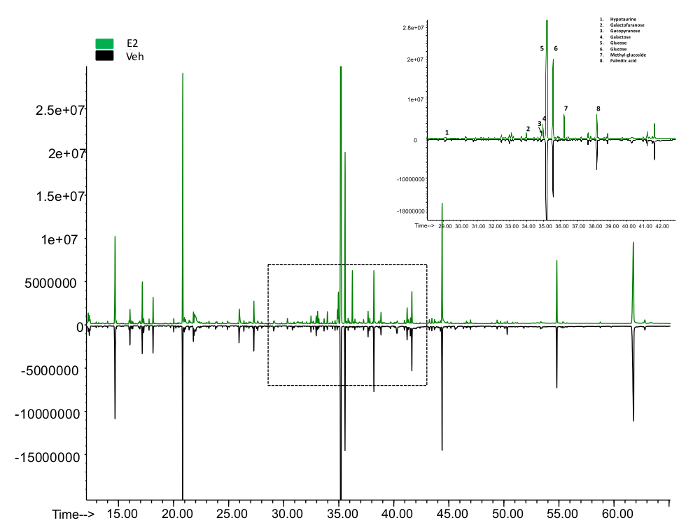
Figure 5: The overview of peaks representing metabolites from the GC-MS. The upper panel shows the peaks identified in the E2 treated samples while the lower panel from the control. The area enclosed was roomed in to show the exact metabolite represented by each peak. Please click here to view a larger version of this figure.
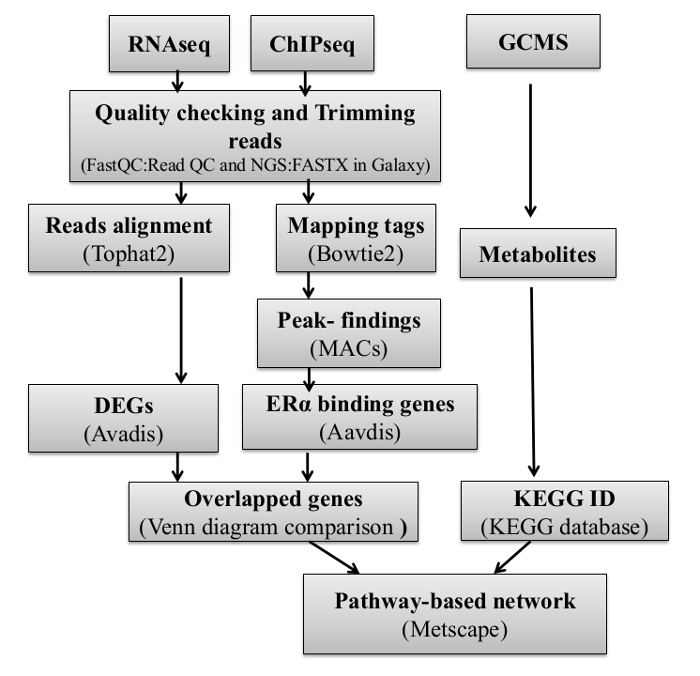
Figure 6: Flowchart of the Integrative clustering method.
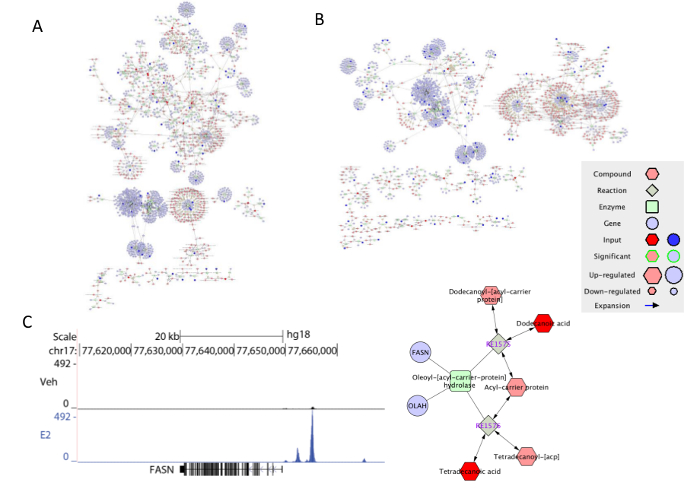
Figure 7: The visualization of the integrated gene-metabolite data in Metscape. (A) The network of pathways up-regulated by E2. (B) The network of pathways down-regulated by E2. (C) E2 stimulated ERα recruitment to the nearby region of FASN, which is found to be regulated in the de novo fatty acid biosynthesis network generated by applying subnetwork function. Please click here to view a larger version of this figure.
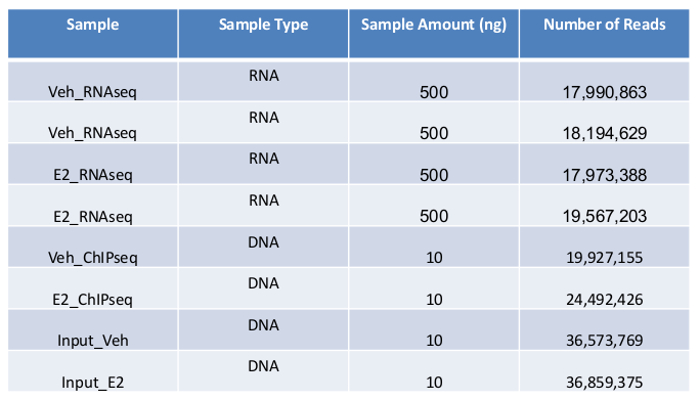
Table 1: Summary of ultra-high-throughput sequencing of RNA-Seq and ChIP-Seq.
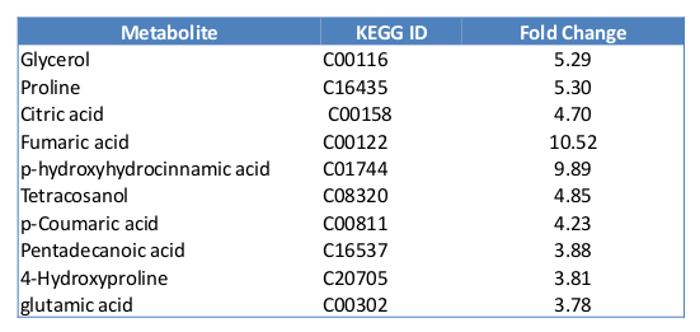
Table 2: List of top 10 metabolites with significant changes with E2 treatment.
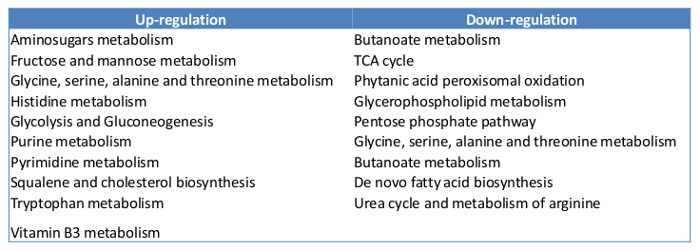
Table 3: Pathways up- and down-regulated by E2 treatment.
In this paper, we described generation and integrative analysis of RNA-Seq, ChIP-Seq and metabolomics data from MCF-7 cells that are treated with E2. We developed a set of protocols strategizing to utilize the most efficient methods and user friendly soft wares which produce biologically relevant discovery. To our knowledge, ours is the first study to integrate -omics data from three different analysis and identified new metabolic pathways that ERα directly regulated in breast cancer cells.
Transcriptomics
It is critical to start with high quality RNAs for a successful transcriptomic analysis. Good practice will eliminate the chance of RNA degradation, including creating RNase-free bench, changing gloves often, storing in -80 °C and keeping on ice in use. Addition of overnight incubation at -20 ºC improves RNA recovery. To avoid freezing and thawing RNA repeatedly, one can allocate the RNAs for downstream procedures upon the isolation and purification. For the existence of sequencing errors, qRT-PCR using the cDNA from the samples is often performed to verify the differentially expressed genes identified in RNA-Seq. Therefore, enough RNA should be reserved for this purpose. We perform paired-end-sequencing that enables us to analyze splice variants, non-coding RNAs and miRNAs. To avoid high-sequencing costs, single-end sequencing can be performed as well. Compared to microarrays, RNA-Seq is more sensitive and is not limited to the probes provided on the chip. We obtain information not only on coding sequences, but also on non-coding genes and differentially spliced transcripts. We are currently using this technique to analyze transcriptomes of various cell lines after ligand treatments as well as tissues obtained from mouse experiments.
Cistromics
The ultra-high-throughput sequencing method requires minimal 5 ng ChIP DNA for library construction. In standard ChIP-Seq protocol18, it is recommended to have at least 10 ng. Quantitation with fluorometry is critical. In this protocol we used double strand DNA detection assay to determine the DNA concentration. One can also use fluorometer assay for precise DNA quantification. For the differences in equipment and materials, it is very important for each lab to establish their own sonication protocol, which generates desirable DNA fragments sizes. Over-shearing the ChIP DNA might cause loss of enrichment of target DNAs while ChIP DNA of large sizes create problem for efficient sequencing. Before submitting the DNA to sequencing, it is always important to verify enrichment of some known regions by qPCR. The technique is still limited by the efficiency and specificity of the antibody used for immunoprecipitations. To obtain binding site information that could be reliably used in comparative analyses, we validate our reagents following ENCODE ChIP-Seq standards,19 and use standardized protocols that provide us with consistent data sets. Coupled with the post transcription factor binding site enrichment analysis, ChIP-Seq is still one of the best methods to determine direct binding of transcription factors to chromatin. We are currently using this protocol to study recruitment kinases, coregulators and other transcription factors to chromatin in other cell lines as well as estrogen responsive mouse tissues.
Metabolomics
For a successful metabolic profiling in human breast cancer cells, a careful sample preparation is critical. The amount of cells in use and cell culture condition in this protocol is optimal for MCF7 cells. Other cell lines might require more or less cells for detection of a significant number of metabolites. We obtain around 100 metabolites in each experiment. This method is limited for detection of short lived metabolites or metabolites that are present at low concentrations. This method offers the ease of using a single sample prep to identify multiple metabolites. We are currently using this technique to identify estrogen regulated metabolites in serum and various tissues from mouse.
Data Integration
Numerous transcriptomics and cistromics studies were done to investigate estrogen signaling and gene regulation in breast cancer cells, including MCF7 cells2,5-7,20. In this study, for the first time, we added metabolomics data and tried to infer metabolic networks that are directly regulated by ERα upon ligand addition. This novel approach enabled us to pin point molecular circuitries regulated by estrogens that impact cellular metabolism. Overall, our findings support the role of ERα as a master regulator of breast cancer biology.
In summary, we provided a detailed compendium of protocols for generation of RNA-Seq, ChIP-Seq and metabolomics samples from breast cancer cells after estrogen treatments and integrative analysis of the data obtained from these -omics approaches. These protocols will enable researchers to do similar analysis for other transcription factors, nuclear receptor ligands and nutrient conditions.
The authors have nothing to disclose.
This work was supported by grants from the National Institute of Food and Agriculture, U.S. Department of Agriculture, award ILLU-698-909 (ZME) and Pfizer, Inc (ZME). Its contents are solely the responsibility of the authors and do not necessarily represent the official views of the U.S. Department of Agriculture.
Triglyceride Mix | Sigma | 17810-1AMP-S | |
Oleic acid | Sigma | O1257-10MG | Oleic Acid-Water Soluble powder |
TRIzol Reagent | Life technologies | 15596-026 | |
Dynabeads Protein A | Life technologies | 10006D | |
Dynabeads Protein G | Life technologies | 10007D | |
QIAquick PCR Purification Kit | QIAGEN | 28106 | DNA isolation of input sample |
ZYMO ChIP-DNA Isolation kit | Zymo Research | D5205 | ChIP DNA Clean & Concentrator |
Quant-iTª PicoGreen¨ dsDNA Assay Kit | Invitrogen | P7589 | DNA Quantitation |
RNase-Free DNase Set | QIAGEN | 79254 | RNA purification |
DEPC Treated Water | LIFE TECH | 462224 | Dnase/Rnase Free |
Model 120 Sonic Dismembrator | Fisher Scientific | FB120110 | With 1/8 probe |
Fisher Scientific Sound Enclosure | Fisher Scientific | FB-432-A | For sound reduction |
Eppendorf Tubes 5.0mL | Eppendorf | 0030 119.401 | 200 tubes (2 bags of 100 ea.) |
Random Primer Mix | NEB | S1330S | |
DNTP MIX | NEB | N0447S | |
M-MuLV Reverse Transcriptase | NEB | M0253S | |
FastStart SYBR Green Master | ROCHE | 4673484001 | |
Agarose | Fisher | BP160100 | 1.5% agarose gel |
Qubit® RNA HS Assay Kit | Life technologies | Q32852 | RNA quantification (100 assays) |
Formaldehyde | Sigma | F8775 | |
Protease Inhibitor tablets | Roche | 4693116001 | Each tablet is sufficient for 10ml lysis buffer |
PhosSTOP Phosphatase Inhibitor Cocktail Tablets | Roche | 4906845001 | Each tablet is sufficient for 10ml lysis buffer |
Qubit® Assay Kits | Life technologies | Q32850 | For 100 assays |
Automated cell counter | ORFLO | MXZ000 | |
tube Rotator | VWR | 10136-084 | |
Victor X5 Multilple plate reader | PerkinElmer | 2030-0050 | |
Microcentrifuge 5417R | Eppendorf | 22621807 | |
Magnetic Stand | Diagenode | B04000001 | |
Fast Real-time PCR system | Applied Science | 4351405 |