Here we describe a microscope-based technique to visualize and quantify the early cascades of events during phagocytosis of pathogens such as the fungi Candida albicans and particulates that are larger than 0.5 µm including zymosan and IgG-coated beads.
The mammalian body is equipped with various layers of mechanisms that help to defend itself from pathogen invasions. Professional phagocytes of the immune system — such as neutrophils, dendritic cells, and macrophages — retain the innate ability to detect and clear such invading pathogens through phagocytosis1. Phagocytosis involves choreographed events of membrane reorganization and actin remodeling at the cell surface2,3. Phagocytes successfully internalize and eradicate foreign molecules only when all stages of phagocytosis are fulfilled. These steps include recognition and binding of the pathogen by pattern recognition receptors (PRRs) residing at the cell surface, formation of phagocytic cup through actin-enriched membranous protrusions (pseudopods) to surround the particulate, and scission of the phagosome followed by phagolysosome maturation that results in the killing of the pathogen3,4.
Imaging and quantification of various stages of phagocytosis is instrumental for elucidating the molecular mechanisms of this cellular process. The present manuscript reports methods to study the different phases of phagocytosis. We describe a microscope-based approach to visualize and quantify the binding, phagocytic cup formation, and the internalization of particulate by phagocytes. As phagocytosis occurs when innate receptors on phagocytic cells encounter ligands on a target particle bigger than 0.5 µm, the assays we present here comprise the use of pathogenic fungi Candida albicans and other particulates such as zymosan and IgG-coated beads.
Despite the continuous exposure to pathogens such as bacteria, viruses and fungi, our body is well equipped with immune mechanism that provide protection against infection. The innate immune system is the first line of defense against invading pathogens and relies mainly on phagocytic cells that recognize and internalize foreign targets.
Phagocytosis is an evolutionarily conserved cellular process that encompasses the engulfment of unwanted particulates greater than 0.5 µm. Phagocytic cells express a wide range of immune receptors (also known as pattern recognition receptors, PRRs) at the cell surface that enable them to recognize pathogen-associated molecular patterns (PAMPs) present on pathogens prior to engulfment3. Pathogen binding is followed by receptor clustering at the cell surface and triggers the formation of a phagocytic cup. This results in actin-driven membrane remodeling that protrudes around the target, eventually enveloping it and pinching-off to form a discrete phagosomal vacuole2,5. The phagosome then matures and acidifies by subsequent fusion with late endosomes and lysosomes that forms phagolysosome6.
Although phagocytosis is described as receptor-mediated and actin-driven event, this process also relies on spatial-temporal modification of lipids that compose the plasma membrane, such as phosphoinositides (PIs) and sphingolipids7,8. While actin polymerization is dictated by a local accumulation of phosphoinositol-4,5-biphosphate (PI(4,5)P2) at the base of the phagocytic cup, actin depolymerization depends on the conversion of (PI(4,5)P2 to phosphoinositol-3,4,5-biphosphate (PI(3,4,5)P3)3,9. Both modifications are essential as the former leads to successful extension of pseudopods around the target and the latter enables sinking of particles in the cytosol of the phagocyte10.
Cells that have the ability to phagocytose are either professional phagocytes, like macrophages/monocytes, granulocytes/neutrophils, and dendritic cells (DCs) or nonprofessional phagocytes, such as fibroblast and epithelial cells11. Phagocytosis performed by all phagocytes plays a central role in tissue maintenance and remodeling, while phagocytosis performed by professional phagocytes is responsible for the coordination of the innate and adaptive immune response against pathogens. Professional phagocytes do not only engulf and kill the pathogen, but also present antigens to the lymphoid cells of the adaptive immune system. This contributes to the release of pro-inflammatory cytokines and to the engagement of lymphoid cells, therefore leading to the successful blockade of infection12.
Conventional biochemical techniques have been instrumental in gaining knowledge regarding the molecular mechanism of different cellular processes during phagocytosis, such as post-translational modifications and various high-affinity associations between proteins. However, it is difficult to obtain information regarding the spatial and temporal dynamics of phagocytic events using the conventional biochemical methods. Live cell imaging not only allows us to monitor cellular events in a time sensitive manner but also enables us to gain information at a single cell level. Here we describe a method to investigate the different stages of phagocytosis, as well as to analyze the whole process spatiotemporally using confocal microscopy.
1. Preparation of DC2.4 and RAW 264.7 Cell Lines
NOTE: The macrophage-like cell line RAW 264.7 and the dendritic cell line DC2.4 are both murine origin, and the following conditions were used to grow the cells.
2. Preparation of Fluorescent Conjugated Particulates: C. albicans, Zymosan, IgG-coated Beads
3. Phagocytosis
NOTE: Phagocytosis is a complex process that begins with binding of the particles on the cell surface of the phagocytes through interaction of PRRs with ligands on the surface of the particle. Binding is followed by the assembly of actin and its associated proteins at the site of contact, and the formation of a phagocytic cup. The subsequent actin disassembly occurs at the phagosome and results in the complete engulfment of the particulate. Below we describe the different stages of phagocytosis.
Microscope-based method to monitor the different stages of phagocytosis is presented. The different events during the phagocytosis of various fluorescent particulates by DC2.4 cells are shown. Using the techniques described here, we investigated the role of sphingolipids in the early stages of phagocytosis. For this purpose, DC2.4 dendritic cells genetically deficient in Sptlc2, the enzyme that catalyzes the first and rate-limiting step in the sphingolipid biosynthetic pathway, were used. As compared to wild type cells, Sptlc2-/- DC2.4 cells have significantly reduced level of sphingolipids including ceramide, sphingomyelin and glucosylceramide8. Sptlc2-/- DC2.4 cells are defective in binding, as well as in the uptake of C. albicans, zymosan and IgG latex beads8. In Figure 1, the binding of fluorescently conjugated-zymosan particles in DC2.4 cells is shown (see Section 3.1 for details). Sptlc2-/- DC2.4 cells showed significantly less binding of zymosan than the control DC2.4 cells (p = 0.0008; Figure 1A). The number of zymosan particles bound per cell was significantly higher for control cells than for Sptlc2-/- DC2.4 cells (p < 0.0001; Figure 1C). We next investigated the ability of Sptlc2-/- DC2.4 cells to phagocytose C. albicans. Sptlc2-/- DC2.4 cells showed significantly less phagocytosis of C. albicans (p < 0.0005) as compared to the control cells (Figure 2A, 2B). As expected, Sptlc2-deficient cells showed significantly higher number of non-phagocytic cells (p < 0.05; Figure 1C) and decreased number of C. albicans per cell (Figure 1C, D). These results underscore the role of an intact sphingolipid biosynthetic pathway in binding, as well as in the uptake of particulates. Figure 3 shows the time-lapse images demonstrating the early stages of phagocytosis (see Section 3.3 for detailed procedure). Movie 1 shows the live imaging of DC2.4 cells stably expressing F-actin, a biosensor that reveals the distribution of filamentous actin in living cells (see Section 3.1 for more details).
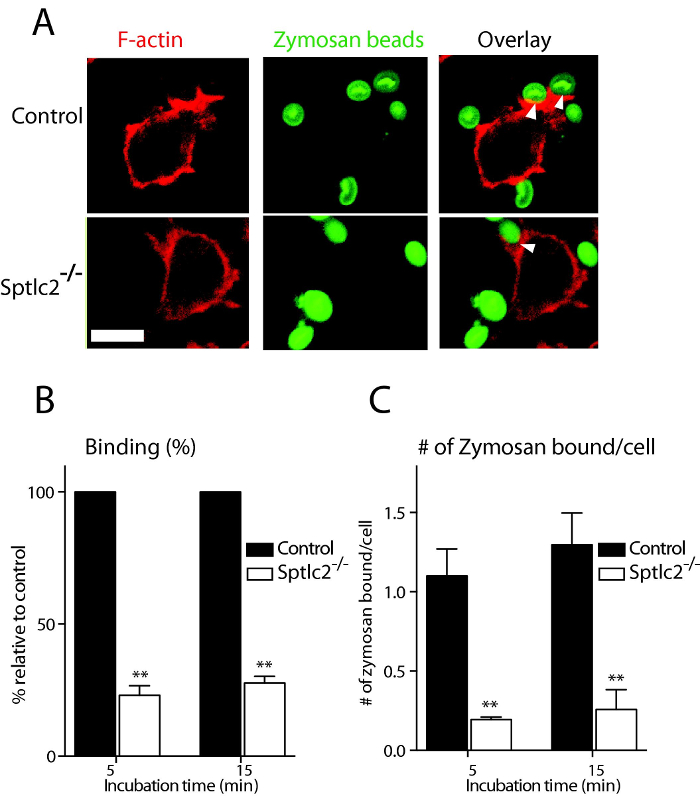
Figure 1: Binding assay of zymosan in DC2.4 cells. (A) Control and Sptlc2-/- DC2.4 cells were incubated with fluorescently conjugated zymosan, and their ability of binding the particulates examined by confocal microscopy. Arrows indicate sites of binding. Scale bar = 100 µm. (B, C) Quantification of the number of bound zymosan particles (B) and the number of zymosan particles bound per cell (C) is shown. Bound particles were quantified and presented as the percentage relative to the control. All graphs display SD of three independent experiments, and at least 200 cells were counted for each experiment. Unpaired t-test was used to analyze the significance of the observed differences. ** p < 0.001. Scale bar = 100 µm. Reprint with permission from Tafesse et al., 2015 8. Please click here to view a larger version of this figure.
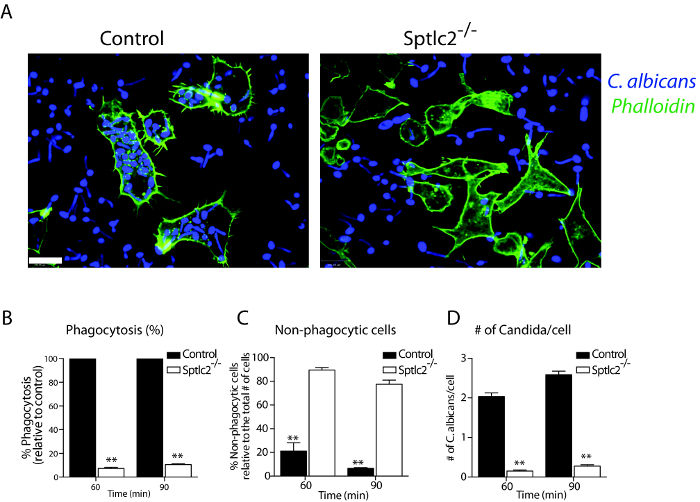
Figure 2: Phagocytosis of C. albicans in DC2.4 cells. (A) Cells were infected with Candida-BFP as described in Step 3.2. At 90 min post infection, cells were fixed and stained with fluorescently conjugated phalloidin and imaged using confocal microscopy. (B–D) Quantification of the number of internalized Candida-BFP, non-phagocytic cells, and the number of Candida-BFP per cell is shown. All graphs display SD of three independent experiments, and at least 200 cells were counted for each experiment. Unpaired t-test was used to analyze the significance of the observed differences. ** p < 0.001. Scale bar = 100 µm. Reprint with permission from Tafesse et al., 2015 8. Please click here to view a larger version of this figure.
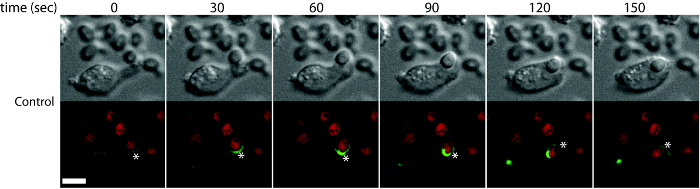
Figure 3: Time-lapse imaging of C. albicans uptake to visualize the early stages of phagocytosis. Wild type DC2.4 cells stably expressing F-actin-mCherry (F-actin) were incubated with Candida-BFP (shown in red) and imaged using confocal microscopy. Images captured at 30 sec intervals are shown. Asterisks show the different stages of actin remodeling during phagocytosis. Scale bar = 100 µm. Reprint with permission from Tafesse et al., 2015 8. Please click here to view a larger version of this figure.
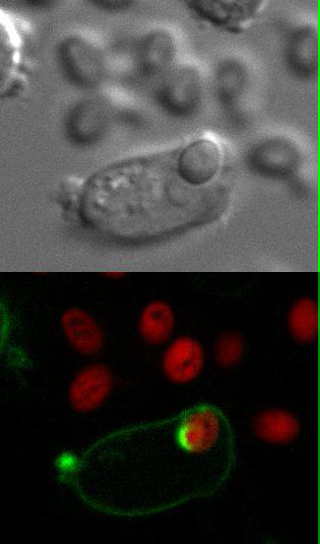
Movie 1: Live imaging. Wild type DC2.4 cells stably expressing F-actin-mCherry (shown in green) were infected with Candida-BFP (shown in red). Live imaging was performed using confocal microscopy as described in Step 3.3. Reprint with permission from Tafesse et al., 2015 8. Please click here to view this video. (Right-click to download.)
Professional phagocytes, such as macrophages and dendritic cells, engulf and eliminate invading pathogens therefore making phagocytosis an important component of the host defense system. During this process phagocytes undergo extensive membrane reorganization and cytoskeleton rearrangement at their cell surface8,19,20. To better understand this dynamic process, visualization of the different stages of phagocytosis is essential. Here we described a microscope-based method that was used to monitor the various steps of phagocytosis.
The main significance of the live imaging technique is that it provides remarkable capability to monitor the host-pathogen interface at the molecular level. By allowing visualization of the key steps of the microbial infection, live imaging provides critical insight into the fundamental nature of the immune response against pathogens8,10,21,22. In addition to phagocytosis, the techniques described here can be extended to study other types of receptor-mediated endocytosis, including macropinocytosis10. Live imaging is also a valuable approach to study the host-pathogen relationship of intracellular bacteria such as Mycobacterium tuberculosis and Salmonella typhi, as well as parasites including Leishmania and Toxoplasma gondii 22,23.
There are several advantages of live cell imaging over the other techniques such as conventional biochemical approaches. Live cell imaging allows us to monitor the spatial and temporal dynamics of cellular processes8. Moreover, live imaging allows us to gain information at a single cell resolution21. Phagocytosis is a dynamic cellular process that involves the clustering of receptors, actin and membrane lipid remodeling in a matter of a few minutes10. Live imaging enables us to capture such information in a time sensitive manner, which is otherwise difficult to accomplish.
The major limitation of this technique is that it requires careful optimization of experimental conditions and microscope setups. There are several key factors crucial for successfully obtaining images. The qualities of the fluorescent protein (or biosensor) utilized to visualize the phagocytes (such as F-actin) as well as the nature of the dye used to label the particulate are critical aspects of imaging. For live imaging, equally important is the equilibration of the environmental chamber of the microscope setup. Depending on the instrument, the equilibration can take from 15 min to several hours. Since CO2 supply is intended to preserve an appropriate pH within the culture media, it is necessary to allow enough runtime prior to setting up the experiment. In cases when the CO2 supply is insufficient and/or uneven, zwitterionic organic chemical buffering agent such as HEPES can be supplemented to the growth media. Long-term exposure of fluorescent particulates and live cells to confocal lasers can lead to phototoxicity and bleaching. Optimizing laser power (the less exposure time the better) and making sure that shutters are closed in between image acquisitions can reduce these problems. Overall, the techniques described here are ideal for studying the dynamic relationship between pathogens and the phagocytes during phagocytosis.
The authors have nothing to disclose.
We thank Wendy Salmon and Nicki Watson of the Keck facility at the Whitehead Institute of MIT for imaging.
β-Mercaptoethanol | AppliChem | A1108 | |
Bovine serum albumin (BSA) | Cell Signaling Technology | 9998 | |
DAPI (4',6-Diamidino-2-Phenylindole, Dilactate) | ThermoFisher | D3571 | |
Dimethyl sulfoxide (DMSO) | ThermoFisher | BP-231-1 | |
DMEM (Dulbecco’s Minimal Eagle’s medium) | Gibco | 11965 | |
PBS, 1X (Phosphate- Buffered Saline) | Corning cellgro | 21-031-CV | |
Fetal Bovine serum | Sigma Aldrich | 12003C | |
FITC-coupled IgG-coated latex beads | Cayman | 500290 | |
L-Glutamine 200mM (100X) | ThermoFisher | 25030081 | |
Paraformaldehyde Solution (4% in PBS) | Affymetrix | 19943 1 LT | |
Penicillin-streptomycin (10'000U/mL) | ThermoFisher | 15-140-122 | |
Phalloidin-Alexa Fluor 488 | ThermoFisher | A12379 | |
RAW 264.7 cells | ATCC | TIB-71 | |
RPMI (Roswell Park Memorial Institute) | Gibco | 61870 | |
Saponin | Sigma Aldrich | S7900 | |
Trypan blue solution (0.4% (w/v) in PBS) | Corning cellgro | MT25900CI | |
Trypsin-EDTA (1X) (0.05%) | ThermoFisher | 25300054 | |
Tween 20 Surfact-Amps Detergent Solution | ThermoFisher | 85114 | |
Zymosan-Alexa Fluor 594 | ThermoFisher | Z23374 | |
Chambered 1.0 Borosilicate Coverglass system (8 chambers) | ThermoFisher | 155361 | |
Glasstic slide 10 with grids | Hycor | 87144 |