Optically controlled substances are powerful tools to study signaling pathways. To expand the spectrum of possible experiments, we developed a device for studying optically controlled substances in real time using flow cytometry: the LED Thermo Flow.
Optogenetic tools allow isolated, functional investigations of almost any signaling molecule within complex signaling pathways. A major obstacle is the controlled delivery of light to the cell sample and hence the most popular tools for optogenetic studies are microscopy-based cell analyses and in vitro experiments. The flow cytometer has major advantages over a microscope, including the ability to rapidly measure thousands of cells at single cell resolution. However, it is not yet widely used in optogenetics. Here, we present a device that combines the power of optogenetics and flow cytometry: the LED Thermo Flow. This device illuminates cells at specific wavelengths, light intensities and temperatures during flow cytometric measurements. It can be built at low cost and be used with most common flow cytometers. To demonstrate its utility, we characterized the photoswitching kinetics of Dronpa proteins in vivo and in real time. This protocol can be adapted to almost all optically controlled substances and substantially expands the set of possible experiments. More importantly, it will greatly simplify the discovery and development of new optogenetic tools.
Optogenetic tools have been gaining popularity, in part because they can be used to decipher the wiring of signaling pathways1-4. They are based on the ability of photoactivatable proteins to change their conformation and binding affinity when illuminated with light. Fusing these proteins to signaling elements allows for the specific regulation of a single player within complex intracellular signaling pathways5-12. Consequently, a signaling pathway can be studied with high temporal and spatial resolution.
Most cell-based optogenetic studies utilize microscopy-based methods combined with culturing in the presence of light, followed by biochemical analysis11,12. In contrast, a flow cytometer singularizes cells along a capillary and measures cell size, granularity and fluorescence intensities. This method has major advantages over microscopy or biochemical methods, including the ability to analyze thousands of living cells at single-cell resolution in a very short time. Hence, it is desirable to combine optogenetics with flow cytometry.
To our knowledge, there is no established protocol for optogenetic flow cytometry. A broadly accepted procedure is to manually illuminate cells from outside the reaction tube with flashlight devices. However, manual illumination in the flow cytometer requires the light to pass through the reaction tube and, for live cell imaging, a cylindrical, heated water chamber. This causes substantial light scattering and loss of light. Moreover, the light intensity provided by manual illumination is not reproducible between experiments (angle, distance, etc.) and there is a practical limit to the number of wavelengths in one experiment.
By constructing the LED Thermo Flow device, we were able to overcome these limitations. With this device, cells can be illuminated with specific wavelengths in a temperature-controlled manner during flow cytometric measurements. This allows for precise and reproducible amounts of light within and between experiments.
To demonstrate the utility of our device in vivo, we recorded the fluorescence signal of Dronpa in Ramos B cells during photoswitching. Ramos B cells are derived from a human Burkitt's lymphoma. Dronpa is a fluorescent protein that exists as a monomer, dimer or tetramer. In its monomeric form, it is non-fluorescent. Illumination with 400 nm light induces dimerization and tetramerization and renders the Dronpa protein fluorescent. This process can be reversed by illumination with 500 nm light. The Dronpa protein has been used to control the function and location of signaling proteins4,13.
Here, we expressed a Dronpa-Linker-Dronpa protein in Ramos B cells to study photoswitching of Dronpa in a flow cytometer. Using our device, we were able to efficiently and reproducibly photoswitch Dronpa while recording its fluorescence intensity in real time. This method provides substantial advantages over current illumination protocols with manual illumination and significantly broadens the experimental repertoire for optogenetic tools and cage compounds. Using our device will significantly simplify and accelerate the discovery and development of novel optogenetic tools.
1. Designing and Building the Device
2. Measuring the Kinetics of an Optogenetic Tool
Using the LED Thermo Flow with a Flow Cytometer
The functional core of the device is a cylindrical chamber in which LED lights are arranged in a circular manner pointing inward. This chamber can be connected to a water supply and pump, which allows for controlling the temperature of the LEDs, as well as the cell sample. The LEDs are connected to a transformer and hence the light intensity for each wavelength can be individually controlled. The center of the device accommodates a standard size FACS tube, which can be connected to most standard flow cytometers (Figures 4 and 5). To show that illumination in our device does not lead to undesired heating of the cells, we measured the temperature of illuminated PBS over time (Figure 6) for three different wavelengths. Illumination with 360 nm, 400 nm or 500 nm leads to only a marginal temperature increase. Overall, the device presented here allows for the reproducible illumination of temperature-controlled cell samples to be measured in a flow cytometer.
Photoswitching of Dronpa
An expression vector encoding a Dronpa-Linker-Dronpa13,16 fusion construct was cloned and transduced into Ramos B cells. As depicted in Figure 7, the goal was to control the conformation of this fusion protein with light of specific wavelengths. Using our device, the cytosolic Dronpa-Linker-Dronpa fusion protein was photoswitched multiple times (Figure 8, left). Switching to the dark state occurs slowly, whereas switching to the bright state happens almost instantaneously. The spontaneous fluorescence recovery of Dronpa in the dark shows that efficient photoswitching to the bright form requires specific illumination and only slowly occurs spontaneously (Figure 8, right).
We performed a kinetic analysis of the photoswitching properties (Figure 9). The slopes for the switching kinetics were calculated for the initial 4 min of illumination. The slope for the spontaneous recovery was calculated for the initial 4 min in the dark.
The kinetic analysis shows, that the Dronpa photoswitching speed is overall very reproducible. In contrast, spontaneous recovery of Dronpa fluorescence in the dark is very inefficient. Even after longer incubation in the dark, only about 10% of the Dronpa fluorescence is recovered. This shows that indeed the illumination in our device induces photoswitching.
Hence, using the described method, we can generate real time photoswitching data in a flow cytometer, which can be translated into a kinetic evaluation of many optogenetic tools.
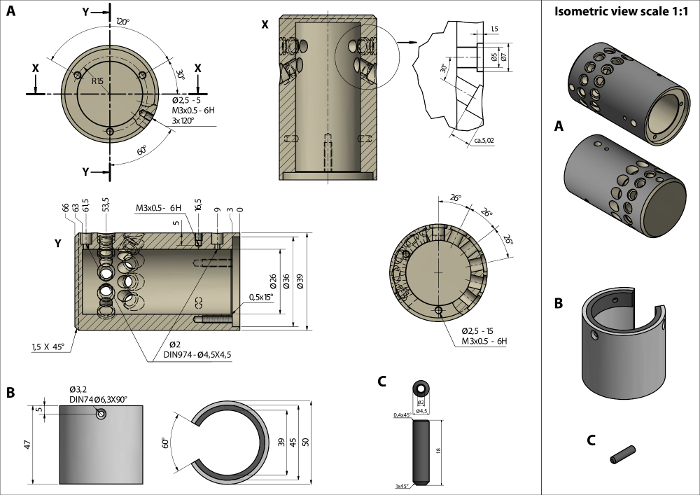
Figure 1: Construction plan of the outer layer. All depicted pieces are custom made from polyvinyl chloride (PVC). Piece A: Cylindrical PVC piece with drilled holes to insert LEDs and the tube clips. Piece B: The outer sheath to protect the LEDs from physical damage. Piece C: The tube clip that connects the inner cavity with rubber tubes to allow for water cooling. Please click here to view a larger version of this figure.
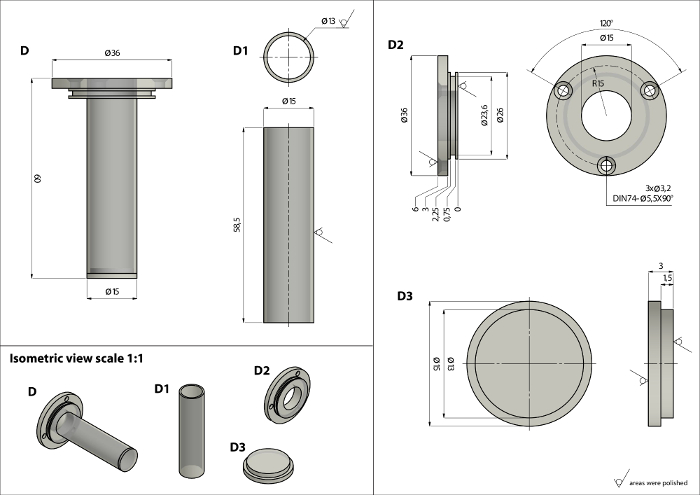
Figure 2: Construction plan of the inner layer. All depicted pieces are made from Plexiglas. Piece D: This piece is comprised of three pieces D1, D2 and D3 and forms the unit enclosing the FACS tube. Piece D1: Cylindrical Plexiglas tube. Piece D2: Bottom lid of the inner layer. Piece D3: Lid of the inner layer. Please click here to view a larger version of this figure.
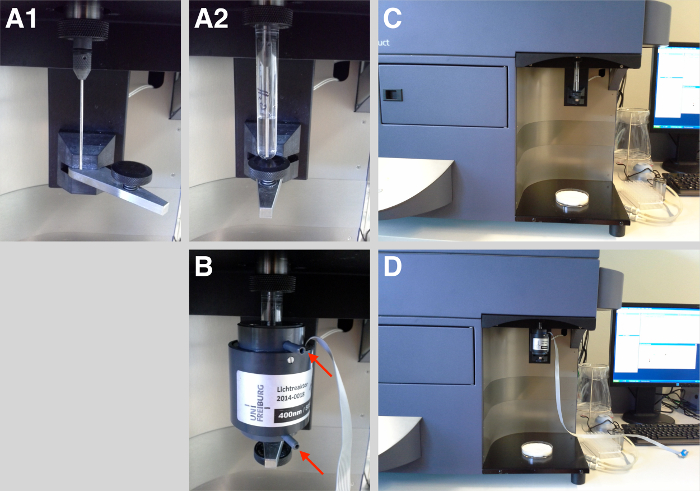
Figure 3: Using the device with a flow cytometer. A1: Sample inlet of a flow cytometer; A2: FACS tube connected to the sample inlet; B: The device enclosing the FACS tube; C: Sample inlet; D: Sample inlet with the device. Please click here to view a larger version of this figure.
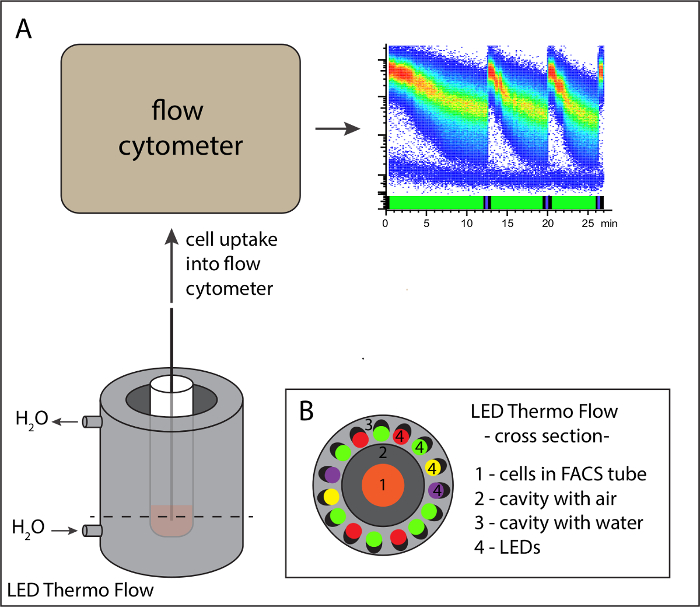
Figure 4: Workflow schematic of the device. A: Cells are illuminated in the device (bottom left) and simultaneously taken up and analyzed in the flow cytometer (top left). This allows, for example, the analysis of the kinetic properties of an optogenetic tool (top right). B: cross section of the device. Please click here to view a larger version of this figure.
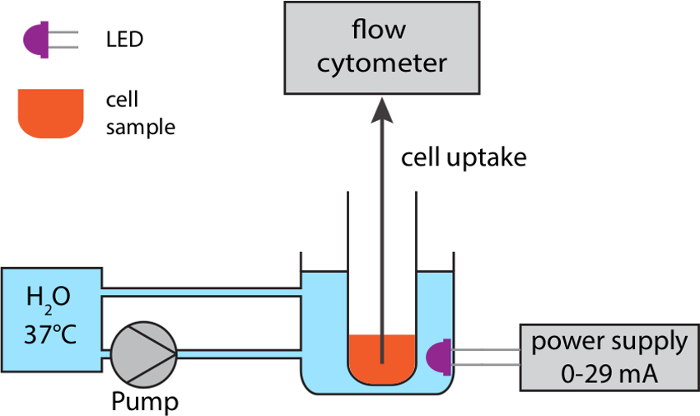
Figure 5: Process Flow Diagram of the device. One or more LED lights of specific wavelengths illuminate the cell sample in a FACS tube. The LEDs are surrounded by water, which is constantly exchanged by a heated bath circulator to keep the temperature of the cell sample stable. For live cell experiments, the temperature is adjusted to 37 °C. During this temperature-controlled illumination, cells are taken up into the flow cytometer for analysis. This setup allows, for example, to analyze the kinetic properties of an optogenetic tool. Please click here to view a larger version of this figure.
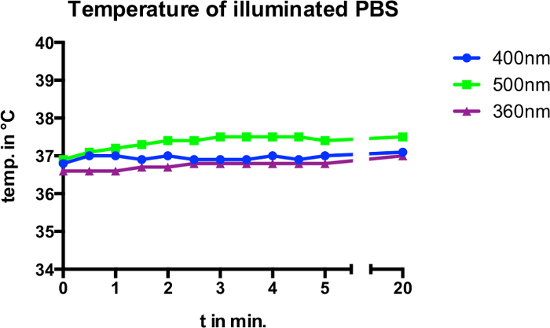
Figure 6: Temperature of illuminated PBS over time. 1 mL of PBS in a glass FACS tube was illuminated over time with 360 nm light, 400 nm light or 500 nm light. Please click here to view a larger version of this figure.
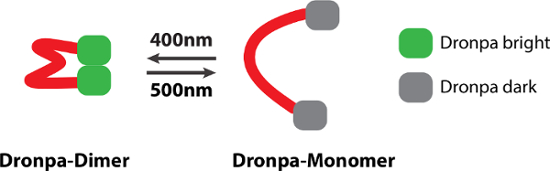
Figure 7: Model for photoswitching of the Dronpa-Linker-Dronpa protein. Illumination with 400 nm light will dimerize (and tetramerize) Dronpa and render it fluorescent. Illumination with 500 nm light will lead to the dissociation of the Dronpa proteins, where monomeric Dronpa is non-fluorescent. Please click here to view a larger version of this figure.
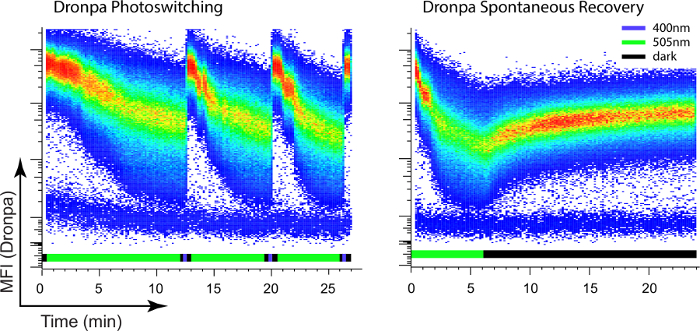
Figure 8: Characterization of the Dronpa photoswitching properties using the LED Thermo Flow combined with flow cytometry. Cells were illuminated as indicated above the X-axis and the Dronpa mean fluorescence intensity (MFI) is depicted over time. The Dronpa-Linker-Dronpa fusion protein can be photoswitched several times using the device (left). Spontaneous recovery of the Dronpa fluorescence intensity only occurs slowly and inefficiently (right). Please click here to view a larger version of this figure.
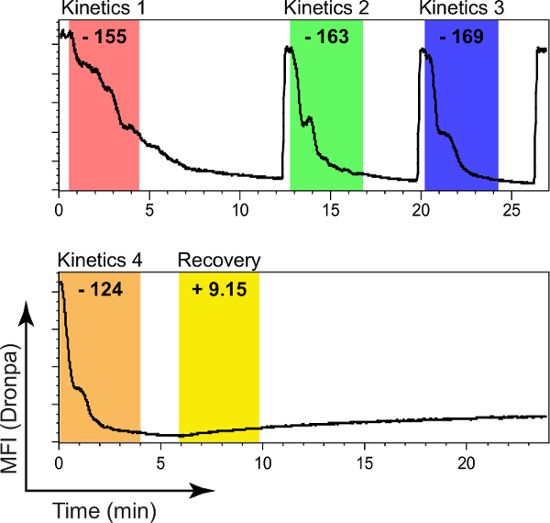
Figure 9: Kinetic analysis of Dronpa photoswitching. The kinetics of Dronpa photoswitching were calculated for the initial 4 min. of illumination and the recovery was calculated for the initial 4 min. incubation in the dark as indicated by the colored areas. The slopes for each calculation are depicted in bold numbers. Please click here to view a larger version of this figure.
The LED Thermo Flow is an innovative device to study optogenetic tools in a flow cytometer.
So far, optogenetic samples have been illuminated only with microscopy lasers or flashlight devices11,12. Depending on the angle and distance of the flashlight to the sample, substantial variability in the amount of illumination is expected between experiments. Furthermore, there is a limit to the number of flashlights a single person can operate in an experiment. This restricts the experimental repertoire and reproducibility. These limitations were addressed during the development of our device, which can be used to characterize real time photoswitching kinetics in living cells. To our knowledge, no comparable device exists.
In the current configuration, up to 30 LEDs can be built into one Thermo Flow chamber. Thus, depending on the required light intensities for each wavelength, a single device can be used for a wide variety of optogenetic tools. The established photoswitching protocols can then be optimized for functional readouts, e.g., calcium flux measurements. Our device may be suitable for other optically controlled substances, such as caged compounds or photoactivatable fluorophores.
Depending on the scientific question and specimen used, individualized protocols can be established rapidly. The use of glass tubes instead of polystyrene or polypropylene tubes is recommended to limit light-induced cytotoxicity at wavelengths between 400-500 nm. All tested cell lines survived illumination (360 nm, 400 nm or 500 nm) for up to one hour in glass tubes. We tried to investigate the cause of cell death during illumination in plastic tubes by performing transfer experiments. We illuminated cells in PBS or RPMI with light of different wavelengths and then transferred the supernatant to non-illuminated cells to measure cell death. None of the collected supernatants caused significant cell death in the recipient cells (data not shown). Also, the temperature of illuminated PBS in polystyrene, or polypropylene tubes is almost identical to the temperature in glass tubes. Hence, we can only speculate on the cause of cell death. Illuminated plastic may release an unstable substance or radiation of a wavelength that is toxic for cells.
The choice of medium used for each experiment is important. The buffering capacity must be considered and different reagents, like pH-indicators, absorb different wavelengths to different degrees. Furthermore, cell survival differs significantly, for example, when comparing FCS-free to FCS-containing media.
The goal of light titration is to use the minimal amount of light necessary for maximum photoswitching. For most experiments, it is favorable to maximize the speed of the photoswitch and hence maximize the light intensity. But, depending on the wavelength and cell type, light can have direct effects on the signaling behavior, which is why excessive illumination should be avoided.
It is possible to program light schedules for our device and to connect it to a computer as is common for other light devices. However, since most flow cytometers are in common work places shared by numerous different labs, it is best to maintain the device as small and portable as possible. Furthermore, the manual handling of our device for a two-color setup as presented here is so simple, that programming would only marginally improve the experimental procedure.
Taken together, we present here an innovative device, which combines the power of optogenetic tools and flow cytometry. This will substantially simplify the characterization and development of optogenetic tools in vivo and expand the experimental repertoire.
The authors have nothing to disclose.
We thank J. Schmidt from the University of Freiburg for constructing the device. We thank P. Nielsen and D. Medgyesi for their support and critical reading of this manuscript. This study was supported by the Deutsche Forschungsgemeinschaft through SFB746 and by the Excellence Initiative of the German Research Foundation (GSC-4, Spemann Graduate School).
Glass FACS tube | Thermo Fisher Scientific; Waltham, USA | 14-961-26 | Borosilicate glass tubes 12×75 mm |
Flow Cytometer | BD Bioscienceg; Heidelberg, Germany | Fortessa II | Special Order |
Dronpa: pcDNA3-mNeptune2-N | Addgene; Cambridge, USA | 41645 | |
PolyJet | SignaGen, Rockville, USA | SL100688 | |
LED 505 nm | Avago Technologies; Boeblingen, Germany | HLMP-CE34-Y1CDD | |
LED 400 nm | Avago Technologies; Boeblingen, Germany | UV5TZ-400-15 | |
Plexiglas tube 15 mm | Maertin; Freiburg, Germany | 76999 | |
Plexiglas 3 mm | Maertin; Freiburg, Germany | 692230 | |
Plexiglas 2,5 mm | Maertin; Freiburg, Germany | 692225 | |
Plexiglas 1,5 mm | Maertin; Freiburg, Germany | 692215 | |
PVC tile 5 mm | Maertin; Freiburg, Germany | 690020.005 | |
PVC tile 6 mm | Maertin; Freiburg, Germany | 690020.006 | |
PVC block 50 mm | Maertin; Freiburg, Germany | 690020.050 | |
RPMI | Invitrogen, Life Technologies; Darmstadt, Germany | 61870-010 | |
2-Mercaptoethanol | EMD; Germany | 805740 | |
FCS | PAN Biotech; Aidenbach, Germany | P30-3302 | |
Penicillin/Strptomycin (10000 U/ml) | Invitrogen, Life Technologies; Darmstadt, Germany | 15140-122 | |
Acrifix plexiglas glue | Evonic industries, Essen, Germany | 1R0192 | |
Tangit PVC-U glue | Henkel, Düsseldorf, Germany |