Specific ventilation imaging is a functional magnetic resonance imaging technique that allows for quantification of regional specific ventilation in the human lung, using inhaled oxygen as a contrast agent. Here, we present a protocol to collect and analyze specific ventilation imaging data.
Specific ventilation imaging (SVI) is a functional magnetic resonance imaging technique capable of quantifying specific ventilation ― the ratio of the fresh gas entering a lung region divided by the region’s end-expiratory volume ― in the human lung, using only inhaled oxygen as a contrast agent. Regional quantification of specific ventilation has the potential to help identify areas of pathologic lung function. Oxygen in solution in tissue shortens the tissue’s longitudinal relaxation time (T1), and thus a change in tissue oxygenation can be detected as a change in T1-weighted signal with an inversion recovery acquired image. Following an abrupt change between two concentrations of inspired oxygen, the rate at which lung tissue within a voxel equilibrates to a new steady-state reflects the rate at which resident gas is being replaced by inhaled gas. This rate is determined by specific ventilation. To elicit this sudden change in oxygenation, subjects alternately breathe 20-breath blocks of air (21% oxygen) and 100% oxygen while in the MRI scanner. A stepwise change in inspired oxygen fraction is achieved through use of a custom three-dimensional (3D)-printed flow bypass system with a manual switch during a short end-expiratory breath hold. To detect the corresponding change in T1, a global inversion pulse followed by a single shot fast spin echo sequence was used to acquire two-dimensional T1-weighted images in a 1.5 T MRI scanner, using an eight-element torso coil. Both single slice and multi-slice imaging are possible, with slightly different imaging parameters. Quantification of specific ventilation is achieved by correlating the time-course of signal intensity for each lung voxel with a library of simulated responses to the air/oxygen stimulus. SVI estimations of specific ventilation heterogeneity have been validated against multiple breath washout and proved to accurately determine the heterogeneity of the specific ventilation distribution.
The overall goal of specific ventilation imaging (SVI) ― a proton magnetic resonance imaging (MRI) technique that uses oxygen as a contrast agent1 ― is to quantitatively map specific ventilation in the human lung. Specific ventilation is the ratio of fresh gas delivered to a lung region in one breath divided by the end expiratory volume of the same lung region1. In conjunction with measurements of local lung density, specific ventilation can be used to compute regional ventilation2. Measurements of local ventilation and ventilation heterogeneity that are provided by SVI have the potential to enrich the understanding of how the lung functions, both normally and abnormally3,4.
Specific ventilation imaging is an extension of the classical physiology test, multiple breath washout (MBW), a technique first introduced in the 1950s5,6. Both techniques use gas washin/washout to measure heterogeneity of specific ventilation, but SVI provides spatially-localized information while MBW provides only global measures of heterogeneity. In MBW, a mass spectrometer is used to measure the mixed expired concentration of an insoluble gas (nitrogen, helium, sulfur hexafluoride, etc.) over many breaths during a washout of that gas, as depicted in Figure 1. Along with the expired volume per breath during the washout period, this information can be used to compute the overall distribution of specific ventilation in the lung. In SVI, an MRI scanner is used to measure the T1-weighted signal ― which is a surrogate for the amount of oxygen in solution in lung tissue, a direct indicator of local oxygen concentration ― in each lung voxel over many breaths during several washin/washouts of oxygen. In a way that is directly analogous to MBW, this information allows us to compute the specific ventilation of each lung voxel. In other words, the technique performs thousands of parallel MBW-like experiments, one for each voxel, during an SVI experiment. Indeed, the spatial maps of specific ventilation thus produced can be compiled to recover the specific ventilation heterogeneity output of MBW. A validation study7 showed that the two methodologies produced comparable results when performed in series on the same subjects.
Other imaging modalities exist that, like SVI, provide spatial measures of ventilation heterogeneity. Positron emission tomography (PET)8,9, single-photon emission computed tomography (SPECT)10,11, and hyperpolarized gas MRI12,13 techniques have been used to create a substantial body of literature regarding the spatial pattern of ventilation in healthy and abnormal subjects. In general, these techniques have at least one distinct advantage over SVI, in that their signal-to-noise ratio is characteristically higher. However, each technique also has a characteristic disadvantage: PET and SPECT involve exposure to ionizing radiation, and hyperpolarized MRI requires the use of highly specialized hyperpolarized gas and a MR scanner with non-standard multi-nuclei hardware.
SVI, a proton-MRI technique, typically uses 1.5 Tesla MR hardware with inhaled oxygen as a contrast agent (both elements are readily available in healthcare), making it potentially more generalizable to the clinical environment. SVI leverages the fact that oxygen shortens the longitudinal relaxation time (T1) of lung tissues1, which in turn translates to a change in signal intensity in a T1-weighted image. Thus, changes in the concentration of inspired oxygen induce change in signal intensity of appropriately timed MRI images. The rate of this change following an abrupt change in inspired oxygen concentration, typically air and 100% oxygen, reflects the rate at which resident gas is replaced by the inhaled gas. This replacement rate is determined by specific ventilation.
As SVI involves no ionizing radiation, it has no contraindications for longitudinal and interventional studies that follow patients over time. Thus, it is ideally suited for studying disease progression or evaluating how individual patients responds to treatment. Due to its relative ease and safe repeatability, specific ventilation imaging is, in general, an ideal technique for those who wish to study large effects and/or a large number of people over time or in several different clinical locations.
Following the original publication describing the technique1, specific ventilation imaging (SVI) has been used in studies focused on the effect of rapid saline infusion, posture, exercise, and bronchoconstriction2,3,4,14,15. The technique’s ability to estimate whole lung heterogeneity of specific ventilation has been validated using the well-established multiple breath washout test7 and more recently, a regional a cross-validation was performed, by comparing SVI and hyperpolarized gas multiple breath specific ventilation imaging16. This reliable and readily deployable technique, capable of quantitatively mapping specific ventilation in the human lung, has the potential to significantly contribute to early detection and diagnosis of respiratory disease. It also presents new opportunities to quantify regional lung abnormalities and follow changes induced by therapy. These changes in region-specific lung function, which SVI enables us to measure for the first time, have the potential to become biomarkers for assessing the impact of drugs and inhaled therapies, and could be an extremely useful tool in clinical trials.
The purpose of this article is to present the methodology of specific ventilation imaging in detail and in a visual form, thus contributing to the dissemination of the technique to more centers.
The University of California, San Diego Human Research Protection Program has approved this protocol.
1. Subject Safety and Training
2. Preparation of the MRI Environment
3. Instrumenting and Preparing the Subject for Imaging
4. MRI Imaging
5. Creating a Specific Ventilation Map from a Time Series of Images
6. Combining Specific Ventilation and Density Maps to Compute Regional Alveolar Ventilation
Single slice SVI in a healthy subject
Specific ventilation imaging produces quantitative maps of specific ventilation as shown in Figure 3A, which depicts a single slice in the right lung of a 39-year-old healthy female. Note the presence of the expected vertical gradient in specific ventilation; the dependent portion of the lung presents higher specific ventilation than the non-dependent portion of the lung. A histogram of the mapped specific ventilation values is presented (Figure 3B, filled circles) along with a best-fit log-normal probability distribution function (dotted line). The width of the best-fit distribution can be used as a metric of specific ventilation heterogeneity7,23. Figure 1 shows a multiple breath washout acquired in the same subject, in the same posture. Figure 1A shows the temporal recording of nitrogen concentration measured at the mouth following a shift from inspired air to inspired 100% oxygen. Figure 1B presents the distribution of specific ventilation, as estimated from the washout. For both SVI and MBW, the relevant variable is the width of the distribution, as measured here by the width of a log normal distribution fitted to the data (dotted line), was found to be 0.41, using SVI and 0.42 using MBW within the healthy normal range. Validation of SVI-estimated specific ventilation heterogeneity by comparison with MBW was performed in 10 subjects and the difference between techniques was found to be smaller than the MBW inter-test variability7. A spatial comparison with a hyperpolarized gas multiple breath specific ventilation imaging16 also showed reliable group estimates of specific ventilation heterogeneity (the width of the specific ventilation distribution over the 8 subjects studied were 0.28 ± 0.08 and 0.27 ± 0.10 for hyperpolarized 3He and specific ventilation imaging, respectively), despite higher than expected intra-subject variability (the standard deviation of the individual differences in width was 0.13)16.
Specific ventilation maps can also be used in conjunction with lung density maps to compute regional alveolar ventilation. To generate maps of alveolar ventilation, specific ventilation and density images must be spatially smoothed to minimize the potential minor misalignments between the two modalities.
Response to methacholine challenge in an asthmatic subject
SVI can be used to measure both lung-wide and regional responses to interventions such as exercise4, posture2, or medication3. As an example, Figure 4 depicts single-slice maps from the lung of a mild asthmatic female subject at baseline (Figure 4A), following bronchoconstriction with methacholine (Figure 4B), and after albuterol-assisted recovery (Figure 4C). Note the increased specific ventilation heterogeneity during the induced asthma event, and the presence of large patches of little to no specific ventilation (dark blue regions in the dependent portion of the lung). Also, note that ventilation increased paradoxically in some regions during bronchoconstriction (green-red regions).
Multi-slice SVI
Up to six (typically four), contiguous, 15 mm lung slices can be simultaneously imaged with SVI. Figure 5 depicts four contiguous right lung slices, covering ~70% of the right lung, in a moderate asthmatic male subject who had been withdrawn from his asthma medications for 24 hours.
Ventilation map
Provided lung density information was acquired in the same slice, and the breathing frequency is known, a fully quantitative ventilation map can be computed in units of mL/min/mL. An example of a map of ventilation is shown in Figure 6.
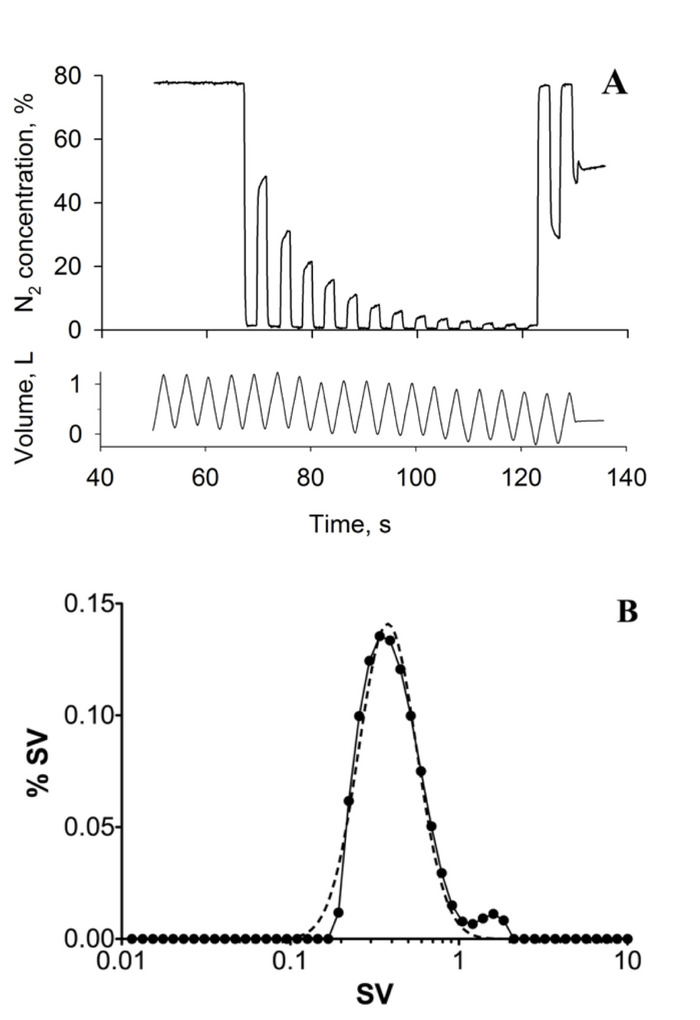
Figure 1: Multiple breath washout. (A) Typical MBW tracing showing expired nitrogen (N2) concentration (top) and tidal volume (bottom) over time (seconds, s). Data was acquired in the supine posture; the subject was a healthy 39-year-old female. (B) histogram depicting the distribution of specific ventilation (SV) computed from the MBW experiment using the method proposed by Lewis et al.23 (solid line). The dashed line represents the log(Gaussian) best fit to the specific ventilation distribution. The heterogeneity of specific ventilation, the key outcome, is measured as the width of the best fit distribution, in this case 0.42. This figure has been reprinted with permission from reference7. Please click here to view a larger version of this figure.
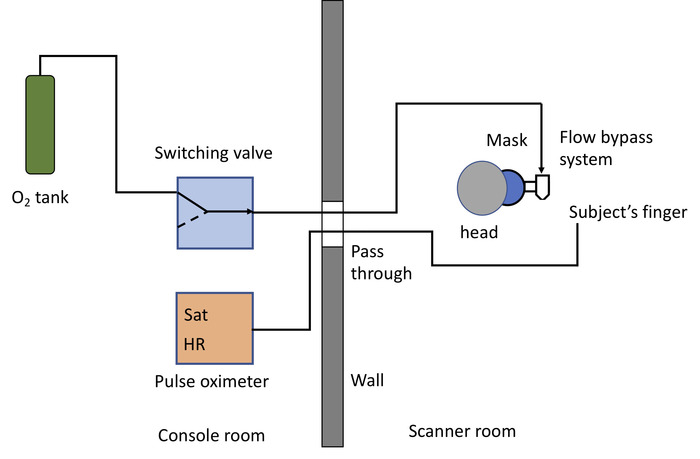
Figure 2: Diagram of the plumbing system and instrumentation. Specific ventilation imaging requires 100% medical oxygen, either from compressed gas tank (as drawn) or a wall outlet. The oxygen source is connected to a switch valve (control room), that in turn is connected, through the MRI pass-through, to the 3D printed flow bypass system24, attached to a facemask (scanner room). The left side of the drawing corresponds to the MRI control room, the right side to the scanner room. The plastic tubing connecting the tank to the switch is ¼ inch in diameter. The tubing from the switch valve outlet to the flow bypass system is also ¼ in. The last 2m include a step up in diameter, from ¼ inch to 3/8 inch, and then to ½ inch, in order to decrease the noise produced by the flow of air24. A pulse oximeter is used to monitor the subject’s heart rate (HR) and oxygen saturation (Sat) levels. Please click here to view a larger version of this figure.
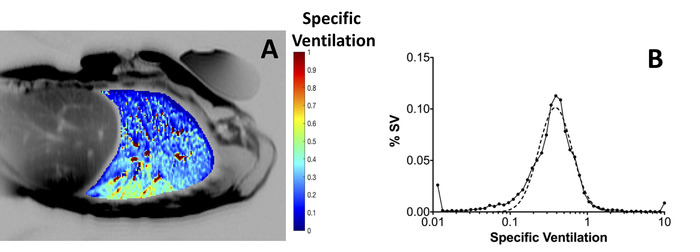
Figure 3: Specific ventilation imaging. (A) Typical map of specific ventilation (color), overlaid onto an anatomical MRI image of the same supine subject (gray scale). Specific ventilation ranges from very low values (blue) to SV = 1.0 (red). The subject, 39 year-old healthy volunteer (same subject as in Figure 1) was imaged in the supine posture. Note the vertical gradient in specific ventilation. A phantom of known MR characteristic used for calibration of absolute density was placed in the anterior chest wall. Phantoms are not required for SVI quantification. (B) Histogram of the distribution of specific ventilation (filled circles) compiled from the specific ventilation map. The width of the distribution represents the heterogeneity of specific ventilation in the lung slice studied. In this example, the distribution is unimodal and the width of the log Gaussian fitted distribution (dotted line) was 0.41; this is comparable to the MBW whole lung specific ventilation distribution presented in Figure 1B, for the same subject and posture, where the width of the distribution) was 0.42. Please click here to view a larger version of this figure.
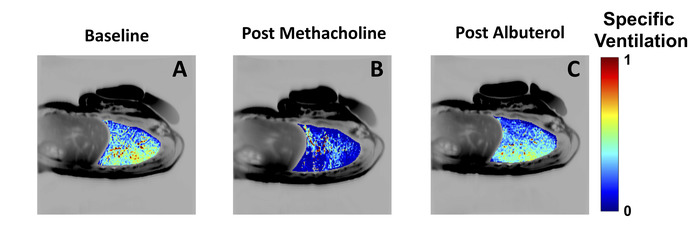
Figure 4: Bronchoconstriction and bronchodilation maps in a mild asthmatic. Specific ventilation measured in a mild asthmatic subject (female, age 24) at baseline (A), following inhalation of 1 mg/mL of methacholine (B) and following inhalation of albuterol (C). Note the significant changes in the distribution of specific ventilation following the induction of an asthma-like event using methacholine (panel B), with large regions of the dependent lung showing very low specific ventilation. Also note the recovery following bronchodilator administration (panel C). As in Figure 3, the specific ventilation maps have been overlaid into an anatomical MRI. The width of the specific ventilation distribution was 0.31 at baseline, 0.94 post methacholine, and 0.28 post albuterol. Please click here to view a larger version of this figure.
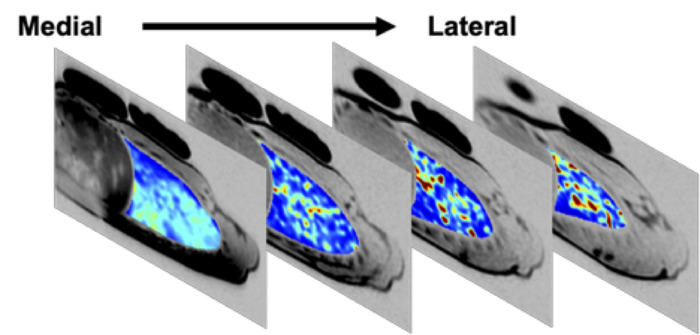
Figure 5: Multi slice specific ventilation map in a moderate asthmatic following 24-h medication withdrawal. Specific ventilation map of 4 contiguous lung slices in the right lung, acquired in a 25 year-old male moderate asthmatic after 24 h withdrawal of daily asthma medications. The 4 slices shown cover ~70% of the subject’s right lung. Regions of low specific ventilation (dark blue) are present in all slices. At baseline, FEV1 was 84% predicted. Following 24 h withdrawal of daily medications, this subject’s FEV1 was 69% of predicted; post-imaging, the subject used his rescue inhaler and FEV1 recovered to 83% of predicted. Please click here to view a larger version of this figure.
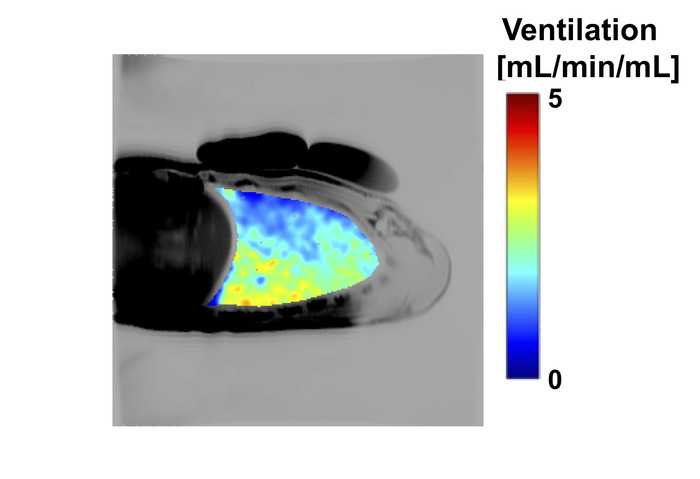
Figure 6: Example ventilation map showing ventilation (mL/min/mL) acquired in a healthy 27 year-old male subject. Ventilation maps were generated as described in section 6, using an SV map together with a map of lung proton density in the same slice. In this example, both the SV and density maps were smoothed using a log Gaussian kernel with a full width at half maximum of 5 voxels, resulting in a spatial scale of ~0.64 cm2 in plane. Please click here to view a larger version of this figure.
MRI parameters | SVI | Notes |
Echo time (TE) | 21.6 ms (single slice) | |
18.2 ms (multi slice) | ||
Repetition time (TR) | 5 s | Any value > 4 s |
Adjust for patient comfort | ||
Inversion time (TI) | 1.100 s (single slice) | For multi slice, TI of slice n |
1.100, 1.335, 1.570, 1.805 s (4 slices) | TI(n)=1.100 s + 0.235*(n-1) | |
Matrix | 256 x 128 (single slice) | |
128 x 128 (multi slice) | ||
Field of View | 40 cm | 32-44 cm |
Bandwidth | 125 kHz |
Table 1: List of typical MRI parameters used for acquisition of specific ventilation imaging.
Specific ventilation imaging allows quantitative mapping of the spatial distribution of specific ventilation in the human lung. Alternatives to SVI exist but are limited in some manner: Multiple breath washout provides a measure of heterogeneity but lacks spatial information23. Alternative imaging methods expose patients to ionizing radiation (e.g., SPECT, PET, CT, gamma scintigraphy) or are not widely available (hyperpolarized gas imaging using MRI). Specific ventilation imaging provides spatial information and can be performed using a standard clinical scanner and inhaled oxygen as the contrast source, and thus can be translated to nearly any clinical research setting. The fact that SVI does not require the use of radiation or contrast agents makes it well-suited for repeat or longitudinal studies that quantitatively evaluate regional responses to medication, therapy or interventions. This type of regional quantitative information on the impact of therapy may be especially useful in the context of inhaled drug delivery.
The disadvantages of SVI are that it has a relatively low signal-to-noise ratio (typically 4-7), it requires ~18 minutes to acquire and that it is somewhat laborious for the subject and the data analyst. Subject training is essential for acquisition of reliable specific ventilation data. The subject is typically trained, using a recorded soundtrack of the scanner noises, prior to the imaging session, so that he or she can reach a reproducible volume (FRC) for each of the 220 breath hold images. Ideally, this is achieved while breathing at a normal, comfortable tidal volume without hyperventilating. Imprecise breath holds must be accounted for in post-processing by the data analyst, who must use image registration software to account for differences in lung volume (section 5.3 above).
Since the technique’s original publication1, SVI has undergone a modification to streamline its implementation. A 3D-printed MR compatible flow-bypass system24 enabled near-instantaneous switching between delivery of room air and oxygen to the subject. This system significantly diminishes the complexity of the original setup, which resembled the gas-delivery setup previously described in a JoVE paper relating to perfusion imaging22. This, together with the ongoing development of free breathing acquisition techniques, will make move the technique closer to clinical research applicability.
As presented here, SVI has 2 main limitations: 1) the four slices (typically) of the right lung that are acquired represent only ~70% of the right lung – in its current implementation, no more than six slices can be acquired at 1.5T due to RF deposition leading to tissue heating; tissue heating increases at higher field strengths, further limiting multi-slice acquisition at 3T; and 2) SVI takes ~18 minutes to acquire, and thus the map of specific ventilation reflects each voxel’s time-averaged specific ventilation over this interval.
However, full lung coverage can be attained by repeating the procedure or by degrading spatial resolution, and scan time can be reduced at the expense of accuracy in specific ventilation quantification. The technique is, in general, versatile and different acquisition compromises are possible, each optimal for different applications. For example, in a study of dynamic recovery from an asthma event25, SVI data was analyzed at a higher temporal resolution (~7 min vs. ~18 min) and the same spatial resolution, at the cost of a ~ 30% increase in uncertainty of specific ventilation (estimated from Monte Carlo simulations). A recent modeling study26 sought to quantify the impact of several minor limitations of the SVI technique, namely 1) that the imaged volume does not encompass the entire right lung, 2) that small misalignments between successive images may exist even after registration, and 3) that pulmonary veins, by transporting blood from elsewhere in the lung into an imaged region, may add confounding signal that reflects ventilation in the region where that blood was originally oxygenated and not in the region in which it is being imaged. The study26 found that 1) in healthy subjects, a single-slice image (which encompasses only 8% of the total lung) estimates the vertical gradient of specific ventilation within 10% of its true value, 2) SVI analysis performed on modeled data purposefully misaligned, on average, by 9% (a worst case scenario, made worse by not discarding images with misalignments >10%) resulted in a ~20% underestimation of mean specific ventilation, an underestimation likely driven by the fact that mixing fast and slow equilibrating units will likely results in a bias towards the slower, low specific ventilation ones, and 3) pulmonary venous signal leads to systematic overestimation of the specific ventilation by less than 10%.
The ability to produce functional images of the human lung – as opposed to inferring function from anatomical changes – has the potential to contribute to early diagnosis and increase the understanding of the lung in health and disease. In particular, the ability to produce repeatable and quantitative regional maps of ventilation permits longitudinal studies of disease progression and allows quantification of the effect of interventions, such as inhaled asthma medications. By combining specific ventilation imaging with two MRI techniques to measure lung density21 and pulmonary perfusion (previously presented in this journal22), maps of the ventilation-perfusion ratio in health and disease can be generated2. As mismatch between ventilation and perfusion is a major cause of hypoxia and hypercapnia, regional information on the ventilation perfusion ratio in health and disease can provide further insight into the impact of lung disease.
The authors have nothing to disclose.
This work was supported by the National Heart, Lung and Blood Institute (NHLBI) (grants R01 HL-080203, R01 HL-081171, R01 HL-104118 and R01-HL119263) and the National Space Biomedical Research Institute (National Aeronautics and Space Administration grant NCC 9-58). E.T. Geier was supported by NHLBI grant F30 HL127980.
3D-printed flow bypass system | |||
Face mask | Hans Rudolph | 7400 series Oro-nasal mask, different sizes | |
Gas/oxygen regulator | |||
Mask head set | Hans Rudolph | 7400 compatible head set | |
Matlab | Mathworks | analysis software developed locally | |
Medical oxygen | Air Liquide/Linde | Oxygen to be delivered to the subject | |
MRI | GE healthcare | 1.5 T GE HDx Excite twin-speed scanner | |
Plastic tubing | ¼”, 3/8” and 1/2” tubing and connectors | ||
Pulse oximeter | Nonin | 7500 FO (MR compatible) | |
Switch valve | |||
Torso coil | GE healthcare | High gain torso coil for GE scanner |