C. elegans is an ideal model organism for studying morphology of different tissues and organelles due to its simplicity, known cell lineage, transparency, and available tools. Here, we provide quantitative approaches for studying organelles (e.g., mitochondria) and tissues, including synapses and muscles using live fluorescence imaging and free bio-image processing software.
Strict regulation of MEC-17 expression is required for normal synapse development
To further understand the function of the alpha-tubulin acetyl-transferase MEC-1714,15,16 in the nervous system, we studied synaptic morphology in the touch receptor neurons in C. elegans overexpressing the protein17. These cellular structures are essential for neuron function as they allow signals to be passed on to neighboring neurons. Images of the PLM synapse were collected using a laser scanning confocal microscope and quantitative morphology analysis was performed using accessible bio-image processing software (Figure 1A,B). The overexpression of MEC-17 results in significant reductions in the area of pre-synaptic accumulations in PLM and reduced relative integrated fluorescence intensities of the SNB-1::GFP marker (Figure 1C,D). Together, these results suggest that overexpression of MEC-17 disrupts normal synapse development in the PLM touch receptor neurons.
The size of the presynaptic site and relative integrated fluorescence were studied using the free bio-image processing software CellProfiler3.1.5. Due to their complex structure, synapses were defined by hand using the diffuse tagRFP protein expressed from the uIs115(Pmec-17::tagRFP) transgene. The area of the defined synapse was calculated by the number of pixels within the defined region. Compared to the wild-type control, animals overexpressing MEC-17 have significantly reduced pre-synaptic regions (P = 0.0025; n ≥ 10) (Figure 1C). In addition, to study synaptic integrity, relative integrated fluorescence intensity levels were compared. This was calculated by measuring integrated fluorescence intensity levels within the defined synapse for both SNB-1::GFP and the diffusible tagRFP. Subsequently, the SNB-1::GFP fluorescence values relative to tagRFP values were compared for which a significant decrease (P = 0.0479; n ≥ 10) was observed with the overexpression of MEC-17 (Figure 1D). Together, these results suggest that the correct regulation of MEC-17 is important for synapse development.
Quantitative measurement of body wall muscle cell area and fiber length reveals significant defects as a result of mutations in CMT2-related genes
Mutation in the genes MFN2, DNM2 and KIF5A have been shown to cause Charcot-Marie-Tooth type 2 (CMT2), an axonal form of the most common inherited peripheral neuropathy18,19. CMT2 is commonly associated with slowly progressive distal muscle weakness and atrophy, distal sensory impairment, foot deformities and secondary steppage gait. As a result, patients often suffer debilitating lifelong mobility impairments. There is currently no cure for the disease, partly due to genetic and clinical heterogeneity associated with CMT219, as well as a lack of animal models to study disease pathophysiology. Hence, using animal models to understand the underlying cellular defects can provide answers to the unknown CMT2 disease mechanisms.
Thus far, published studies evaluating body wall muscle defects in C. elegans have relied on visual scoring rather than quantitative measurements20. In order to avoid subjective bias that can occur during qualitative assessment, quantitative measurements of body wall muscle area and myosin fiber length were trialed using available image processing programs. We used these methods to assess muscle morphology in animals carrying mutations in the fzo-1/MFN2, dyn-1/DNM2 and unc-116/KIF5A genes in 3-day old adult C. elegans. For both measurements, a number of conditions were applied, such that at least a single complete oblique muscle cell was within view, muscle cells that were fuzzy or out of focus were excluded, and extreme anterior and posterior regions, as well as regions adjacent to the vulva were omitted. In addition to the mutations in the CMT2-associated genes, animals also carried the stEx30(Pmyo-3::gfp::myo-3 + rol-6(su1006)) transgene that labels a C. elegans myosin heavy chain subunit with GFP (Figure 2A-E). The simple polygon tool in Fiji software9 (version 2.0.0) was used to measure the area of a single muscle cell. If an animal experienced body wall muscle structure breakdown, leaving behind empty spaces within muscle cells, the ratio of gap area to total single muscle cell area was calculated and compared to wild-type control (Figure 3A). To obtain measurements of myosin fiber length, each image was first segmented using ilastik software10 (version 1.3.0) (Figure 3B). Segmentation is a process that allows the individual muscle fibers to be classified and separated from unwanted sections such as the background. Following segmentation, the image was exported as an unassigned 8-bit binary image. Fiji (version 2.0.0) was next used to Skeletonize the binary image to filter out border pixels, leaving behind fragments representing the original fibers. The branch lengths of the Skeletons, or individual myosin filaments, were then analyzed in Fiji. Length measurements of 0 or more than 250 μm, which is the maximum reasonable length for a filament even with muscle stretching, were excluded. Altogether, between 2000 to 3000 myosin fiber lengths were measured. A summary of the segmentation workflow is shown in Figure 3B. Results from the quantitative analysis were further compared with visual scoring of body wall muscle defects, where 3-day old animals were categorized as defective or not-defective based on muscle structure integrity.
Defects in body wall muscle morphology were observed between 2.5 to 3.5 times higher in fzo-1(cjn020), dyn-1(ky51) and unc-116(e2310) animals than in wild-type animals during visual assessment (Figure 4A). Most animals with mutations in fzo-1 and unc-116 experienced conspicuous loss of muscle striations, large GFP clumping due to accumulation of cellular debris, and muscle fiber degeneration that left gaping space within muscle cells (Figure 2C,E). In contrast, while more than 60% of dyn-1 mutants were scored visually defective, the extent of defects was minimal compared to the other two genetic mutants. There was only slight loss of striations, no GFP aggregations and only minor muscle degeneration when compared to the other two mutants (Figure 2D and Figure 4A). As with other phenotypic scoring, the extent of the defects could not be considered, and a tendency for bias might cause a higher proportion of defects to be registered. Therefore, quantitative measurements of muscle cell area and fiber length would provide a more accurate representation of the extent of muscle defects than visual assessment alone. In line with the large gaps observed with visual scoring, the ratio of gap area to total single cell area was shown to be 5 to 6 times higher in fzo-1 and unc-116 mutant animals compared to the wild-type group, which only experienced negligible muscle structure breakdown (Figure 4B). The lack of structural collapse in dyn-1 mutants resulted in a non-significant, 3-fold increase in gap to muscle cell area ratio (Figure 4B). This also indicates that experimenter bias might be a factor contributing to the high proportion of defects assigned by qualitative assessment. Nevertheless, the small gaps decreased the average fiber length from 24 µm in wild-type to 22 µm in dyn-1 mutants (Figure 4C). The average fiber length was dramatically shorter in the fzo-1 and unc-116 mutants, correlating with the presence of larger gaps within degenerating muscle cells in these animals (Figure 2C,E and Figure 4C). These results are consistent with our recent findings studying the effects of mutating CMT2-asscoiated genes in C. elegans20. Moreover, they highlight the more precise assessment of muscle morphology using these quantitative methods compared to visual scoring alone, and provide evidence that fzo-1 and unc-116 are required for normal muscle morphology.
Quantitative measurements of mitochondrial morphology using SQUASSH object segmentation
To understand how the absence of mitochondrial fission affects mitochondrial morphology in C. elegans neurons, we performed quantitative analyses in the PLM mechanosensory neurons. DRP-1, the C. elegans orthologue of the mammalian Dynamin-related protein 1 (DRP1), controls mitochondrial fission, where upon activation is recruited from the cytosol to form a spiral around mitochondria, constricting and eventually severing both the inner and outer mitochondrial membranes21,22. We fluorescently labeled mitochondria with a tissue specific transgene in the PLM neurons, which have a long axonal process that can be readily visualized using epifluorescence microscopy. A loss of fission is hypothesized to disrupt overall mitochondrial dynamics, and therefore decrease the creation of newer, smaller mitochondria through a process known as budding23.
We performed SQUASSH segmentation to compare mitochondrial morphology in wild-type and drp-1 mutant animals. We analyzed the mitochondria from 6 PLM neurons per genotype, resulting in an n value of greater that 200 mitochondria for each. Schematic and representative images are shown in Figure 5A,B. We found that mutants lacking DRP-1 had larger and more elongated mitochondria (Figure 5B-F). Mitochondria in the drp-1 mutant background were 32% larger than wild-type (P = 0.0006, Figure 5C), and 14% more elongated (further from a perfect circle) (P < 0.0001, Figure 5D). For a more detailed assessment of the variance in size and shape, we plotted histograms for each measure, fitting the data to Gaussian distributions (Figure 5E,F). We found that for both size and circularity, mutants lacking the fission protein had a larger variance (p < 0.0001 for both), highlighted by the presence of larger and more elongated mitochondria/mitochondrial networks (see Figure 5Bii for examples). Overall, we found evidence to suggest that mutation of drp-1 causes a lack of fission within PLM neurons, resulting in larger and more elongated mitochondria. We also demonstrated that disruption of mitochondrial fission causes an increase in the variance of mitochondrial morphology.
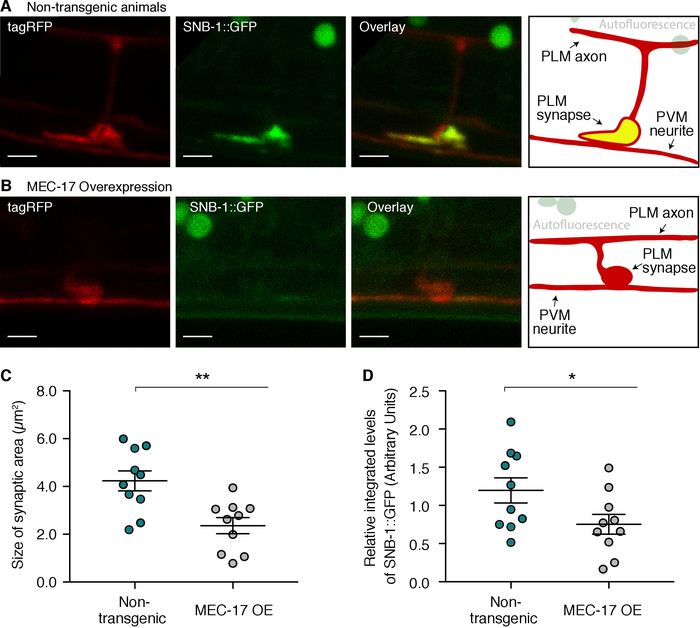
Figure 1: Quantification of synapse integrity in the PLM neurons. (A) Images are maximum z-projections of the PLM synaptic region in a non-transgenic animal. The left panel shows the PLM neuron labelled with tagRFP, the second panel displays the pre-synaptic region labelled with SNB-1::GFP, the third image is an overlay with co-localization represented in yellow, and the fourth panel is a schematic of the overlay image. (B) Maximum z-projection confocal images of the synaptic region in animals overexpressing MEC-17. Images are displayed as per panel A. (C) Size quantification of the pre-synaptic region in non-transgenic compared to transgenic animals overexpressing MEC-17. (D) Quantification of the relative integrated fluorescence levels of SNB-1::GFP in non-transgenics versus transgenic animals overexpressing MEC-17. For (C) and (D), individual synapses analyzed are represented by circles; n ≥ 10; mean ± S.E. shown in black. P values * < 0.05, ** < 0.01 from unpaired t-tests; scale bars represent 2 µm. Please click here to view a larger version of this figure.
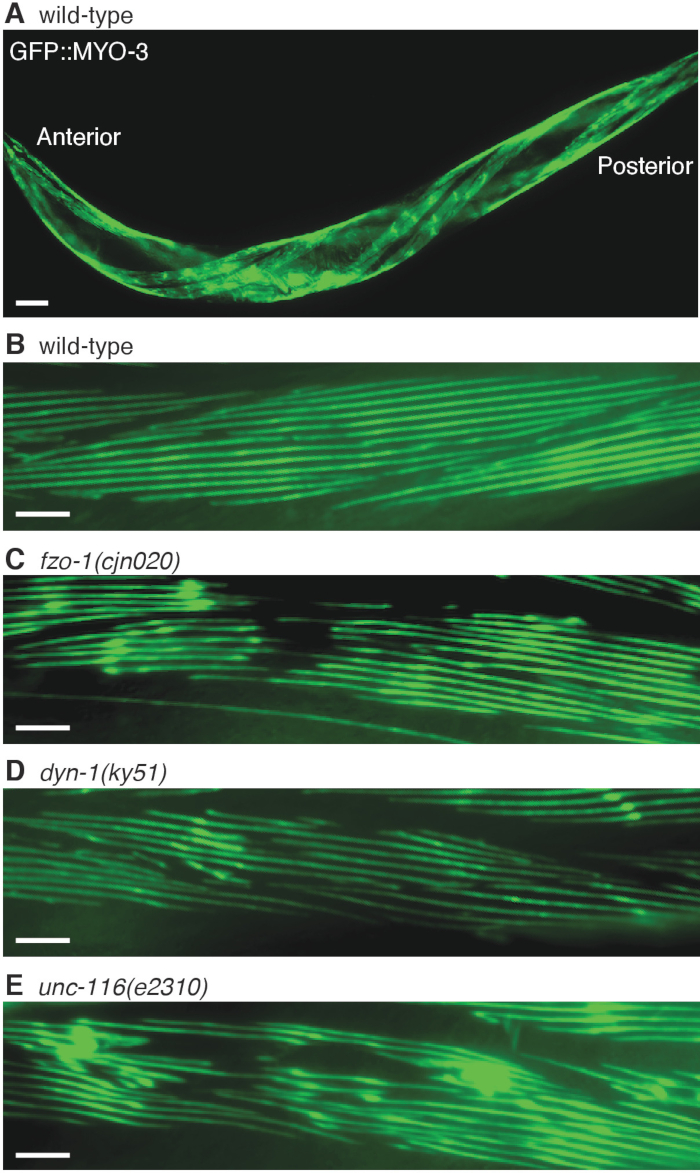
Figure 2: Visualization of the C. elegans body wall muscles. (A) An animal expressing the stEx30(Pmyo-3::gfp::myo-3 + rol-6(su1006)) transgene, which labels myosin heavy chain with GFP in the body wall muscles. The array also induces a rolling phenotype in the animal that facilitates visualization of the muscle cells arranged along the dorsal and ventral sides of the body. Representative magnified views of myosin fibers in (B) wild-type, (C) fzo-1(cjn020), (D) dyn-1(ky51) and (E) unc-116(e2310) animals. All animals were imaged at the 3-day old adult stage. Scale bar represents 60 µm in (A), and 30 µm in (B-E). Please click here to view a larger version of this figure.
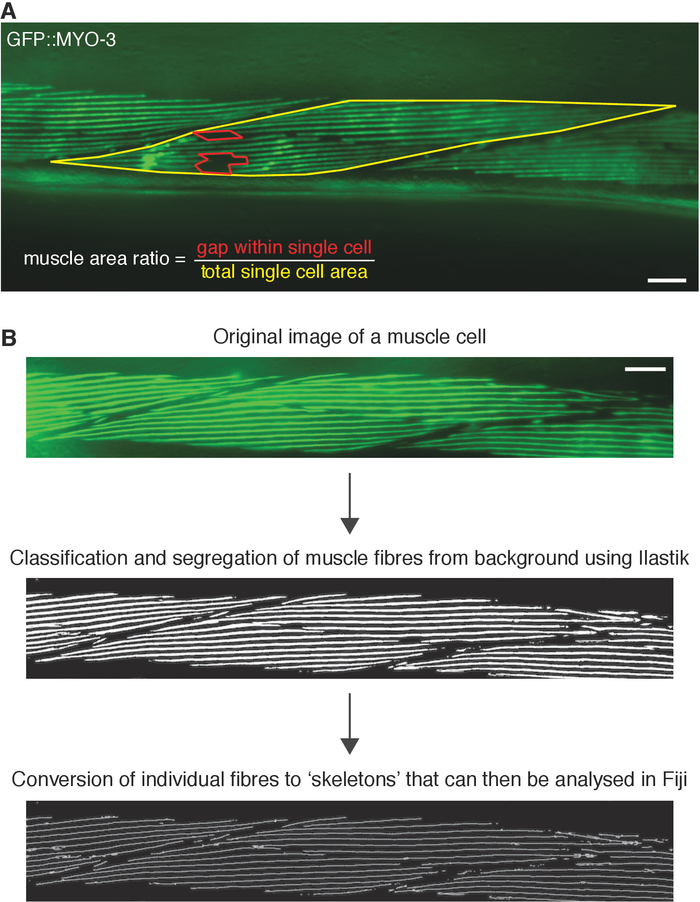
Figure 3: Measuring body wall muscle area and fiber length using available computational algorithms. (A) Example image demonstrating how the internal gap space within a single muscle cell (red-enclosed), and the area of the entire cell (yellow-enclosed) are drawn and calculated in Fiji to obtain the muscle area ratio. (B) Outline of segmentation protocol on a single example image using a combination of Fiji and ilastik. Scale bar represents 30 µm. Please click here to view a larger version of this figure.
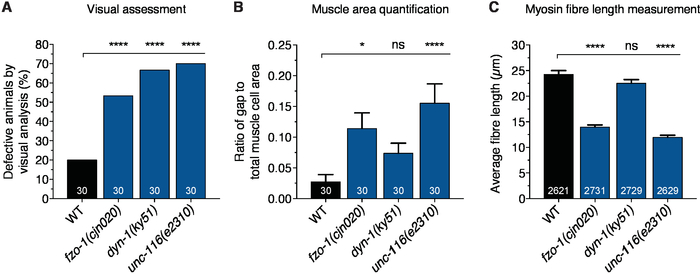
Figure 4: Qualification and quantification of body wall muscle defects. (A) Visual assessment of body wall muscle defects. (B) Comparison of blank space area to total muscle cell area ratio between WT and indicated mutants. (C) Measurement of myosin fiber length. For (B) and (C), only images with at least one complete visible oblique muscle cell were included for analysis. Fibers with length of 0 µm or longer than 250 µm were also excluded. Bars represent percentage defective animals in (A) and mean ± S.E.M. in (B) and (C); n values listed in each bar. Chi-square test with false discovery rate were performed to compare visual defects in (A), whereas one-way ANOVA with Dunnett’s post hoc tests for multiple comparison were used to analyze quantitative measurements in (B) and (C). *P < 0.05, ****P < 0.0001, ns = not significant. Please click here to view a larger version of this figure.
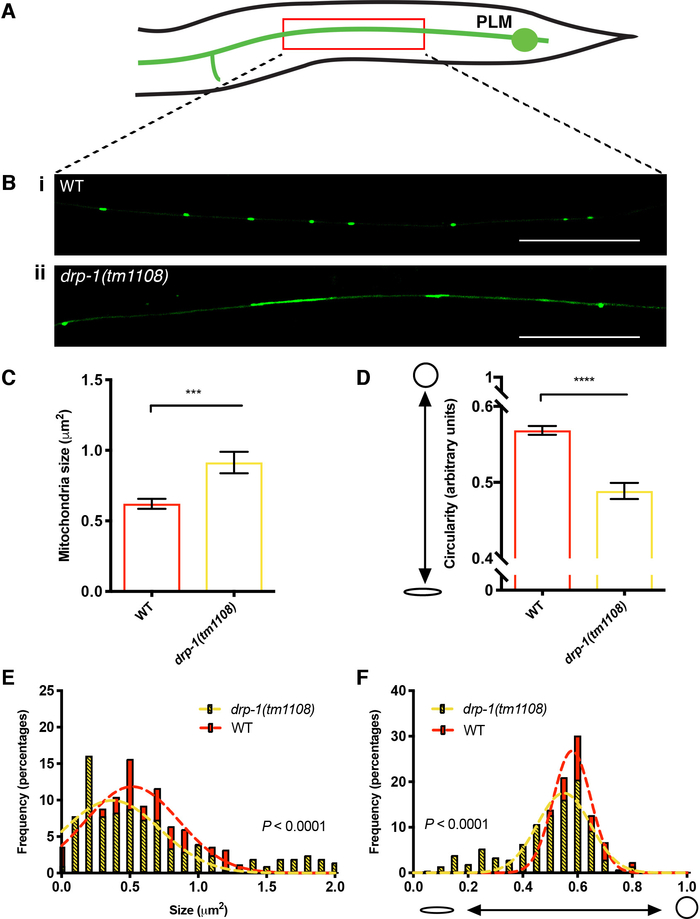
Figure 5: Mitochondrial morphology within the axons of the PLM neurons. (A) Schematic of a posterior lateral microtubule (PLM) mechanosensory neuron in the tail of C. elegans. The red box indicates the approximate location of the highlighted sections in (B), which show representative images of GFP labelled mitochondria (Pmec-4::MLS::GFP) within the PLM axon. Bright green puncta indicate mitochondria. Compared to the WT (i), drp-1(tm1108) mutants (ii) show larger, more elongated mitochondria. Images are representative of n = 6 PLM axons from 6 worms per genotype; scale bars = 15 μm. (C) Mean size (μm2) of individual mitochondrion as quantified by SQUASSH object segmentation in 3-day old adult (3DOA) worms. (D) Mean Circularity of individual mitochondrion within the PLM axon, as quantified from SQUASSH object measurements in 3DOAs. (E) Histogram and Gaussian distribution showing the variance of mitochondrial size. F test (P < 0.0001) shows that variances are significantly different between drp-1 and WT. (F) Histogram and Gaussian distribution showing the variance of mitochondrial circularity. Data is represented as mean +/- SEM. *** P < 0.001, **** P <0.0001 from Welch’s t-test; n ≥ 204 mitochondria for quantitative analysis from n = 6 worms. Please click here to view a larger version of this figure.
| Strain name | Genotype | Source | Reference # | ||
| BXN038 | uIs115(Pmec-17::tagRFP); jsIs609(Pmec-4::MLS::GFP) | Neumann lab | 7 | ||
| BXN366 | fzo-1(cjn020); myo-3(st386); zdIs5(Pmec-4::GFP); stEx30(Pmyo-3::gfp::myo-3 + rol-6(su1006)) | Neumann lab | 20 | ||
| BXN419 | drp-1(tm1108); jsIs609(Pmec-4::MLS::GFP); uIs115(Pmec-17::tagRFP) | Neumann lab | 7 | ||
| BXN507 | cjnEx036(Pmec-4::mec-17, Pmyo-2::mCherry); jsIs37(Pmec-7::snb-1::GFP); lin-15B&lin-15A(n765); uIs115(Pmec-17::tagRFP) | Neumann lab | 17 | ||
| BXN675 | unc-116(e2310); myo-3(st386); stEx30(Pmyo-3::gfp::myo-3 + rol-6(su1006)) | Neumann lab | 20 | ||
| BXN685 | dyn-1(ky51); myo-3(st386); stEx30(Pmyo-3::gfp::myo-3 + rol-6(su1006)) | Neumann lab | 20 | ||
| NM664 | jsIs37(Pmec-7::snb-1::GFP); lin-15B&lin-15A(n765) | Caenorhabditis Genetics Center | 6 | ||
| RW1596 | myo-3(st386); stEx30(Pmyo-3::gfp::myo-3 + rol-6(su1006)) | Caenorhabditis Genetics Center | 8 | ||
| TU4065 | uIs115(Pmec-17::tagRFP) | Martin Chalfie | 5 | ||
Table 1. List of C. elegans strains used in this study.
| PLM axon images | |
| Objective | 40x |
| Image resolution (per panel for tilescan) | 3224 x 3224 |
| Background removal window size | 20 |
| PSF xy | 0.78 |
| PSF z | 0.68 |
| Regularisation | 0.15 |
| Minimum fluorescence intensity of GFP | 0.4 |
Table 2. SQUASSH parameters for segmentation of mitochondria.
