We present here an improved protocol for the whole-mount preparation and immunostaining of Drosophila testes, suitable for confocal microscopy and also allowing reproducible and reliable labeling. We illustrate this protocol by 3D representation and quantification of colocalization experiments on the large S4-S5 spermatocytes.
Drosophila testes are a powerful model system for studying biological processes including stem cell biology, nuclear architecture, meiosis and sperm development. However, immunolabeling of the whole Drosophila testis is often associated with significant non-uniformity of staining due to antibody penetration. Squashed preparations only partially overcome the problem since it decreases the 3D quality of the analyses. Herein, we describe a whole-mount protocol using NP40 and heptane during fixation together with immunolabeling in liquid media. It preserves the volume suitable for confocal microscopy together with reproducible and reliable labeling. We show different examples of 3D reconstitution of spermatocyte nuclei from confocal sections. The intra- and inter-testes reproducibility allows 3D quantification and comparison of fluorescence between single cells from different genotypes. We used different components of the intranuclear MINT structure (Mad1-containing Intra Nuclear Territory) as well as two components associated with the nuclear pore complex to illustrate this protocol and its applications on the largest cells of the testis, the S4-S5 spermatocytes.
Drosophila testes are a valuable model for the study of nuclear architecture. In mitotic spermatogonial cells, the nuclear volume is largely occupied by chromatin. These cells undergo four rounds of division, producing a cyst of 16 primary spermatocytes. Over the next several days, the spermatocytes pass through 6 developmental stages (S1-S6), greatly increasing in volume, approximatively 20-fold1,2. They also change their nuclear morphology. The outline of the nucleus, revealed by the lamin Dm0, becomes irregular and shows deep invaginations1,3. This is accompanied by extensive gene expression changes and modifications in chromatin organization1,4,5,6,7. The interphase chromosomes are well-defined in stage S4-S5, forming three distinct masses corresponding to the 2 major bivalent autosomes and the X-Y pair docked with the nucleolus.
Mad1 was originally isolated as a key component of the mitotic checkpoint (reviewed in8). In interphase, it is described as located primarily at the nuclear envelope but also in the nucleoplasm9,10,11. In Drosophila testis, we reported that Mad1 is prominent in the nucleoplasm, intimately associated with the two major autosomal chromatin masses and to a lesser extent with the XY chromatin. We defined this chromatin-associated structure as MINT (Mad1-containing IntraNuclear Territory)12. Four other proteins were associated with MINTs in spermatocytes: the nucleoporin Mtor/Tpr, the SUMO peptidase Ulp1, the mitotic checkpoint protein Mad2 and a subunit of a Polycomb-like complex Raf212.
To complete the description of MINTs, we needed to use antibodies and were confronted with the technical problems generally encountered with immunostaining in testis: a poor permeability resulting in a significant non-uniformity of staining in the depth of the testis, particularly in the large spermatocytes. Squashed preparations increased antibody access but led to compressed images, restricting the 3D analyses, and preventing measurement of quantitative fluorescence, including colocalization. The problem of antibody penetration could also be addressed by permeabilizing agents such as 0.3% Na deoxycholate13, but this procedure did not in our hands yield reproducible results. Because we performed many co-labeling experiments, we looked to improve the permeabilization protocol. The combination of 1% NP40 plus heptane resulted in more reproducibility, particularly in studying the large spermatocytes.
This protocol performs fixation and immunostaining of testes in suspension, improving the sample quality as well as enhancing reproducibility, and rendering it suitable for confocal microscopy. We used the protocol to better define the spatial relationships of certain nuclear envelope proteins with the nucleoplasmic structures of large spermatocytes. This method will permit better investigations of the changes that accompany spermatocyte development, for example the dynamic structural changes of the nucleus including chromatin, nucleoplasm and the nuclear pores.
1. Drosophila testes collection
NOTE: Young males (0-15 h post-eclosion) are necessary for examining diploid germ cells (i.e., spermatogonia and spermatocytes).
2. Paraformaldehyde fixation
3. Antibody staining in solution
4. Colocalization analyses
The main obstacle to obtaining adequate staining of Drosophila testes is the limited penetrability of antibodies, which has been partially resolved by using squashed preparations but at the cost of inducing a restriction of the 3D analyses (for example 3D representation or measure of colocalization). The procedure permits uniform labeling and preserves the volume of all the cells of the testis. Here we have focused the illustration of the method on the 3D representation of S4-S5 spermatocytes, as they are the largest cells and thus more sensitive to deformation from squashing. We used different nuclear markers, including nucleoporins and the labeling of the intranuclear MINT domain (Mad1-containing Intra Nuclear Territory) described by the mitotic protein Mad112. As MINTs could be revealed by several different antibodies, we used them to test the robustness of the protocol for quantitative 3D colocalization, a method that necessitates a correct spatial resolution.
The protocol described above permits the acquisition of confocal images of sufficient quality to then be treated for 3D reconstitution. Four adjacent serial sections of a stage S5 spermatocyte are depicted in Figure 1A, showing a representative immunostaining of MINT (Mad1 immunolabeling using GFP booster in red) together with DAPI (in cyan). The chromosomes are organized into the characteristic 3 major distinct clusters and the MINT structure is shown in fine detail around the DNA, intimately associated with–but distinct from–the autosomal chromatin masses. The resolution also permits detection of the presence of Mad1 at the nuclear periphery as well as between the autosomal masses of chromosomes 2 and 3. We used Imaris software for the 3D representation. The nuclear surface was defined by the low level presence of Mad1 at the nuclear envelope (in grey) and MINT was defined by high level accumulation of Mad1 inside the nucleus (in red) together with DAPI staining (in blue) (Figure 1A). The 3D reconstitution movie well illustrates the volume and the relationship of Mad1 (at the nuclear envelope and in the MINT) together with the chromosomes in stage S4–S5 spermatocytes.
The distribution of nucleoporins has been only poorly described in these cells, probably due to the difficulty detecting them in these large misshapen nuclei. The distribution of Nup154 has only been reported once previously16 and Nup153 and Nup98 were only studied in the spermatogonia and small, early spermatocytes17. The 3D reconstitutions of large S5 spermatocytes stained by the nucleoporin Nup62 and by importin β (product of the ketel gene) were feasible and are represented in Figure 1C and Figure 1D, respectively. These nuclear pore-associated components appear non-uniformly distributed over the nuclear rim as dots of irregular size. For example, the importin β gathers around the autosomal chromatin similarly to where a lamin network has been already described3. This kind of distribution with pore-rich areas and large pore-free areas has been described by electron microscopy in rodent spermatocytes18. Understanding the changes in lamin and nucleoporin distribution would help to understand the nuclear envelope structure in these G2 cells just prior to male meiosis.
While conserving the 3D volume of the cells this protocol also permits antibodies to penetrate uniformly into the depth of every cell, allowing quantitative analysis such as colocalization. The Pearson correlation coefficient (PCC) is a well-established metric. It can range from +1 (denoting perfect positive correlation) to −1 (perfect negative correlation)19. To evaluate the localization of MINT partner proteins relative to Mad1 in spermatocytes, we have previously estimated the PCC on a single section of 0.5 µm using ImageJ in S5 spermatocytes12 (Figure 2A,B). We tested the protocol more deeply by using 3D colocalization on the whole nuclei instead of just a surface. The volume of the nuclei was defined by manual segmentation and the PCC was measured using the Colocation tool. We analyzed eight S5 spermatocyte nuclei, from the same testis or different testes. Figure 2B shows a 3D representation of a nucleus that served to measure the PCC. Figure 2D shows the measurement of the PCC on eight different S5 spermatocyte nuclei from three different testes. PCC values are not different, varying from 0.6 and 0.75, indicating a high value for colocalization. These are indistinguishable from the PCC defined on a single section. Thus, the procedure permits a reproducible uniform labeling and preserves a good volume of all the cells of the testis.
Because the protocol allows reliable measurement of colocalization from independent testes, it permitted comparison of staining from different fly genotypes. This was illustrated here by comparison of WT flies and flies RNAi depleted for Mtor (generated by expression of dsRNA UAS lines and the Bam-Gal4 driver that achieve substantial depletion in late spermatogonia and early spermatocytes20). As described for the colocalization experiments, Mtor-RNAi-depleted testes and wild types testes were dissected and fixed together and the confocal images were acquired under constant settings. Respecting these conditions, the comparison of individual cells becomes possible. We observed that the MINT is more affected than the nuclear envelope by the loss of Mtor as shown by representative Mtor RNAi-depleted (upper) and wt (lower) cells (Figure 3)12.
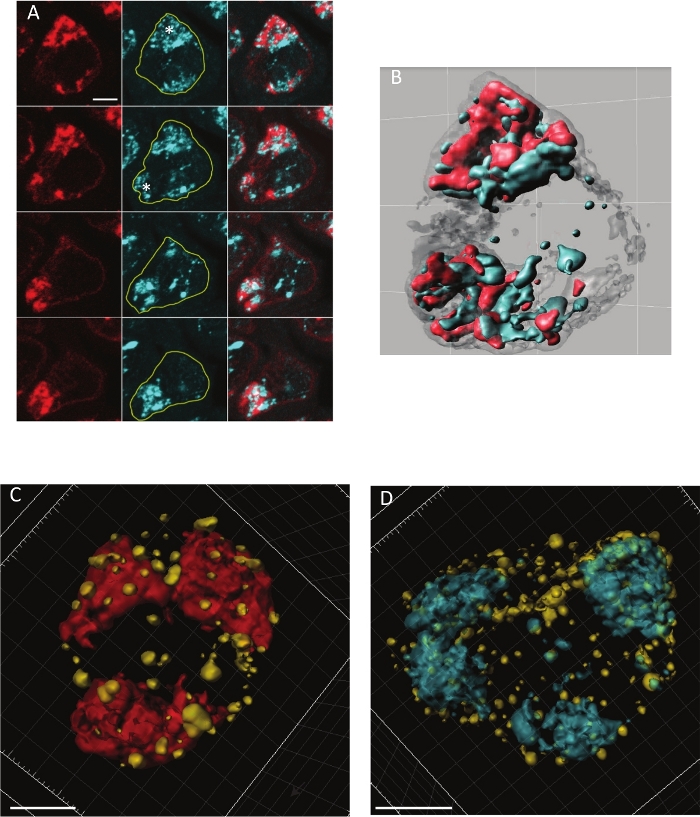
Figure 1: Illustration of immunostaining of Drosophila S4-S5 spermatocytes nuclei using different probes. (A) Images of a single stage 5 spermatocyte nucleus immunostained with α-GFP antibody (GFP booster) detecting the MINT structure by Mad1-GFP (red) together to DAPI staining (blue). It shows with precision the relationship between Mad1 and the two autosomal chromatin masses (represented as asterisks). Mad1 is also faintly detected at the periphery of the nucleus. All images are serial Z-projections of a stack of 3 (0.5 µm) successive confocal slices. Confocal images were acquired on a confocal microscope (63x, Plan Apochromatic oil DIC objective lens). Scale bars are 5 µm. (B) Frame from a movie rendering of the same spermatocyte nucleus. The nuclear surface was defined by low expression of Mad1 at the nuclear envelope (in greys) and MINT was defined by high expression of Mad1 inside the nucleus (in red). (A, B) Reprinted with permission from previously published figure (from12). (C) 3D image of a stage 5 spermatocyte nucleus with simultaneous immunostaining of Nup62 (yellow) and MINT (GFP booster in red). Scale bar is 4 µm. (D) 3D image of a stage 5 spermatocyte nucleus with simultaneous immunostaining of the importin-β Ketel (yellow) together with DNA (DAPI in blue). Scale bars are 5 µm. Please click here to view a larger version of this figure.
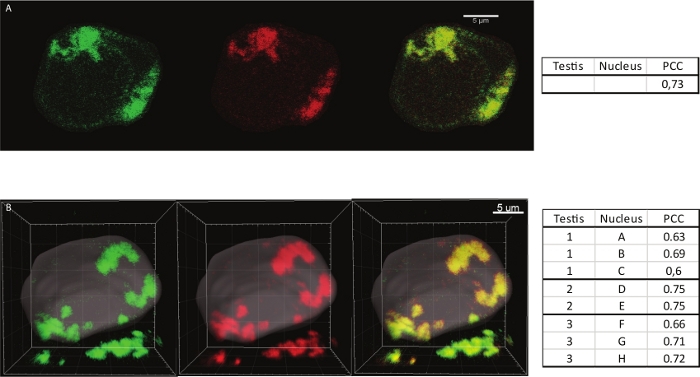
Figure 2: 2D and 3D Colocalization quantification of Mad1 together with Ulp1. (A) Merged images of a stage 5 spermatocyte nucleus immunostained with GFP booster antibody detecting Mad1 (green) and with anti-Ulp1 antibody (red) represented as a 1 µm thick stack of a spermatocyte nucleus. On the right is indicated the Pearson intensity correlation coefficient calculated using the Coloc-2 ImageJ plugin. The PCC was estimated to 0.73 (Reprinted with permission from Raich12). (B) Merged image of stage 5 spermatocyte nucleus (corresponding to nucleus G in the adjacent table) immunostained with GFP booster antibody detecting Mad1 (green) and with anti-Ulp1 antibody (red) represented in a 3D projection. The volume of the nucleus was defined by manual segmentation. On the right, the table lists the Pearson intensity correlation coefficients calculated on 8 different spermatocytes (A to H) from 3 different testes (1 to 3). Please click here to view a larger version of this figure.
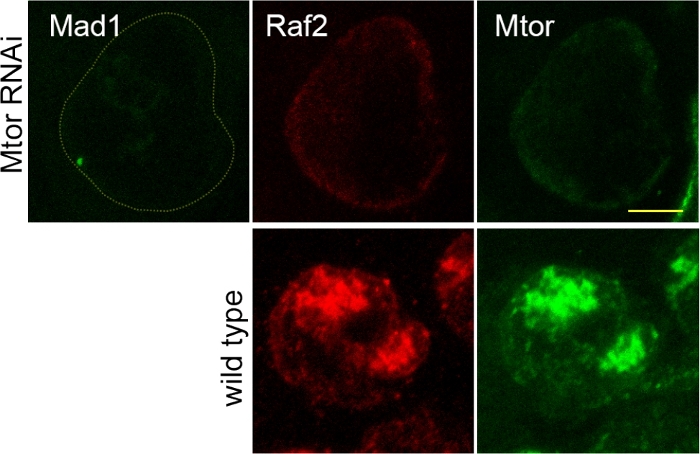
Figure 3: Immunofluorescence analysis of Mtor RNAi-treated spermatocytes compared to wild type. Cells depleted of Mtor using MtorRNAi (ID 110218) cells (upper panels) and wild type cells (lower panels) were stained for Mad1, Raf2 and Mtor proteins. The testes were fixed and stained together, mounted on the same slide and images acquired with the same parameters. The RNAi cells could be distinguished from WT by the absence or presence respectively of Mad1-GFP. The figure is representative of maximum projections of 4 x 0.5 µm stacks. Scale bar is 5 µm (Reprinted with permission from previously published figure in12). Please click here to view a larger version of this figure.
This protocol provides a method for successful immunolabeling of whole-mount adult Drosophila testes. As reported in other procedures young males must be used (we even shortened the age to less than 20 hours after eclosion) to minimize the presence of developing sperm, which risks obstructing the spermatocytes. The dissection should be rapid and the antibody dilution must be adjusted to optimize the signal-to-noise ratio21,22,23. Because using other protocols, we did not observe staining throughout the depth of the testis, we developed a fixation method combining PFA together with NP40 and heptane. We now routinely use 600 µL of 4% paraformaldehyde in PBS with 30 µL of 20% NP40 plus two volumes of heptane. This is critical to allow for sufficient permeabilization. Reducing the amount of NP40 to 10 µL visibly reduces the labeling. All the subsequent steps were carried out in suspension and the excess buffer was removed by allowing the testes to descend gently to the bottom of the tube by gravity. For the last step transferring samples to a slide, we rinse the tip in 0.1% PBS-T to prevent the testes sticking to the cone. According to observations, the immunohistological staining protocol works well with a variety of nuclear proteins, including the markers used here, as well as probes of epigenetic histone modifications, lamin and nucleoporins. We note that the protocol can also be used for larval testes, in which case the heptane should be omitted, as it makes the testes more difficult to recover intact.
The protocol is especially designed to maintain undamaged stacks of the spermatocytes together for an efficient and uniform labeling of the testis. We illustrated the protocol with the large late stage spermatocytes, whose misshapen nuclei make them among the most difficult cells to preserve. Furthermore, in these spermatocytes the nuclear labeling often becomes dilute probably because of the size of the nuclei. For example, it is commonly observed that DAPI or lamin labeling is stronger in the cells at the testis apex and becomes progressively weaker and more disperse as the spermatocytes are growing3,24. This also could be one of the reasons that the distribution of nucleoporins has only been described in earlier stage cells (spermatogonia and early spermatocytes)17.
Excellent images of immunostaining of Drosophila S5 spermatocytes have been published, particularly for the testis-specific t-BRD and dany proteins25,26 using either 0.3% sodium deoxycholate protocol or following squashing of the tissue21,22. In our hands, squashes lead to a significant non-uniformity of staining in the depths of the organ and as well sacrificing the 3D structure. Even if the use of 0.3% sodium deoxycholate gave better results, we still observed non-uniformity. Thus, we prefer NP40 for its reproducibility and quality of labeling. The confocal images permit reconstruction of 3D images for nuclear proteins. For example, we have successfully applied this method using many different probes, illustrated here by the intranuclear MINT domain, intimately associated with the autosomal chromatin masses and the nuclear pore network. Intriguing 3D distribution of nuclear pores of these spermatocyte nuclei is now available for further studies. The images permit reproducible quantification of colocalization from different spermatocytes from the same testis and from different testes. To our knowledge this is the first time that accurate quantification by Pearson correlation coefficient has been measured on such samples. It gives the confidence required for accurate immunolabelled protein levels comparison of different testes.
The authors have nothing to disclose.
We thank P. Verrijzer, J. Johansen H., Okhura for antibodies and A. Debec, the Bloomington and Vienna stock centers for flies. Thanks to C. Jackson for suggestions and stimulating discussions.
Drosophila srains | |||
ketelGFP y; ketelGFP/y+CyO | Gift from A. Debec (Institut Jacques Monod, UMR 7592, Paris, France) | ||
Mad1-GFP | J Cell Sci. 2011 May 15;124(Pt 10):1664-71. | ||
Mtor RNAi | VDRC | ID 110218 | Vienna Drosophila RNAi Center |
Materials | |||
DAPI | Thermo | D1306 | Stock solution must be prepared in H2O |
Dumont # 5 Fine Forseps | Fine Science Tools | ||
MBP Wide Bore Pipette Tips | Fisherbrand | 11917744 | Wide aperture tip |
Thermo Scientific 0.2 mL Individual Tube | Thermo | AB-0620 | |
2 ml micro centrifuge tubes | Sigma | T3531-200EA | Siliconized 2ml tube |
Citifluor AF1 | Citifluor | AF1 | |
Dakopen | Sigma | Z377821-1EA | |
Normal Goat Serum (NGS) | Sigma | NS02L-1ML | |
Paraformaldehyde 4% | Sigma | P6148-500G | Paraformaldehyde (4%) dissolved in PBS 1X ; aliquot by 600 ml |
PBS 1X | Thermo | 14190094 | DPBS, no calcium, no magnesium |
0.1% (0.2 or 0.3%) PBS-T | PBS 1X containing 0.1% (0.2 % or 0.3%) Triton X-100 | ||
Triton X-100, for molecular biology, | Sigma | T8787 | |
Antibodies | |||
GFP booster | Chromotek | gba488 | 1/200 |
Mouse anti-Mtor | 1/40 gift from J. Johansen, Iowa State University | ||
Rat anti-Nup62 | 1/200 gift from H. Ohkura (University of Edinburgh, UK | ||
Guinea-pig anti-Ulp1 | 1/200 gift from C. P. Verrijzer, Erasmus University, Rotterdam | ||
Rabbit anti-Raf2 | 1/200 gift from C. P. Verrijzer, Erasmus University, Rotterdam | ||
DyLight conjugated series | Thermo | 1/500 Donkey anti-(guinea-pig, mouse, rabbit or rat) as second antibodies |