Quantifying Tissue-Specific Proteostatic Decline in Caenorhabditis elegans
Summary
Proteostatic decline is a hallmark of aging, facilitating the onset of neurodegenerative diseases. We outline a protocol to quantifiably measure proteostasis in two different Caenorhabditis elegans tissues through heterologous expression of polyglutamine repeats fused to a fluorescent reporter. This model allows rapid in vivo genetic analysis of proteostasis.
Abstract
The ability to maintain proper function and folding of the proteome (protein homeostasis) declines during normal aging, facilitating the onset of a growing number of age-associated diseases. For instance, proteins with polyglutamine expansions are prone to aggregation, as exemplified with the huntingtin protein and concomitant onset of Huntington’s disease. The age-associated deterioration of the proteome has been widely studied through the use of transgenic Caenorhabditis elegans expressing polyQ repeats fused to a yellow fluorescent protein (YFP). This polyQ::YFP transgenic animal model facilitates the direct quantification of the age-associated decline of the proteome through imaging the progressive formation of fluorescent foci (i.e., protein aggregates) and subsequent onset of locomotion defects that develop as a result of the collapse of the proteome. Further, the expression of the polyQ::YFP transgene can be driven by tissue-specific promoters, allowing the assessment of proteostasis across tissues in the context of an intact multicellular organism. This model is highly amenable to genetic analysis, thus providing an approach to quantify aging that is complementary to lifespan assays. We describe how to accurately measure polyQ::YFP foci formation within either neurons or body wall muscle during aging, and the subsequent onset of behavioral defects. Next, we highlight how these approaches can be adapted for higher throughput, and potential future applications using other emerging strategies for C. elegans genetic analysis.
Introduction
Protein homeostasis (proteostasis) is defined as the cellular ability to maintain proper function and folding of the proteome. The inherent challenge to proteostasis is ensuring all proteins are properly folded and maintained in a native conformation, which is further amplified by the varied nature of protein size, amino acid composition, structural conformation, stability, turnover, expression, sub-cellular compartmentalization, and modifications1. Proteostasis is maintained through the coordinated action of a large proteostatic network, consisting of approximately 2000 unique proteins, which regulate proper synthesis, folding, trafficking, and degradation within the proteome2,3. The workhorse components of the proteostatic network are nine major families of molecular chaperones4. Every tissue and cell type preferentially utilizes specific subsets of molecular chaperones, presumably in alignment with the differing demands of distinct proteomes5.
One hallmark of normal organismal aging is the progressive decline and collapse of cellular proteostasis, which is thought to be an underlying basis for the onset and progression of a growing number of age-associated diseases. For instance, Alzheimer’s disease, Parkinson’s disease, Huntington’s disease, and Amyotrophic Lateral Sclerosis (ALS) share a common characteristic: in each case manifestation of neurodegeneration is driven by genetic alterations that predisposes a mutant protein to aggregation (amyloid-β/Tau, α-synuclein, HTT, FUS/TBD-43/SOD-1, respectively)6,7,8,9,10. During aging, the integrity and inducibility of the proteostatic network declines, which results in the accumulation of proteotoxic aggregates that result in cellular dysfunction and neurodegeneration. Of note, protein conformational diseases are not unique to neurons, and occur across multiple tissues, as highlighted by type II diabetes, multiple myeloma, and cystic fibrosis11,12,13,14. Therefore, elucidating mechanisms capable of preserving proteostasis will facilitate the development of targeted interventions for the treatment of disease and to promote healthy aging.
The small soil nematode Caenorhabditis elegans (C. elegans) has been instrumental in discovering genes and elucidating pathways that alter proteostasis. Many components of the proteostatic network and the signal transduction pathways that regulate proteostasis are evolutionarily conserved. Furthermore, C. elegans has reduced complexity and redundancy relative to vertebrate systems, making it more amenable to genetic analysis and gene discovery. Additional advantages of C. elegans that have led to it being widely used as a model system to study proteostasis include: powerful genetic and functional genomics, a short life cycle (3 days) and lifespan (3 weeks), a compact and well-annotated genome, the availability of a wide assortment of genetic mutants, and the ease of visualizing tissue-specific changes in cell biology using fluorescent reporters.
The progressive decay of proteostasis during aging can be easily quantified in C. elegans. The Morimoto laboratory first demonstrated that a polyglutamine expansion fused to yellow fluorescent protein (polyQ::YFP) could be used to quantify proteostatic decline in C. elegans during aging15,16,17,18. YFP fusions to 35 glutamine repeats or more result in an age-associated formation of fluorescent foci along with signs of cellular pathology. Of note, this range of glutamine expansion mirrors the length of the polyglutamine tract of the Huntingtin protein at which Huntington’s Disease pathology begins to be observed in humans (typically >35 CAG repeats)19. Strains with expression of polyQ::YFP within muscle, intestinal, or neuronal cells have been utilized to confirm that the age-associated decline of proteostasis occurs across different cell and tissue types. Muscle-specific polyQ::YFP expression (i.e., unc-54p::Q35::YFP) has been the most widely used tissue-specific reporter, as accumulating fluorescent foci are easy to quantify over the first few days of adulthood using a simple fluorescent dissecting microscope (Figure 1A-1B). Additionally, animals become paralyzed during mid-life, as the proteome within the muscle collapses due to the proteotoxic effect of the reporter (Figure 1C). Similarly, the age-associated decline in neuronal proteostasis can be followed (rgef-1p::Q40::YFP) by directly quantifying foci/aggregate formation and age-associated declines in coordinated body-bends after placing animals into liquid (Figure 2).
Here, we present a detailed protocol on how to measure the age-dependent progression of protein aggregate accumulation and the associated proteotoxicity induced by the expression of polyglutamine repeats within neuronal and muscle tissue in C. elegans. We provide examples of typical results generated using these strains and methods. Further, we show how we have utilized these methods to study transcriptional regulation of the proteostatic network. We discuss additional ways these reporters can be easily integrated with other existing reagents or adapted for larger screens.
Protocol
1. Preparation of reagents
- Select genes of interest to be inactivated via feeding-based RNAi. Purchase stocks of HT115 E. coli containing the RNAi clone of interest20. Alternatively, subclone the cDNA of the gene of interest into the multicloning site of the L4440 plasmid.
NOTE: To prevent degradation of dsRNA within the bacteria, use the HT115 strain. This is an RNase III-deficient E. coli strain with IPTG-inducible T7 polymerase activity. For proteostasis studies that do not use feeding-based RNAi, either HT115 or OP50 E. coli on standard NGM plates can be used. - Prepare 5 x 6 cm plates per test condition. For experiments using RNAi, induce dsRNA production in transformed HT115 E. coli. For studies without RNAi, OP50 E. coli on standard NGM plates can be used (See Supplemental File 1 for standard NGM and RNAi plate recipes).
NOTE: RNAi plates can be stored at 4 °C for several months before seeding with bacteria. - Grow cultures of E. coli overnight (16-20 h) at 37 °C in a shaking incubator at 220 rpm. Grow HT115 E. coli in Luria Broth (LB) with ampicillin (50 μg/mL).
NOTE: Standard OP50 E. coli is not antibiotic resistant, but streptomycin resistant variants are also available.- Concentrate bacteria by centrifugation at 2,400 x g for 15-20 min in a benchtop centrifuge, aspirate the supernatant, and re-suspend the pellet in 1/10th the starting volume (i.e., 10x concentration) of LB with ampicillin for HT115, or LB without ampicillin for standard OP50.
- Aliquot 200 µL of concentrated 10x bacteria to each plate (3-4 replicates per test condition, with 2 extra backup plates, to be used in the event of contamination).
- Allow open plates to dry in a clean environment such as a laminar flow bench until all liquid has been absorbed or allow covered plates to dry on a lab bench overnight.
- For seeded RNAi plates dried in a hood, store dried plates within a worm box overnight (up to 24 hours) at room temperature. After 1 day at RT, plates can be stored at 4 °C for up to 2 weeks in a sealed bag (to prevent plates from drying out). Before use, allow plates stored at 4 °C to return to room temperature within the zip-lock bag to prevent condensation from introducing airborne fungal contaminates.
- When using feeding-based RNAi, leave seeded HT115 bacteria on RNAi plates at room temperature for at least 12 hours prior to adding C. elegans. RNAi plates contain IPTG, which induces dsRNA production. Alternatively, IPTG can be added to the liquid cultures at the end of step 1.3.1, 2 hours prior to seeding.
- Avoid long-term storage of seeded HT115 plates at room temperature (greater than a few days) to avoid cracking of the agar that will cause C. elegans to burrow into agar.
2. Synchronization of C. elegans
NOTE: Choose whether to synchronize C. elegans by either alkaline hypochlorite treatment of gravid adults or egg lay.
- Synchronize animals by hypochlorite treatment of gravid adult animals to promote the release of embryos22.
- For hypochlorite treatment, wash gravid hermaphrodites 2 times with M9 buffer, then resuspend in 5 mL hypochlorite solution (3.25 mL of hypochlorite solution, 1 mL of M9 buffer and 0.75 mL of 5 M NaOH) for 5 min, shaking resuspended animals every minute. After 5 min, spin down animals and wash 3 times with M9 buffer.
NOTE: Hypochlorite treatment has been posited to affect proteostasis21. - After hypochlorite treatment, allow embryos to hatch overnight in 3 mL of M9 solution with rotation at 20 °C.
- Calculate the density of L1 animals (or alternatively, embryos) per µL by dropping 10 µL of L1 solution 3x onto a 6 cm plate and counting the number of L1 animals to calculate the average number of L1 animals per µL. L1 animals will settle over time. Therefore, periodically mix L1 solutions to avoid settling.
- Seed 50 L1 animals per plate, count and record the number seeded, and move plates to a 20 °C incubator. It is important to know the actual number of animals on each plate at the start of the assay.
NOTE: Synchronizing L1 animals by overnight hatching in M9 is routinely used as it minimizes developmental heterogeneity after placing animals onto food. However, synchronization occurs through developmental arrest in response to starvation cues, which for some studies should be avoided (see23 for additional discussion). As an alternative, roughly synchronized animals can be obtained through an egg-lay, see 2.2. - Freeze and store leftover L1 animals in liquid nitrogen or a -80 °C freezer. In this way, a sample of each strain at the time of the experimental setup is preserved, creating a valuable resource for future studies and improving reproducibility.
NOTE: See Supplemental File 1 for hypochlorite and M9 solution recipes.
- For hypochlorite treatment, wash gravid hermaphrodites 2 times with M9 buffer, then resuspend in 5 mL hypochlorite solution (3.25 mL of hypochlorite solution, 1 mL of M9 buffer and 0.75 mL of 5 M NaOH) for 5 min, shaking resuspended animals every minute. After 5 min, spin down animals and wash 3 times with M9 buffer.
- To synchronize animals via egg lay, place 20 young gravid adult animals (day 1 of adulthood) onto each plate for 4-6 hours, and allow them to lay eggs until there are approximately 50 eggs per plate. Remove all gravid adults and move plates with eggs to a 20 °C incubator.
NOTE: The gravid adult animals should be synchronized at the first day of adulthood. Older animals may lay eggs that have been retained in the uterus, causing the release of eggs that are in a more advanced developmental stage.
3. Progeny production
NOTE: Steps must be taken to either prevent progeny production or to separate the synchronized starting population from their progeny. Preventing progeny production can be achieved chemically with addition of 5-Fluoro-2'-deoxyuridine (FUdR) to plates, which is described here. Some studies have reported that FUdR can alter proteostasis24,25. Alternative approaches to prevent progeny production are discussed below.
- Make a 1000x stock solution of FUdR by dissolving 1 g of FUdR into 10 mL of ultrapure H2O. Filter sterilize stock FUdR with a 0.2 μm filter and a 10 mL syringe. Aliquot 1 mL of stock into a sterile 1.5 mL tube. Freeze and store at -20 °C.
- Grow animals at 20 °C until the L4 stage. N2 animals raised from synchronized L1s from hypochlorite treatment require approximately 40 hours of growth at 20 °C to reach L4. Growth rates for other strains should be empirically tested prior to experimentation. For details on how to accurately stage C. elegans see26.
- To each 6 cm plate with L4 animals, add 100 µL of 80x FUdR. It is critical to add FUdR at the L4 stage.
- Return plates to a worm box and put the box in a zip-lock bag. Return to appropriate incubator.
4. Measuring the decline in proteostasis in muscle tissue by using polyglutamine-expressing animals
NOTE: Two methods can be used to identify proteostasis decline in muscle cells: imaging the formation of protein aggregates during aging (4.1) and measuring the proteotoxicity these aggregates cause with age through the onset of paralysis (4.2).
- Imaging polyglutamine aggregate formation in the muscle during aging
NOTE: The age-dependent progression of protein aggregation in the muscle cells is imaged using polyglutamine (polyQ) repeats fused to a yellow fluorescent protein (YFP). This protocol outlines use of strain AM140 rmIs132[unc-54p::Q35::YFP], but other polyglutamine variant strains can also be used. The polyQ::YFP transgene is expressed in the muscle using the unc-54 muscle-specific promoter. Synchronized unc-54p::polyQ::YFP expressing animals are visualized at Day 1, 2, 3 and 4 of adulthood. To visualize unc-54p::polyQ::YFP aggregates, use a compound microscope equipped for fluorescence or a fluorescent dissecting microscope. AM140 is available from the Caenorhabditis Genetics Center (CGC) at: https://cgc.umn.edu/strain/AM140.- On imaging days (Day 1, 2, 3 and 4 of adulthood), pick 20 animals and mount on a microscope slide setup with a 3% agarose pad and a 5 μL drop of 10 mM sodium azide (diluted in M9 buffer).
- After all animals are immobilized by sodium azide (~ 5 minutes), image the whole bodies of the animals using a 10x magnification lens (Figure 1A). For imaging, use a FITC filter and the same exposure for every animal. Discard slides after imaging.
NOTE: Alternatively, YFP foci can also be quantified directly on plates, but movement must be inhibited by applying a stream of carbon dioxide onto the plate while scoring. This alternative method is most appropriate when screening a large number of conditions (see discussion for more details). - After acquisition of images, count the number of foci in the body wall muscles of the whole animal. Foci are brighter punctuated signals that can be differentiated from the dimmer soluble signal in the background.
- Plot the progression of YFP foci accumulation from days 1, 2, 3 and 4. Plot an XY graph where X represents days of adulthood and Y represents number of unc-54p::polyQ::YFP foci (Figure 1B). The number of foci in the experimental condition (e.g., gene downregulation or overexpression) is compared to control animals. Perform statistical analysis between the groups at each time point observed for each trial.
- When comparing foci counts for only two conditions, perform an independent sample t-test at each time point.
- When comparing foci counts for more than two conditions, perform an omnibus one-way ANOVA analysis for each time point, including the data for all the conditions at that time point. If the omnibus ANOVA yields a significant p-value (i.e., p < 0.005), perform a post-hoc analysis with pairwise independent sample t-tests to determine the specific conditions between which a significant difference in foci was detected (e.g., for groups A, B, and C compare A & B, A & C, and B & C).
- Measuring animal paralysis rates as a surrogate for polyglutamine toxicity in muscle cells
NOTE: The age-dependent increase of polyQ aggregates in muscle causes the decline of muscular function that drives locomotion. This defect in locomotion can be determined by measuring the progressive rate of paralysis in polyQ-expressing animals. For the paralysis assay, synchronized unc-54p::polyQ::YFP expressing animals are scored at Day 3, 5, 7 and 9 of adulthood. Add additional time points, as needed to extend the scoring range, such that you can assess the effect of genetic perturbation.- On scoring days (Day 3, 5, 7 and 9 of adulthood), look at the 6 cm plates containing 50 animals and record the number of paralyzed animals. Remove paralyzed animals from the plate. If animals have crawled off the plate, or have died, they should be censored; record the event so it can be accounted for in the analysis.
NOTE: An animal is considered to be paralyzed when no movement is observed after exposing them to light or gentle touch stimuli. Pharyngeal pumping activity is used to determine whether nonmoving animals are alive or dead. - At the completion of the experiment, calculate the paralysis rate for each condition. Do this at each time point by dividing the fraction of paralyzed animals by the total number of animals observed for that condition at that time. If observing multiple plates per condition per time point (i.e., replicate plates), calculate the ratio separately for each replicate.
- Plot the progression of paralysis rate in an XY graph (scatterplot). X represents days of adulthood and Y represents paralysis rates. The paralysis rate of unc-54p::polyQ::YFP animals is compared to control animals (Figure 1C). Perform statistical analysis between the groups; for multiple trials, treat trials independently. Use the Cox Proportional-Hazards Regression and the Wald test. Most data analysis tools that support survival analysis also support Cox modeling.
- Transform the data: each condition should have two columns, one for time, and another for “event”. At each time point observed, add a row with “0” for each paralyzed animal, and a “1” for each censored animal. The total number of rows should be equal to the number of starting animals on the plate for that condition.
- Perform Cox Proportional-Hazards modeling, followed by the Wald test, according to instructions for your statistical software. A univariate model will be appropriate for typical experiment designs. For more than two conditions, if a test with all conditions included indicates a significant result (i.e., p < 0.005), pairwise tests between conditions can be performed to determine the specific significant pair(s) of conditions.
NOTE: The Cox model relies on an assumption that the test condition(s) modulate the probability of an event proportionally over time. This means, for example, that the Cox model would not be appropriate for comparing a condition under which most animals are paralyzed at day 1 to a condition under which most animals are paralyzed at day 9. Extensions of the Cox model, and other approaches for comparing proportions paralyzed at each time point, are available for cases where the proportional hazards assumption does not hold, see27,28,29,30.
- On scoring days (Day 3, 5, 7 and 9 of adulthood), look at the 6 cm plates containing 50 animals and record the number of paralyzed animals. Remove paralyzed animals from the plate. If animals have crawled off the plate, or have died, they should be censored; record the event so it can be accounted for in the analysis.
5. Measuring the decline in proteostasis in neuronal tissue by using polyglutamine expressing animals.
NOTE: Two complementary methods are used to assay proteostasis decline in neurons (1) by quantifying the formation of protein aggregates (fluorescent foci) during aging and (2) by measuring age-associated decline in the neuronal proteome via a movement-based assay.
- Imaging polyglutamine aggregate formation in the neurons during aging
NOTE: Similar to the assay already discussed in muscle tissue, the age-dependent progression of protein aggregation in the neurons is imaged by expressing a polyQ::YFP fusion protein driven by the pan-neuronal tissue-specific promoter of rgef-1. Specifically we use AM101: rmIs110 [rgef-1p::Q40::YFP], a forty glutamine fusion to YFP16. To visualize rgef-1p::polyQ::YFP, use a compound microscope equipped for fluorescence with a 40x magnification lens. AM101 is available from the CGC at: https://cgc.umn.edu/strain/AM101.- On imaging days (Day 4, 6, 8 and 10 of adulthood), pick 20 animals and mount on a microscope slide containing a 3% agarose pad with a 5 μL drop of 10 mM sodium azide (diluted in M9 buffer).
- After all animals are immobilized by sodium azide (~ 5 minutes), take z-stack images of the head of the animals using a 40x magnification lens (Figure 2A). Discard slides after imaging.
- After acquisition of images, process z-stacks to obtain the maximum projection and use to quantify the number of foci in neurons located on the nerve ring area. Foci are brighter punctuated signals that can be differentiated from the dimmer soluble signal in the background.
NOTE: We specifically selected the nerve ring area to quantify rgef-1p::polyQ::YFP aggregates since this is the region where most neurons converge to make synaptic connections. However, in order to measure levels of aggregate formation in motor neurons, rgef-1p::polyQ::YFP aggregates located on the dorsal or ventral nerve cord can be quantified. - Plot the progression of YFP foci accumulation from D4, D6, D8 and D10. Do this on an XY graph where X represents days of adulthood and Y represents number of rgef-1p::polyQ::YFP foci (Figure 2B). The number of foci in the experimental condition (e.g., gene downregulation or overexpression) is compared to control animals. Statistical analysis of foci counts for neurons is done in the same manner as for muscle polyQ foci; see steps 4.1.4 and the associated notes.
- Measuring body bends as a surrogate measure of polyglutamine proteotoxicity in neurons.
NOTE: The proteotoxic stress induced from the progressive aggregate accumulation of neuronal polyQ is determined by looking at motor neuron defects through a thrashing assay. Quantify the number of body bends in a period of 30 seconds while suspended in M9 physiological buffer (Supplemental File 1).- On Day 2 of adulthood, pick 10 synchronized animals from the plate and place on a 10 μL drop of M9 buffer on a microscope slide. Repeat this step at least four times to get a sample of 40 or more animals.
- Video record the movement of the 10 animals placed on the microscope slide with 10 μL of M9 buffer for a period of 30 s on a stereomicroscope with a video-capable camera. Repeat this step 4 times for a total sample number of 40. Zoom and position should be adjusted such that all the animals are visible in the frame for the full 30 seconds.
- Once all the videos with the animals to be analyzed are recorded, play the video and score the body bends of each animal. One body bend is defined as when the vulva of the animal goes from one side to the opposite and all the way back to the starting position.
NOTE: We find wild type animals typically have 49 ± 0.79 body bends in 30 seconds. - Plot the number of body bends for each animal in a column graph where each dot represents the number of body bends in 30 s (Y axis) with the different conditions tested on the X axis. The number of body bends of unc-54p::polyQ::YFP animals is compared to control animals (Figure 2C). Perform statistical analysis between the groups independently for each trial; if the assay is repeated at multiple time points, analyze the data independently for each time point.
- When considering only two conditions, perform an independent-sample t-test.
- When considering more than two conditions at once, first perform an omnibus one-way ANOVA analysis, including the data for all the conditions at that time trial/time point. If the omnibus ANOVA yields a significant p-value (i.e., p < 0.005), perform a post-hoc analysis with pairwise independent sample t-tests to determine the specific conditions between which a significant difference in body bend count was detected.
Representative Results
In C. elegans, the polyglutamine repeat model has been instrumental for the identification of genes that regulate the proteostatic network. For instance, we previously showed that the homeodomain interacting protein kinase (hpk-1), a transcriptional cofactor, influences proteostasis during aging by regulating expression of autophagy and molecular chaperones31. We found that loss of hpk-1, either by RNAi silencing or in hpk-1(pk1393) null mutant animals, increases the number of Q35::YFP aggregates that accumulate during aging. Day 2 adult control animals display 18.0 ± 2.7 aggregates while the hpk-1(pk1393) null mutant and hpk-1 RNAi-treated Q35::YFP animals averaged 28 ± 5.3 and 26.0 ± 5.1 aggregates, respectively (Figure 3A-D). Similarly, by day 8 of adulthood, 77–78% of hpk-1(RNAi) and hpk-1(pk1393) animals were paralyzed while 50% of control Q35::YFP animals were paralyzed (Figure 3E). In addition, HPK-1 is sufficient to regulate protein aggregate formation as ubiquitous overexpression of hpk-1 reduces the number of Q35::YFP foci in muscle tissue and protects aging animals from Q35::YFP-associated paralysis during aging (Figure 3E). Collectively, these results demonstrate that HPK-1 regulates proteostasis and highlights how the polyQ::YFP model can be utilized for reverse genetic analysis of changes in proteostasis during aging.
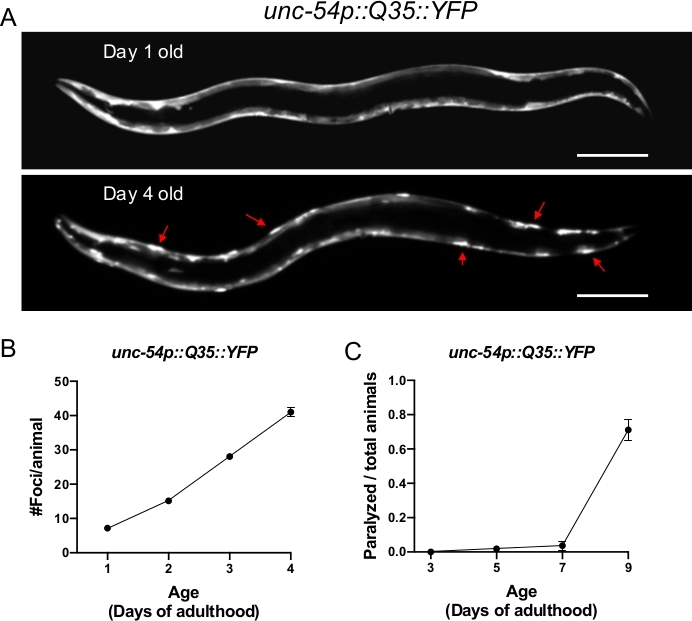
Figure 1: Expression of polyQ::YFP within C. elegans muscle results in progressive foci accumulation and paralysis during aging. (A) C. elegans unc-54p::Q35::YFP expression at days 1 and 4 of adulthood (upper and lower panel, respectively). Arrows indicate representative foci. (B) Quantification of fluorescent foci over the first 4 days of adulthood. Foci are resistant to FRAP15,32,33, consistent with an insoluble protein aggregate. Error bars represent standard error of the mean (SEM) (C) unc-54p::Q35::YFP animals become paralyzed during aging. Error bars represent standard error of proportion. Raw data for (B-C) is provided in Supplemental Table 1. The scale bar represents 100 μm in all panels. Please click here to view a larger version of this figure.
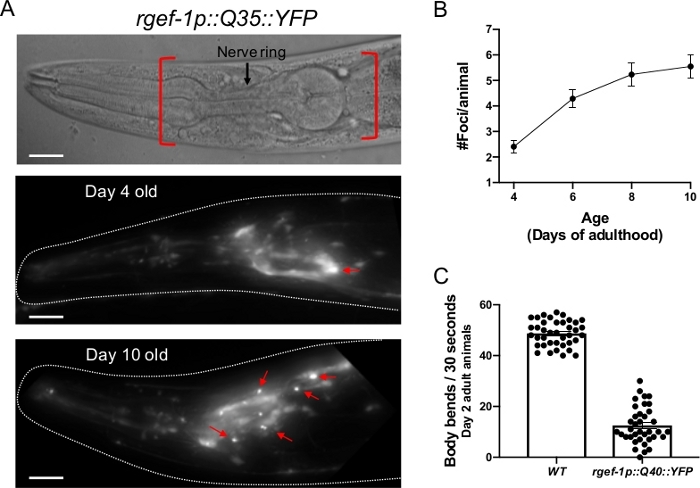
Figure 2: Expression of polyQ::YFP within C. elegans neurons results in progressive foci accumulation and disruption of normal body bends. (A, top) DIC image of the C. elegans anterior. The pharynx is a bi-lobed structure in the head of the animal, which is surrounded by the nerve ring, an interconnected cluster of 180 neurons. Red brackets indicate region to score for foci within head neurons. (A, middle) rgefp-1::Q40::YFP fluorescence at day 2 adulthood. Note that YFP expression is largely diffuse, with the exception of an occasional aggregate (arrow). (A, bottom) rgefp-1::Q40::YFP fluorescence at day 10 adulthood. Foci/aggregates are indicated (red arrow). (B) Quantification of fluorescent foci over the first 10 days of adulthood. Foci are resistant to FRAP15,32,33, consistent with an insoluble protein aggregate. Error bars represent standard error of the mean (C) Typical frequency of body bends of wild type and rgef-1p::Q40::YFP animals maintained at 20°C feeding on empty vector RNAi (L4440) at days 2 adulthood. Increased glutamine expansion correlates with movement defects15. Error bars represent standard error of the mean. Raw data for (B-C) is provided in Supplemental Table 1. The scale bar represents 20 μm in all panels. Please click here to view a larger version of this figure.
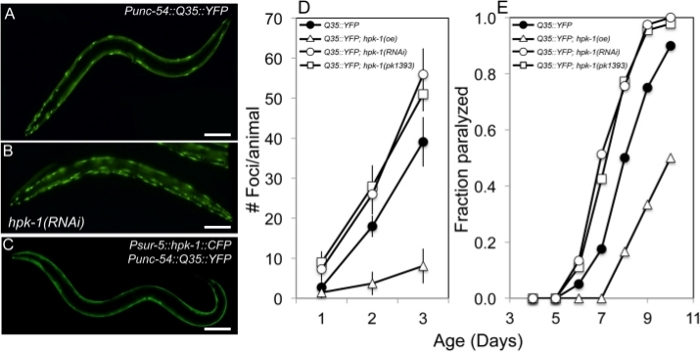
Figure 3: HPK-1 promotes proteostasis. (A-C) hpk-1 activity affects the accumulation of Q35::YFP foci in muscle cells. Shown are representative images of Punc-54::polyQ::YFP animals treated with (A) control RNAi or (B) hpk-1 RNAi, and (C) transgenic animals overexpressing hpk-1 (Psur-5::HPK-1::CFP). (D) Time course of polyQ::YFP foci accumulation in conjunction with: treatment with control RNAi (black circles), hpk-1 RNAi (white circles), hpk-1(pk1393) (white squares), or hpk-1 overexpression (open triangles). Data points display the mean ± standard deviation (S.D.) of at least 15 animals per biological replicate; at least 5 independent experiments were performed. (E) Time course of paralysis of Punc-54::polyQ::YFP animals in conjunction with: treatment with control RNAi (black circles), hpk-1 RNAi (white circles), hpk-1(pk1393) (white squares), or hpk-1 overexpression (open triangles). Plotted data display the results for a single representative trial. This figure is reprinted from reference31 with permission via a Creative Commons Attribution (CC BY) license. The scale bar represents 100 μm in all panels. Please click here to view a larger version of this figure.
Supplemental Table 1: Raw data of results. Table includes foci, paralysis, and body bend data from Figure 2 and Figure 3. Please click here to download this table.
Supplemental File 1: Common reagents for routine C. elegans work. Common reagents include recipes for preparing various types of plates and buffers. Please click here to download this file.
Discussion
Aging is characterized by a gradual decline in proteostasis. Proteostasis is maintained by a complex system, the proteostatic network, for the coordinated, dynamic, stress-responsive control of protein folding, degradation, and translation. Why proteostasis fails in the course of aging is poorly understood, but a decaying epigenome, declining inducibility of stress responses, and loss of compensatory crosstalk all coincide with this breakdown. In C. elegans, the transcriptional inducibility of multiple forms of stress response rapidly decline within a few hours after the onset of reproduction due to the formation of repressive chromatin marks at stress loci2,34,35. Proteostasis collapse is a massive clinical problem as it underlies the development of protein misfolding diseases. Thus, having a method suitable to genetic analysis to quantify cellular proteostasis in vivo is essential to gain deeper mechanistic insight into how organisms maintain proper folding and function of the proteome.
Transgenic C. elegans with tissue-specific expression of a polyglutamine fluorescent reporter are an effective and robust method to study age-dependent decline of proteostasis. The two most prominent benefits of the polyglutamine model are: (1) tissue-specific expression combined with powerful genetics and functional genomics allows discovery and characterization of proteostasis regulators in the context of an intact multicellular organism, and (2) visualization of foci formation permits direct quantification of age-associated proteostatic decline in vivo. While in many cases a correlation exists between aggregate accumulation and increased proteotoxicity, in some instances, these two phenotypes are negatively correlated. For example, decreased insulin signaling increases lifespan and stress resistance: daf-2 mutant animals (a hypomorphic loss of function in the insulin/insulin-like growth factor 1 receptor), show an increased aggregate load while improving proteostasis capacity by the upregulation of a protective mechanism that prevents the formation of toxic aggregate species33,36,37,38,39. Thus, in some cases aggregate formation is protective by sequestering harmful protein species from the rest of the proteome. Since readouts of cellular proteotoxicity can be assessed in conjunction with aggregate formation, one can test for inverse correlations to identify genetic interactions involved in protective sequestration mechanisms. Lastly, polyglutamine fluorescent reporters can be combined with either tissue specific knockdown (e.g., classically through tissue specific RNAi or RNA hairpin expression), and more recently through tissue-specific protein degradation, such as the Tir1-auxin system40– or with tissue-specific overexpression of a gene of interest using tissue-specific reporters, thereby gaining insight into regulation of proteostasis within and across cells and tissues.
Methods to measure changes in proteostasis during aging require chronologically matched animals. Thus, it is necessary to either prevent production of offspring or to separate starting animals. In the protocol, we outline how to use FUdR to prevent progeny production, but some studies have reported that FUdR can alter proteostasis24,25. Alternatively, feminized genetic backgrounds can be used (e.g., fer-15(b26);fem-1(hc17)41). Lastly, adult animals can be moved to fresh RNAi plates away from progeny. This simplifies background considerations at the expense of throughput. Periodically moving animals to fresh food has the additional advantages of renewing exposure to dsRNA and preventing possible starvation.
Because fluorescent foci are quantified through visual observation, one must be precise and consistent in the identification of foci. C. elegans polyQ::YFP foci have been experimentally verified to be in vivo protein aggregates via fluorescence recovery after photobleaching (FRAP)15,32,33. Additional biochemical approaches can be used to assess protein aggregation42. It is important to note that by day 3 adulthood, early foci become larger and begin to accumulate what appear as satellite foci (analogous to moons around a planet). It is essential to decide before beginning whether to count these satellite foci as separate aggregates, or to be more conservative and consider the collective area as a single aggregate, and then to remain consistent when scoring throughout all experiments. We prefer the latter; it extends the dynamic range during which foci formation can be assessed, but even with these more conservative estimates, by day 4 – 5 there is an apparent plateau effect. In actuality proteostasis continues to decline, but foci are so numerous it is no longer possible to quantify the number accurately by eye. To improve reproducibility across biological trials, between individuals, and between laboratories, it is critical to define what is being scored as foci.
While we detail methods for simple reverse genetic approaches to test a limited set of conditions for changes in proteostasis using the unc-54p::Q35::YFP reporter, we have developed methods with higher throughput where changes in proteostasis can be quantified for up to 100 conditions (e.g., RNAi clones) simultaneously. This method involves the use of replica sets, which we have used extensively to quantify changes in lifespan after genetic perturbation. Briefly, independent samples derived from a large isogenic population are scored at each timepoint, rather than a single sample over time. This approach is easily adapted for assessing age-associated proteotoxic changes, such as paralysis (using the poly-Q::YFP with the muscle promoter) or body bends (via neuronal promoter). Replica set scoring in this manner entails adding liquid to the wells of a multi-well plate, which stimulates C. elegans to move. An analogous approach can be readily applied to foci formation within muscle cells. Previously, we identified 159 genes necessary for a normal (wild-type) lifespan or the increased lifespan of decreased insulin/IGF1 receptor mutant animals, and quantified changes in healthspan and lifespan. Of these, 103 gene inactivations result in a progeric phenotype, with animals showing one or more signs of premature aging43. In a secondary screen using the unc-54p::Q35::YFP reporter and a replica set scoring approach, we were able to identify approximately 50 progeric gene inactivations that produced accelerated foci formation (A.V.S. unpublished results), which subsequently facilitated focused mechanistic studies where we identified a critical role for both the Myc network of transcription factors and the transcriptional co-factor HPK-1 in maintaining proteostasis31,44. A detailed description of the replica set method can be found in23.
The methods described here for statistical analysis of polyQ foci across conditions focus on comparing conditions within each time point, however there may be cases where the trend across time is of more interest than a comparison at a single point. If it is possible to track individual animals over time, such as if animals are singled in wells of multi-well plates or microfluidic devices, a relatively simple repeated-measures ANOVA would be appropriate. However, most often animals are kept in bulk on petri plates, making such individual tracking infeasible, and thus different methods are needed. The polyQ aggregate count data is expected to be autocorrelated between time points (e.g., foci counts should only increase, making observations for a given condition not independent between time points), necessitating a statistical analysis approach which can appropriately handle correlated error, such as ARIMA.
Both foci formation and movement defects are well-defined and quantifiable molecular hallmarks of aging that are tractable to genetic and/or functional genomic analysis. For example, a forward genetic screen using C. elegans expressing Q35::YFP within muscle cells identified enhanced aggregation after loss of unc-30, a neuron-specific transcription factor that regulates the synthesis of the inhibitory neurotransmitter gamma-aminobutyric acid (GABA)32. The development of feeding-based RNAi in C. elegans also led to a period of gene discovery in proteostasis: a genome-wide RNAi screen of C. elegans expressing Q35::YFP identified approximately 340 genetic modifiers that either enhance or inhibit the proteostatic network and thus increase or decrease polyQ aggregation39,42.
While straightforward functional genomic screens revealed a core proteostatic network, these strains remain an invaluable phenotypic resource. Tissue-specific expression of polyglutamine fluorescent reporters in Caenorhabditis elegans is an ideal system in which established genetic and functional genomic tools can be applied via enhancer, suppressor, or synthetic screens to identify novel genetic interactions45,46. Cellular proteostasis, and the myriad physiological systems that operate either to preserve or to challenge overall protein homeostasis, is emerging as a complicated cell biological and endocrine picture. Proteostasis is not represented by a single biological pathway, protein complex, or organelle. Instead, proteostasis is the product of the mass action of multiple intricate and interdependent biological pathways, machines and systems, and is challenged by myriad environmental stressors. Future studies utilizing the polyQ::YFP model will be essential to unravel the complexity of how cells maintain proper function and folding of the proteome.
Divulgazioni
The authors have nothing to disclose.
Acknowledgements
We would like to thank past and present members of the Samuelson laboratory for their assistance in the refinement of this method and/or discussion that aided the development of this manuscript. Research reported in this publication was supported by the National Institute on Aging of the National Institutes of Health under Award Numbers RF1AG062593 and R21AG064519. The content is solely the responsibility of the authors and does not necessarily represent the official views of the National Institutes of Health. The funders had no role in study design, data collection and analysis, decision to publish, or preparation of the manuscript.
Materials
| 24 Well Culture Plates | Greiner Bio-One | #662102 | |
| 2 mL 96-well plates | Greiner Bio-One | #780286 | |
| 600 µL 96-well plates | Greiner Bio-One | #786261 | |
| 96-pin plate replicator | Nunc | 250520 | |
| Air-permeable plate seal | VWR | 60941-086 | |
| bacteriological agar | Affymetrix/USB | 10906 | |
| bacto-peptone | VWR | 90000-368 | |
| C. elegans RNAi clone library in HT115 bacteria- Ahringer | Source Bioscience | C. elegans RNAi Collection (Ahringer) | See also Kamath et. al, Nature 2003. |
| C. elegans RNAi clone library in HT115 bacteria- Vidal | Source Bioscience | C. elegans ORF-RNAi Resource (Vidal) | See also Rual et. al, Genome Research 2004. This library is also available from Dharmacon. |
| FuDR (5-Fluoro-2'-deoxyuridine) | Alfa Aesar | L16497 | |
| Glass microscope cover slips | VWR | 48404-455 | |
| Glass microscope slides | VWR | 160004-422 | |
| IPTG (isopropyl beta-D-1-thigalactopyranoside) | Gold Bio | 12481C100 | |
| Retangular non-treated single-well plate, 128x86mm | Thermo-Fisher | 242811 | |
| Sodium Azide, CAS #26628-22-8 | Sigma-Aldrich | S2002 | |
| Zeiss Axio Imager M2m microscope with AxioVision v4.8.2.0 software | Zeiss | unknown | |
| Zeiss StemiSV11 M2 Bio Quad microscope | Zeiss | unknown |
Riferimenti
- Wolff, S., Weissman, J. S., Dillin, A. Differential scales of protein quality control. Cell. 157 (1), 52-64 (2014).
- Labbadia, J., Morimoto, R. I. The biology of proteostasis in aging and disease. Annual Review of Biochemistry. 84, 435-464 (2015).
- Powers, E. T., Morimoto, R. I., Dillin, A., Kelly, J. W., Balch, W. E. Biological and chemical approaches to diseases of proteostasis deficiency. Annual Review of Biochemistry. 78, 959-991 (2009).
- Brehme, M., et al. A chaperome subnetwork safeguards proteostasis in aging and neurodegenerative disease. Cell Reports. 9 (3), 1135-1150 (2014).
- Sala, A. J., Bott, L. C., Morimoto, R. I. Shaping proteostasis at the cellular, tissue, and organismal level. Journal of Cell Biology. 216 (5), 1231-1241 (2017).
- Braak, H., Braak, E., Strothjohann, M. Abnormally phosphorylated tau protein related to the formation of neurofibrillary tangles and neuropil threads in the cerebral cortex of sheep and goat. Neuroscience Letters. 171 (1-2), 1-4 (1994).
- Poirier, M. A., Jiang, H., Ross, C. A. A structure-based analysis of huntingtin mutant polyglutamine aggregation and toxicity: evidence for a compact beta-sheet structure. Human Molecular Genetics. 14 (6), 765-774 (2005).
- Vilchez, D., Saez, I., Dillin, A. The role of protein clearance mechanisms in organismal ageing and age-related diseases. Nature Communications. 5, 5659 (2014).
- Eftekharzadeh, B., Hyman, B. T., Wegmann, S. Structural studies on the mechanism of protein aggregation in age related neurodegenerative diseases. Mechanisms of Ageing and Development. 156, 1-13 (2016).
- Pokrishevsky, E., Grad, L. I., Cashman, N. R. TDP-43 or FUS-induced misfolded human wild-type SOD1 can propagate intercellularly in a prion-like fashion. Scientific Reports. 6, 22155 (2016).
- Mukherjee, A., Morales-Scheihing, D., Butler, P. C., Soto, C. Type 2 diabetes as a protein misfolding disease. Trends in Molecular Medicine. 21 (7), 439-449 (2015).
- Sikkink, L. A., Ramirez-Alvarado, M. Biochemical and aggregation analysis of Bence Jones proteins from different light chain diseases. Amyloid. 15 (1), 29-39 (2008).
- Qu, B. H., Strickland, E., Thomas, P. J. Cystic fibrosis: a disease of altered protein folding. Journal of Bioenergetics and Biomembranes. 29 (5), 483-490 (1997).
- Qu, B. H., Strickland, E. H., Thomas, P. J. Localization and suppression of a kinetic defect in cystic fibrosis transmembrane conductance regulator folding. Journal of Biological Chemistry. 272 (25), 15739-15744 (1997).
- Brignull, H. R., Moore, F. E., Tang, S. J., Morimoto, R. I. Polyglutamine proteins at the pathogenic threshold display neuron-specific aggregation in a pan-neuronal Caenorhabditis elegans model. Journal of Neuroscience. 26 (29), 7597-7606 (2006).
- Gidalevitz, T., Ben-Zvi, A., Ho, K. H., Brignull, H. R., Morimoto, R. I. Progressive disruption of cellular protein folding in models of polyglutamine diseases. Science. 311 (5766), 1471-1474 (2006).
- Morimoto, R. I. Stress, aging, and neurodegenerative disease. New England Journal of Medicine. 355 (21), 2254-2255 (2006).
- Morimoto, R. I. Proteotoxic stress and inducible chaperone networks in neurodegenerative disease and aging. Genes & Development. 22 (11), 1427-1438 (2008).
- Walker, F. O. Huntington’s disease. Lancet. 369 (9557), 218-228 (2007).
- Kamath, R. S., Martinez-Campos, M., Zipperlen, P., Fraser, A. G., Ahringer, J. Effectiveness of specific RNA-mediated interference through ingested double-stranded RNA in Caenorhabditis elegans. Genome Biology. 2 (1), 0002 (2001).
- Karady, I., et al. Using Caenorhabditis elegans as a model system to study protein homeostasis in a multicellular organism. Journal of Visualized Experiments. (82), e50840 (2013).
- Porta-de-la-Riva, M., Fontrodona, L., Villanueva, A., Ceron, J. Basic Caenorhabditis elegans methods: synchronization and observation. Journal of Visualized Experiments. (64), e4019 (2012).
- Cornwell, A. B., Llop, J. R., Salzman, P., Thakar, J., Samuelson, A. V. The Replica Set Method: A High-throughput Approach to Quantitatively Measure Caenorhabditis elegans Lifespan. Journal of Visualized Experiments. (136), e57819 (2018).
- Angeli, S., et al. A DNA synthesis inhibitor is protective against proteotoxic stressors via modulation of fertility pathways in Caenorhabditis elegans. Aging (Albany NY). 5 (10), 759-769 (2013).
- Feldman, N., Kosolapov, L., Ben-Zvi, A. Fluorodeoxyuridine improves Caenorhabditis elegans proteostasis independent of reproduction onset. PLoS One. 9 (1), 85964 (2014).
- Byerly, L., Cassada, R. C., Russell, R. L. The life cycle of the nematode Caenorhabditis elegans. I. Wild-type growth and reproduction. Biologia dello sviluppo. 51 (1), 23-33 (1976).
- Schemper, M. Cox Analysis of Survival Data with Non-Proportional Hazard Functions. Journal of the Royal Statistical Society. Series D (The Statistician). 41 (4), 455-465 (1992).
- Royston, P., Parmar, M. K. The use of restricted mean survival time to estimate the treatment effect in randomized clinical trials when the proportional hazards assumption is in doubt. Statistics in Medicine. 30 (19), 2409-2421 (2011).
- Campbell, I. Chi-squared and Fisher-Irwin tests of two-by-two tables with small sample recommendations. Statistics in Medicine. 26 (19), 3661-3675 (2007).
- Busing, F. M., Weaver, B., Dubois, S. 2 x 2 Tables: a note on Campbell’s recommendation. Statistics in Medicine. 35 (8), 1354-1358 (2016).
- Das, R., et al. The homeodomain-interacting protein kinase HPK-1 preserves protein homeostasis and longevity through master regulatory control of the HSF-1 chaperone network and TORC1-restricted autophagy in Caenorhabditis elegans. PLoS Genetics. 13 (10), 1007038 (2017).
- Garcia, S. M., Casanueva, M. O., Silva, M. C., Amaral, M. D., Morimoto, R. I. Neuronal signaling modulates protein homeostasis in Caenorhabditis elegans post-synaptic muscle cells. Genes & Development. 21 (22), 3006-3016 (2007).
- Morley, J. F., Brignull, H. R., Weyers, J. J., Morimoto, R. I. The threshold for polyglutamine-expansion protein aggregation and cellular toxicity is dynamic and influenced by aging in Caenorhabditis elegans. Proceedings of the National Academy of Sciences of the United States of America. 99 (16), 10417-10422 (2002).
- Labbadia, J., Morimoto, R. I. Repression of the Heat Shock Response Is a Programmed Event at the Onset of Reproduction. Molecular Cell. 59 (4), 639-650 (2015).
- Shemesh, N., Shai, N., Ben-Zvi, A. Germline stem cell arrest inhibits the collapse of somatic proteostasis early in Caenorhabditis elegans adulthood. Aging Cell. 12 (5), 814-822 (2013).
- Ben-Zvi, A., Miller, E. A., Morimoto, R. I. Collapse of proteostasis represents an early molecular event in Caenorhabditis elegans aging. Proceedings of the National Academy of Sciences of the United States of America. 106 (35), 14914-14919 (2009).
- Walther, D. M., et al. Widespread Proteome Remodeling and Aggregation in Aging C. elegans. Cell. 161 (4), 919-932 (2015).
- Cohen, E., Bieschke, J., Perciavalle, R. M., Kelly, J. W., Dillin, A. Opposing activities protect against age-onset proteotoxicity. Science. 313 (5793), 1604-1610 (2006).
- Silva, M. C., et al. A genetic screening strategy identifies novel regulators of the proteostasis network. PLoS Genetics. 7 (12), 1002438 (2011).
- Zhang, L., Ward, J. D., Cheng, Z., Dernburg, A. F. The auxin-inducible degradation (AID) system enables versatile conditional protein depletion in C. elegans. Development. 142 (24), 4374-4384 (2015).
- Hansen, M., Hsu, A. L., Dillin, A., Kenyon, C. New genes tied to endocrine, metabolic, and dietary regulation of lifespan from a Caenorhabditis elegans genomic RNAi screen. PLoS Genetics. 1 (1), 119-128 (2005).
- Nollen, E. A., et al. Genome-wide RNA interference screen identifies previously undescribed regulators of polyglutamine aggregation. Proceedings of the National Academy of Sciences of the United States of America. 101 (17), 6403-6408 (2004).
- Samuelson, A. V., Carr, C. E., Ruvkun, G. Gene activities that mediate increased life span of C. elegans insulin-like signaling mutants. Genes & Development. 21 (22), 2976-2994 (2007).
- Johnson, D. W., et al. The Caenorhabditis elegans Myc-Mondo/Mad complexes integrate diverse longevity signals. PLoS Genetics. 10 (4), 1004278 (2014).
- Wang, Z., Sherwood, D. R. Dissection of genetic pathways in C. elegans. Methods in Cell Biology. 106, 113-157 (2011).
- Jorgensen, E. M., Mango, S. E. The art and design of genetic screens: caenorhabditis elegans. Nature Reviews Genetics. 3 (5), 356-369 (2002).
