1. Preparation of the sample
- Place a 1 mm thick silicone gasket with wells on a glass slide.
- Place a 1 mm thick 0.8% (w/v) agarose slab in the well of the silicone gasket.
- Dilute the cell density of an arbitrary microbial cell culture to an optical density at 600 nm (OD660) = 1.0.
- Place a 5 µL aliquot of cell suspension on the agarose slab.
- Cover gently with a glass coverslip.
2. Setup of a microscope
NOTE: The CRIF technique combines confocal reflection microscopy (CRM) and multichannel confocal microspectroscopy. CRM serves as the source of information for cellular morphology and spatial localization, which is independent from cellular innate fluorescence. Multichannel confocal microspectroscopy provides the spectral information of cellular innate fluorescence. In the following protocol, any image acquired with CRM or confocal fluorescence microspectroscopy is referred to as a CRM image or multichannel confocal microspectroscopy image, respectively.
- Connect a confocal microscope with descanned spectral channels to a photomultiplier tube (PMT) or GaAsP detector.
NOTE: These setups are available from several manufacturers. - Equip the microscope with a high numerical aperture (NA) objective with adequate magnification.
NOTE: A 63x objective with NA > 1.4 is recommended for analyzing bacterial cells. - Equip the microscope with a half-reflection mirror (e.g., NT 80/20) to accommodate CRM, which relies on the cellular scatter of incident light to visualize cell morphology.
- For multichannel confocal microspectroscopy, equip the microscope with dichroic mirrors. For example, use MBS InVis405, MBS458, MBS488, MBS458/514, MBS488/543, or MBS 488/543/633 beam splitters for 405, 458, 488, 514, 543, or 633 nm excitation, respectively.
- Adjust the illumination intensity for each excitation wavelength using a laser power meter. Keep the output under the microscope constant through excitation wavelengths (e.g., use 50 µW with the 63x objective).
3. Image acquisition
- Set the pinhole size to 1 AU using the microscope software.
- Set the pixel dwell time (i.e., scanning speed) for each excitation wavelength.
NOTE: An excessively long pixel dwell time can damage cells. Avoid excessively long pixel dwell time to minimize photodamage to the cells. For bacterial samples, a pixel dwell time <55.6 µs/µm2 (when the irradiance output under the microscope is ~17 µW/cm2) is usually suitable to avoid growth inhibition. This parameter may vary depending on the organisms and experimental setups. - Set the scanning resolution. For small cells such as bacteria, use a scanning area of 1,024 x 1,024.
- Set the Z-scanning range so that the region of interest is covered.
NOTE: For bacterial and yeast cell samples distributed on an agarose slab, a Z-scanning range of ~15 µm is usually sufficient. - Set the descanned detector to capture the visible wavelength range (e.g., 416−691 nm). Use a spectral window of 8−10 nm.
- Acquire multichannel confocal microspectroscopy images in a sequence from longest to shortest excitation wavelengths to create Z-stacks of fluorescence images.
- Acquire CRM images.
- Save the acquired images as 16-bit tiff files into a directory. Name the files using the naming convention XXXcYYzZZ.tif, where XXX is the excitation wavelength, YY is the detector channel number, ZZ is the Z-slice number, and “c” and “z” are prefixes for the detector number and the Z-slice number, respectively.
- For example, if a multichannel confocal microspectroscopy image is taken with an excitation wavelength of 405 nm, 1st detector channel of the detector array, and is the 5th slice of the Z-stack, name it “405c01z05.tif”. For CRM images, use the string “CRM” in place of XXX (e.g., “CRMc01z05.tif”).
NOTE: Decide whether 2D or 3D segmentation is most suitable for the image data. Use a 2D segmentation method in situations where small cells are constrained to a 2D plane (e.g., bacterial population adhering to a glass surface). Use the 3D segmentation method in situations where the cell population is distributed in a three-dimensional space (e.g., biofilms and tissue samples) or the cell sizes are larger than the thickness of the optical slice (e.g., yeast cells, mammalian cells). For 2D segmentation refer to section 4; for 3D segmentation, refer to section 5.
- For example, if a multichannel confocal microspectroscopy image is taken with an excitation wavelength of 405 nm, 1st detector channel of the detector array, and is the 5th slice of the Z-stack, name it “405c01z05.tif”. For CRM images, use the string “CRM” in place of XXX (e.g., “CRMc01z05.tif”).
4. 2D image analysis
- Equip a workstation with image analysis software (e.g., MATLAB).
- Perform cell segmentation and reconstruction of single-cell innate fluorescence signatures.
- Open the image analysis software.
- Double-click and open one of the provided scripts “Script2D.m”.
- Go to the Editor tab, then click Run. A folder selection window should appear.
- Select the directory created in step 3.8, then click Open to proceed. A dialogue box that prompts the input of the segmentation parameter will automatically appear.
NOTE: For test purposes select the provided dataset (“Sample_2D”). The sample dataset is provided as a compressed file and should be extracted in advance. - Input the segmentation parameters: Threshold of Image Binarization (0−1) for Image Binarization = 0.45, Upper Threshold For A Cell Region (in pixels) = 200, Lower Threshold for a Cell Region (in pixels) = 10, and The Number of Detectors = 32. Click OK to proceed.
NOTE: These parameters may require adjustment depending on the image quality. - A new image window presenting a CRM image should appear. Select an arbitrary background region (i.e., area where cells are absent) to use for background subtraction. Draw a rectangle within the CRM image by mouse dragging. Double-click within the selected region to confirm the selection.
- Find a new directory named Signature in the same directory selected in step 4.2.4.
NOTE: The provided code automatically creates this directory. The “Signature” directory stores the innate fluorescence signature of each microbial cell within a population as .png files that are serially numbered after a common prefix “Signature”.
5. 3D image analysis
- Equip a workstation with the image analysis software (Table of Materials).
- Perform cell segmentation and reconstruction of single-cell innate fluorescence signatures.
- Open the image analysis software.
- Double-click and open the provided script “Script3D.m”.
- Go to the Editor tab, then click Run. A folder selection window should appear.
- Select the directory created in step 3.8, then click Open to proceed. A dialogue box that prompts the input of the segmentation parameters will automatically appear.
NOTE: For test purposes select the provided dataset (“Sample_3D”). The sample dataset is provided as a compressed file and should be extracted in advance. - Input the segmentation parameters: Threshold of Image Binarization (0–1) for image binarization = 0.01, Upper Threshold for a Cell Volume (in pixels) = 1,000, Lower Threshold for a Cell Region (in pixels) = 20, X Pixel Size [μm/pixel] = 0.26, Y Pixel Size [μm/pixel] = 0.26, Z pixel Size [μm/pixel] = 0.42, and The Number of Detectors = 32. Click OK to proceed; a dialogue box that prompts the input for the number of excitation wavelengths will appear.
NOTE: These parameters may require adjustment depending on the image quality. - Input the number of wavelengths used for image acquisition (e.g., if 405, 488, 561, 630 are used, enter 4 in the dialogue box). Click OK.
- Enter the excitation wavelengths in a sequence from shortest (i.e., box name: Excitation No. 1) to longest wavelength into the dialogue boxes. Click OK to proceed; a new image window that presents a CRM image should pop up.
- Select the arbitrary background region (i.e., area where cells are absent) to be used for background subtraction. Draw a rectangle within the CRM image by mouse dragging. Double-click within the selected region to confirm the selection.
- Find the directory named Signature in the directory selected in step 5.2.4.
NOTE: The provided code automatically creates this directory. The “Signature” directory stores the innate fluorescence signature of each single microbial cell within a population as .png files that are serially numbered after a common prefix “Signature”.
6. Statistical analysis
NOTE: Perform dimensional reduction techniques (e.g., principal component analysis [PCA]) to visualize the distribution of hyperspectrums of the cell populations. The provided script (PCA.py) executes PCA for two cell populations (i.e., two classes).
- Equip a workstation with the programming language and accompanying libraries and modules (Table of Materials).
- Create an empty directory in the C drive (or equivalent) and name the directory “Parent_directory” (i.e., C:/ Parent_ directory).
- Store the fluorescence signatures (e.g., the .png files generated in step 4.2.7) of each of the two cell populations into two separate directories.
NOTE: The two directories should be both located in the “Parent_directory”.
C:/Parent_directory/
 putidaKT2440/

 Signature01.png
Signature02.png
:
putidaKT2442/
Signature01.png
Signature02.png
: - Download PCA.py into the “Parent_directory”.
- Open the command line interface of the workstation.
- Type “python C:/Parent_directory/PCA.py” in the command line interface.
- Select the “Parent_directory” after the message ‘Select target directory’ is displayed.
- In the “C:/Parent_directory”, find “PCA.png”, which contains a resulting PCA plot.
Figure 1A shows the typical single-cell fluorescence signature of a bacterial cell presented as a traditional spectrum plot (top) and as a heatmap (middle). Figure 1B shows the result of an accurate 2D cell segmentation superimposed over the original CRM image of a population of soil bacteria (Pseudomonas putida KT2440)12. The resulting innate fluorescence signatures for the population are presented as a heatmap in Figure 1D. Note that intrapopulation variability was relatively minor following successful cell segmentation. An example of inaccurate cell segmentation is shown in Figure 1C, which is superimposed onto the same population of P. putida as shown in Figure 1B. The impact of inaccurate cell segmentation on the innate fluorescence signatures of the population is readily apparent from the considerable number of outliers (Figure 1E, red triangles). Inaccurate cell segmentation resulted in a looser cluster after PCA compared to the tight cluster obtained following accurate cell segmentation (Figure 1F).
Typically, despite intraspecies variability, innate fluorescence signatures of different cell types form distinct clusters. Figure 2C presents the result of PCA analyses for a taxonomically close pair of strains (P. putida strain KT2440 and strain KT244213). Despite the minor variability observed within each separate population (Figure 2A,B), each population formed a distinct cluster on the PCA analysis plot (Figure 2C).
Figure 3A shows the result of accurate 3D cell segmentation superimposed over the original CRM image of a population of budding yeast Saccharomyces cerevisiae YM427114. Figure 3B shows the resulting innate fluorescence signatures for the population.
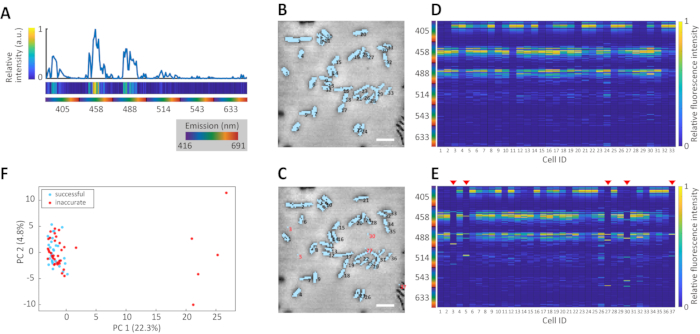
Figure 1: Accuracy of segmentation and apparent intraspecies variability. (A) Typical single-cell innate fluorescence signature of a bacterial cell (P. putida KT2440), presented as a spectrum plot (top) and a heat map (middle). The emission wavelength is indicated as a rainbow color map (bottom). The Y axis of the spectrum plot and the color of the heat map both indicate the relative fluorescence intensities. The numbers in the bottom indicate the excitation wavelength. Visual representation of accurate (B) and inaccurate (C) cell region recognition by the image analysis algorithm. Light blue shading indicates cell regions detected for a population of soil bacterium P. putida KT 2440. Blobs with red numbering in panel C are examples of false detection, where the algorithm classified non-cell regions (i.e., background noise) as cell regions due to inappropriate binarization threshold settings. Scale bars = 1 µm throughout. Panels D and E depict the innate fluorescence signatures for the same population, generated with accurate and inaccurate cell segmentation, respectively. Each column shows a reconstructed single-cell hyperspectrum presented as a 1 x 192 matrix, where the yellow-to-blue color map indicates relative fluorescence intensity. (F) The variance of innate fluorescence signatures in accurate (light blue) and inaccurate (red) segmentations visualized using PCA. Each axis label denotes the component number and its cumulative percentage contribution to the PCA analysis. Please click here to view a larger version of this figure.
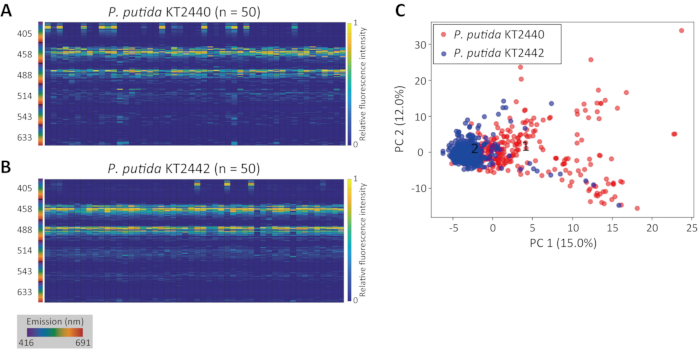
Figure 2: Intra- and interspecies variability of innate fluorescence signatures. Innate fluorescence signatures presented as heat maps for a population of P. putida KT2440 (A) and P. putida KT2442 (B). (C) Projection of the two innate fluorescence signature pairs visualized using PCA, corresponding to P. putida KT2440 (red, n = 288) and P. putida KT2442 (blue, n = 373). X- and Y-axes represent PC1 and PC2, respectively. The inset number indicates the center of each cluster (1: P. putida KT2440, 2: P. putida KT2442). Please click here to view a larger version of this figure.
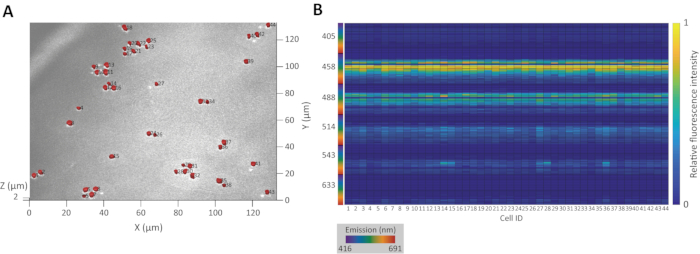
Figure 3: Example of 3D segmentation and innate fluorescence signature extraction. (A) 3D projection of regions recognized as cell populations of budding yeast S. cerevisiae YM4271. The inset numbers are the identification numbers. (B) Heat map of innate fluorescence signatures extracted from the 3D regions. The X-axis number corresponds to the identification number. Please click here to view a larger version of this figure.
