This protocol describes the use of silicon nanowires for intracellular optical bio-modulation of cell in a simple and easy to perform method. The technique is highly adaptable to diverse cell types and can be used for in vitro as well as in vivo applications.
Myofibroblasts can spontaneously internalize silicon nanowires (SiNWs), making them an attractive target for bioelectronic applications. These cell-silicon hybrids offer leadless optical modulation capabilities with minimal perturbation to normal cell behavior. The optical capabilities are obtained by the photothermal and photoelectric properties of SiNWs. These hybrids can be harvested using standard tissue culture techniques and then applied to different biological scenarios. We demonstrate here how these hybrids can be used to study the electrical coupling of cardiac cells and compare how myofibroblasts couple to one another or to cardiomyocytes. This process can be accomplished without special equipment beyond a fluorescent microscope with coupled laser line. Also shown is the use of a custom-built MATLAB routine that allows the quantification of calcium propagation within and between the different cells in the culture. Myofibroblasts are shown to have a slower electrical response than that of cardiomyocytes. Moreover, the myofibroblast intercellular propagation shows slightly slower, though comparable velocities to their intracellular velocities, suggesting passive propagation through gap junctions or nanotubes. This technique is highly adaptable and can be easily applied to other cellular arenas, for in vitro as well as in vivo or ex vivo investigations.
All biological organisms use electricity, in the form of ions, to regulate the cellular behavior. Cell membranes contain various types of specific ion channels allowing the passive and active transport of ions. These ions govern the functions of excitable cells, such as neuronal activity and skeletal and cardiac muscle contractility. However, bioelectricity also plays an important role in non-excitable cells, governing many cellular functions such as cell proliferation1, neuroimmunity2,3,4, and stem cell differentiation5.
In recent decades, the field of bioelectricity has drawn an increasing level of interest, which has contributed to the development of numerous technologies for bioelectronic interfaces. Microelectrode patch pipettes are the gold standard of intracellular recording and stimulation6. In this methodology, a glass pipette is pulled under specific conditions to form a sharp edge with a pore size of few microns. This pipette is filled with a buffer and the pipette allows direct contact of the buffer with the intracellular volume. This results in a bioelectric interface that yields extremely high signal to noise ratios, precise control over cellular electrical activity, and extremely high temporal resolution. Although this methodology is an extremely powerful tool, which was recently downscaled to a nano-pipette configuration7, it is associated with several important technical limitations. The cytosol dilution effect8, as well as mechanical vibrations, limits its utility to short term interrogations, and it requires expensive specialized equipment and a high level of technical skill. Moreover, its bulkiness limits the number of cells that can be recorded or stimulated simultaneously, and due to its invasiveness, it cannot be reconfigured throughout an experiment. To overcome these limitations, microelectrode arrays were developed, but the size of the electrodes limits the spatial resolution as well as intracellular access. Nanoelectrode arrays allow intracellular recording and stimulation but require abrasive electroporation to access the cytosol9,10. In addition, all these methodologies are substrate bound and are thus limited to in vitro cell cultures, or to external superficial cells, with no access to cells that are inside a 3-dimensional (3D) tissue.
Optogenetics11 is widely used to address these 3D and in vivo limitations. However, optogenetic methods are based on the perturbations of light-activated plasma membrane ion channels that are distributed at the plasma membrane, limiting the 3D spatial resolution12 and intracellular capabilities.
We have recently shown that silicon nanowires (SiNWs) can be used to perform intracellular bioelectric interrogation with submicron spatial resolution with different non-excitable cells, namely cardiac myofibroblasts and oligodendrocytes13. Moreover, we used these SiNWs to perform ex-vivo cell specific interrogation within a 3D cardiac tissue, to investigate how cardiac cells electrically couple in vivo14. A major advantage of this methodology is its simplicity; it does not require any genetic modification or bulky instrumentation. Many cells will spontaneously internalize photo-responsive SiNWs with no need for sonication or electroporation15. In addition, they will spontaneously escape the endosomal encapsulation and form a seamless integration with the cytosol and intracellular organelles13,15. These cell-SiNWs composites, termed cell-silicon hybrids, possess the dynamic, soft and versatile nature of the original cell, as well as the optoelectric capabilities of the SiNWs. After hybridization, the cell-SiNW hybrid can be harvested using standard tissue culture techniques and used for various applications such as intracellular bioelectric stimulation; studying intercellular bioelectric coupling in vitro; and for in vivo cell specific interrogation. As an effective stimulation requires co-localization of high optical power densities and SiNWs, one can achieve high spatial resolution both in 2D and 3D. In this protocol we describe in detail the methodology, as well as how the results can be analyzed. The focus is placed on the intra- and intercellular investigation in vitro, but the in vivo implementation of this methodology can be directly utilized for many other biological scenarios.
To ensure compliance with ethical standards, all animal procedures related to isolating cardiomyocytes from rodent hearts were first approved by the University of Chicago Institutional Animal Care and Use Committee (IACUC). Additionally, all animal experiments were conducted in complete accordance with guidance from the University of Chicago IACUC.
1. Preparation of cell-SiNWs hybrids
2. Preparation of cells for intra- and intercellular investigations
3. Optical imaging and stimulation
4. Video processing
The ability of this methodology to allow direct access to the intracellular cytosol depends on the spontaneous internalization of the SiNW into the cells. Although SiNWs will undergo spontaneous internalization into many cell types15, some cells, such as cardiomyocytes and neurons, will need the SiNWs to be treated to allow their internalization19. In this protocol we describe the internalization process of p-i-n SiNWs with 200-300 nm diameter and ~1-3 µm long into cardiac MFs. Figure 1A demonstrates how the SiNWs appeared under transmitted light microscopy. Using standard phase contrast optics, the confluent cells were easily apparent. However, the SiNWs were barely visible, making their locations impossible to define. Thus, we used dark field microscopy, where only reflecting objects can be seen and the background is dark. In this contrast, however, the cells cannot be seen, as they are not reflective. To show the location of the SiNW in the cells, we superimposed the images together, so that the perinuclear arrangement of the SiNWs within the cells is apparent. Although the colocalization of the SiNWs and cells is apparent, it still is important to verify that the SiNWs are indeed internalized within the cells, and not resting on the plasma membrane. To this end, we used confocal microscopy (Figure 1B), where the cytosol was stained with calcein-AM (green) and the plasma membrane with a membrane marker (red). The intracellular location of the SiNWs was then evident. Note that this step is extremely important in order to verify the intracellular location of the SiNWs, especially when a new cell type (or line) is used. However, after the internalization is established for the stained cells, other samples should be used for the stimulation procedure. Although it is not within the scope of this demonstration, it is also important to mention that in cases where SiNWs are not internalized, bioelectric processes may still be examined in a similar, extracellular way16. After the cells are hybridized with the SiNWs, they can be used to perform bioelectric studies.
Here we demonstrate the use of this methodology to compare the homo-cellular MF-MF electrical coupling to the hetero-cellular coupling of MFs to CMs. After the cells were hybridized with the SiNWs, the hybrids were seeded with CMs and cultured. It is important to limit the culture time so that the proliferating MFs do not overpopulate the culture. Figure 2 shows a representative example of such an experiment. Co-cultured cells were loaded with calcium sensitive dye (Fluo-4) and the cells were imaged under a spinning disc confocal microscope. Before applying any laser pulse, a brightfield image was obtained to identify the location of a SiNW that will be stimulated. Then, a short baseline video was recorded, so the spontaneously beating CMs and the resting MFs can be identified (Supplementary Video 1 and Supplementary Video 2). In this experiment, the identified SiNW was stimulated with a single point laser pulse (640 nm, 1 ms, 4 mW). The cells were constantly imaged before and after the stimulation to visualize the calcium dynamics upon optical stimulation. As cells in culture greatly differ in their brightness (Supplementary Video 1), the live videos were processed into dF/F videos with blue to red pseudocolor (Supplementary Video 2), so that the calcium signals will be clearer. In this method, each pixel is compared to its own baseline resting state, before the stimulation was applied. The representative images in Figure 2C demonstrate the calcium propagation within the MFs-CMs co-culture and can be further analyzed to study the inter-cellular electrical coupling between the different cells, as well as the intracellular calcium dynamics.
Figure 3A demonstrates a way to represent the calcium flux of the entire field of view in a single image. By analyzing the dF/F videos, we show the time at which the different cells were excited, which was determined by the point at which the change in average optical flow reaches its maximum. This way, one can see how the calcium flux propagated from cell to cell. A custom-built MATLAB script (Supplementary File 1) was written and used to calculate the optical flow and to aid in identifying the time of activation within each cell region (Figure 3B). The inter-cellular propagation speed can then be determined by measuring the distance between the centroids of each cell and dividing by the time difference in their activation. A similar analysis can be conducted that replaces distance with the number of junction crossings; for our purposes, the distance metric more faithfully presents the transmission speed as it also accounts for the time spent in intra-cellular propagation, which is non-negligible. Figure 3C demonstrates how the intra-cellular velocities were determined: for each cell, a line was drawn in the direction of calcium propagation and a kymograph was generated by plotting the intensity time profile along that line. We fit a line to the front of the activation wave in the kymograph, such that the slope of the line represented the inverse of the intra-cellular propagation speed. Figure 3D summarizes the different velocities (inter- and intra-cellular) for the different cells in the co-culture. All of the data represented in this graph were derived from the single video of a single representative field of view that was presented here.
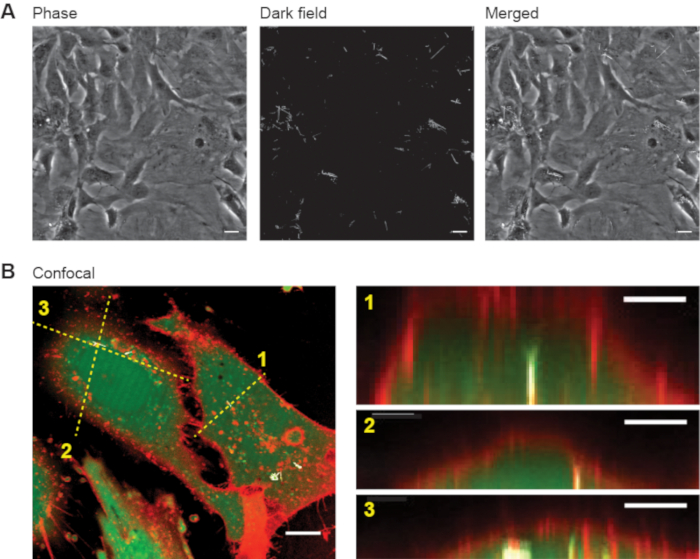
Figure 1: SiNWs internalized into MFs. (A) Phase contrast image of MFs treated with SiNWs show confluent cells (left). Darkfield image shows the SiNWs dispersed in the field of view (middle), while superimposing the two images (right) shows the perinuclear arrangement of the SiNWs within the MFs. Scale bars are 20 µm. (B) Representative confocal image (left, Scale bar is 10 µm) and 3 different n-z cross-sections that corresponds to the 3 dashed lines (right, Scale bars are 5 µm) show the inner part of a MF and the SiNW that are clearly inside the cytosol. The cytosol is green (Calcein-AM), the membrane red (cell mask), and the SiNWs white (reflection). Please click here to view a larger version of this figure.
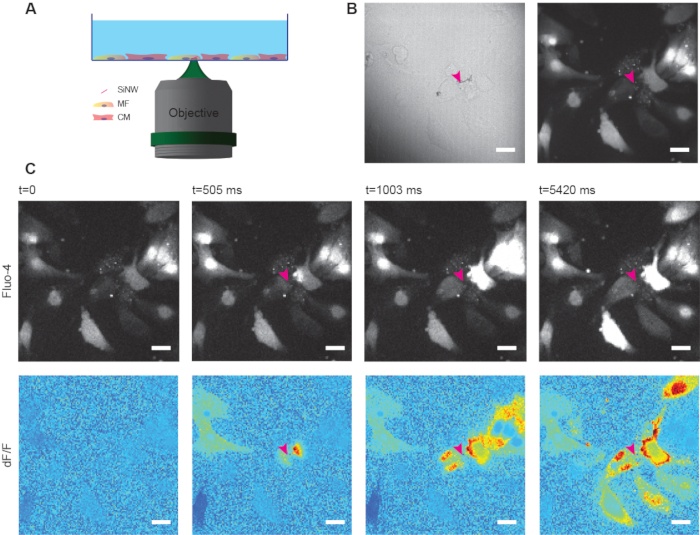
Figure 2: Calcium propagation in MF-CM co-culture. (A) Illustration of a typical stimulation experiment. MFs with internalized SiNWs are stimulated with a laser pulse, while the calcium flux is monitored by a calcium sensitive dye. (B) A bright field image of the cells shows the internalized SiNW inside one of the MFs (left) and a representative fluorescence image of the calcium dye (right). The stimulated SiNW is highlighted by a pink arrowhead. (C) A co-culture of MFs and CMs was loaded with calcium sensitive dye and a SiNW was stimulated with a laser pulse (640 nm, 1 ms, 4 mW). The calcium flow was monitored by the Fluo-4 intensity (top images) and a dF/F video was derived from it (bottom images). The dF/F algorithm makes the visualization of the calcium flux clearer, as it compares the intensity of each pixel to its own baseline, thus showing the change, and not the actual intensity. Scale bars is 20 µm. Please click here to view a larger version of this figure.
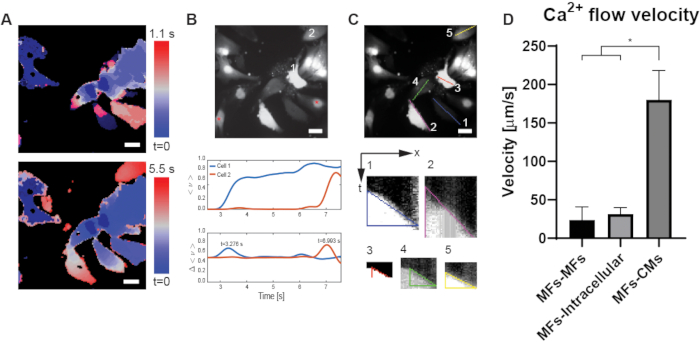
Figure 3: Analysis pf the dF/F videos from Figure 2. (A) the calcium propagation can be visualized via an optical mapping image, where the color codes for time the pixel was excited (meaning increase in calcium concentration and Fluo-4 relative intensity). The optical mapping can be done for different time frames, i.e. short (1.1 s, top image) or longer (5.5 s, bottom image) durations. Scale bars are 20 µm. (B) Representative examples for calculating cell-cell transmission speed. Both cells are MFs here, but the same computation can be performed with MF-CM transmission. The graphs show the traces for the average optical flow (middle) and the differential (bottom) for each cell. The cell-cell transmission can then be calculated using the Tmax for both cells as well as their centroids, as described in the text. Red asterisks denote two CMs with limited MF-CM coupling and hence lack of response to optical stimulation. Scale bars are 20 µm. (C) the MFs’ intracellular calcium flux velocity was derived from the slope of a kymograph generated by slicing the colored lines. The kymographs represent intensity along the line (x axis) and time (y axis), so that steeper slopes correspond to higher velocities. Scale bars are 20 µm. (D) The MFs-MFs and MFs-CMs inter-cellular velocities, as well as the MFs’ intra-cellular velocities can be derived from B and C respectively and plotted for comparison (p-value<0.0001). Please click here to view a larger version of this figure.
Supplementary Video 1: Effect of the MF-SiNW hybrid optical stimulation by Fluo-4. The CMs rate is illustrated before and after the stimulation for comparison. Please click here to view this video. (Right-click to download.)
Supplementary Video 2: Effect of the MF-SiNW hybrid optical stimulation by the dF/F video, derived from the Fluo-4 videos. The CMs rate is illustrated before and after the stimulation for comparison. Please click here to view this video. (Right-click to download.)
Supplementary Figure Please click here to download this figure.
We have demonstrated here a simple way to perform intracellular electrical stimulation of cells. In this demonstration, we used MFs that were prehybridized with SiNWs, then co-cultured with CMs. In general, most proliferating cells have the tendency to internalize SiNWs, which allows the use of this methodology with many other cell types. Moreover, while we demonstrated the intracellular stimulation of cells, the same principles can be used to perform extracellular stimulation of cells. This can be done by blocking endosomal cascades15 of cells that will spontaneously internalize them, or using cells that do not internalize SiNWs. For instance, although CMs were found to internalize some nanostructures20,21, they do not spontanously internalize SiNWs15. The SiNWs used here were synthesized using a chemical vapor deposition (CVD) apparatus. Refer to additional resources regarding the detailed procedure for SiNWs synthesis, which can be found elsewhere16. After obtaining SiNWs, their handling and use are simple, and do not require any sophisticated or expensive equipment that is not readily available in a standard bio-medical lab. The SiNWs can be easily seen using standard darkfield microscopy (Figure 1), which makes it easy for the user to follow the internalization process and determine the appropriate SINW concentration and treatment duration that is necessary for successful internalization. It is also highly recommended to determine the exact final location of the SiNWs after the internalization step is complete. This can be done by commercially available dyes used for live-dead assays (such as Calcein-AM, used here) and confocal microscopy (Figure 1B). This step is important when a different line of cells is used for the first time, and the cell-SiNW interaction is unclear. Different cells might internalize SiNW under different conditions i.e. time, concentration, and size distribution. However, after the internalization process is characterized for a given cell, this verification procedure can be skipped while performing mechanistic bio-electric studies.
After the cells are hybridized with the SiNWs, they can be harvested by standard tissue culture techniques and used for bioelectric investigations. In this protocol, we used MFs-SiNWs hybrids to investigate how MFs electrically couple to other MFs, or to CMs in vitro. However, it is important to note that this procedure can be used to perform in vivo assays as well. For instance, in a previous study from our lab we used this methodology to study how MFs electrically couple to CMs in vivo and compare that to their coupling in vitro14. As this process requires some more technical capabilities, it is not described in this protocol, but the details can be found in our previous study. Here, we show how the hybrid cells can be used to learn how calcium propagates intra- and intercellularly within the co-culture (Figure 2A). To begin the experiment, the location of a SiNW is determined for point stimulation. Although SiNWs are barely visible using phase contrast, it is important to mention that standard brightfield (without phase or darkfield contrast) will also allow their visualization (Figure 2B), without any need for fluorescent labeling or specialized microscopy techniques. After identifying a SiNW of interest, one can apply an optical pulse to electrically stimulate the cell. Before stimulation is applied, baseline recording of the cells shows spontaneous electrical activity in four different groups of CMs, which seem to be unsynchronized in their electrical activity (Supplementary Video 1 and Supplementary Video 2). Moreover, 8 different MFs with no spontaneous electrical activity can be seen. Representative calcium dye and dF/F images show the propagation of calcium throughout the culture upon optical stimulation (Figure 2C, and Supplementary Video 1 and Supplementary Video 2). These live videos can be further analyzed to learn the electrical coupling of the different cells in the field of view (Figure 3). First, optical mapping of the video (Figure 3A) shows the sequence of cells that are stimulated by the optical pulse. The time bars on the right are relative to first frame after the optical stimulation was applied. As the CMs’ response to the stimulation is much faster than that of the MFs, we performed the optical mapping twice, with different time frames. The first was performed to show the fast CMs response, so that the color range covers 1.1 s after the stimulation. This shows the order in which the different CMs and the first MFs are excited by the stimulation. However, since there are MFs that are further downstream the propagation path, their excitation timing does not appear in this mapping. Thus, the same analysis was performed for a longer duration, which give less details on the initial response, but clearly demonstrates the lag time and slower response of MFs that are downstream from the excitation site. Using our custom-built algorithm, we were able to provide a reproducible quantitative analysis of the maximal calcium flux timing, which we used as a reference, along with the cell’s distance from the stimulation, to determine the intercellular propagation velocity to that cell. This was performed on both the CMs and the MFs, so that the clear difference between the passive (MF-MF) and amplified (MF-CM) propagation can be measured. Moreover, it can be clearly shown that the electrical activity of two CMs (red asterisks in Figure 3B) are unaffected by the optical stimulation. This may be attributed to the fact that not all cells are equally coupled to another within the culture. This technique allows the user to identify which cells in the field of view are indeed coupled to the stimulated cell, and which are not. Additionally, we were able to determine the propagation direction within each cell and set a parallel line that was used to derive a kymograph describing the propagation within that cell. This was used to determine the intracellular calcium flux velocity, according to the slope of the kymograph (Figure 3C). When all intra- and intercellular velocities were compiled, it was clear that the CMs’ response was significantly faster than that of the MFs’ response to the optical stimulation. Concurrently, the MFs’ intracellular velocities were found to be slightly faster, but comparable to the MF-MF intercellular propagation velocities. This observation suggests that unlike the amplified electrical coupling between MFs to CMs, the intercellular electrical coupling between the MFs is passive, and based on diffusion of calcium through the intracellular volume, and then intercellular gap-junctions22,23 or tunneling nanotubes24, acting like a bottleneck which slows down the propagation velocity. The ability of the SiNWs to transduce the optical stimulation to a bioelectric interrogation may be attributed to the photoanodic and photocathodic reaction at the p-n junction of the SiNWs, or to the photothermal reaction due to the low heat capacity of the SiNWs13. Although other nanoscale particles can transduce optical stimulation25, they are usually encapsulated into an endosomal envelope26, limiting their ability to directly interface with intracellular organelles for local interrogation. It is important to realize that the high optical density of the stimulation may result in cellular damage due to the photothermal effect. Thus, it is important to optimize the power and pulse length so that such an effect will be avoided. However, for sensitive cells, it is possible to study how the calcium propagates between the other cells in the culture, even if local thermal damage is applied to the stimulated cell.
Another key aspect of this analysis methodology is that all the data shown in Figure 3D were collected from a single video of a single field of view within that culture. Despite using a single field of view, the data collected was still strong enough to obtain statistical significance, which demonstrates the strength and efficiency of this methodology. To analyze and study more delicate and subtle effects, a much larger data set can be easily generated by stimulating other cells within the same culture. For a glass bottom dish with effective diameter of 10 mm, one can find more than 2000 fields of view to analyze. As a simple point laser stimulation needs to be set, each stimulation experiment should take less than 1 min to perform. This will allow many mechanistic studies to be performed in a way that are inaccessible using traditional techniques such as patch-clamp, or microelectrode array with predefined electrode positions. Moreover, the nano-scale size of the SiNWs used herein, allows for stimulation with extremely high spatial resolution. As for the temporal resolution, it will be determined by the microscope used for the imaging/simulation. In this context, using imaging will result in low temporal resolution, this can be improved by using more time sensitive electrophysiology techniques, such as patch clamp or micro-electrodes arrays. Although SiNWs are considered to be bioabsorbable in the long term, we have never noticed any noticeable degradation within the time frame of up to 7 days, which will allow its use for most in vitro studies.
Overall, we used a simple and straight forward technique to perform an in vitro bio-electric investigation of cardiac cells. We show how we can study the different way different cells are coupled to one another and described a reproducible way to quantify calcium propagation and velocity. The technique is adaptable to other cell types, as well as to in vivo and ex vivo settings. It is based on standard fluorescence microscopy and a coupled laser that are broadly available to standard biomedical labs, and there is no need for specialized equipment. The technique can be easily mastered and can allow the collection of large data sets in minimal time, as compared to available techniques.
The authors have nothing to disclose.
This work is supported by the Air Force Office of Scientific Research (AFOSR FA9550-18-1-0503).
35 mm Glass bottom dishes | Cellvis | D35-10-0-N | |
3i Marianas Spinning Disk Confocal | 3i | ||
Calcein-AM | Invitrogen | C1430 | |
CellMask Orange Plasma membrane Stain | Invitrogen | C10045 | |
Collagen I, rat tail | Gibco | A1048301 | |
Deluxe Diamond Scribing Pen | Ted Pella | 54468 | |
DMEM, high glucose, pyruvate, no glutamine | Gibco | 10313039 | |
DMSO, Anhydrous | Invitrogen | D12345 | |
Falcon Standard Tissue Culture Dishes | Falcon | 08-772E | |
Fetal Bovine Serum, certified, heat inactivated, | Gibco | 10082147 | |
Fibronectin Human Protein, Plasma | Gibco | 33016015 | |
Fisherbrand 112xx Series Advanced Ultrasonic Cleaner | Fisher Scientific | FB11201 | |
Fluo-4, AM, cell permeant | Invitrogen | F14201 | |
FluoroBrite DMEM Media | Gibco | A1896701 | |
L-Glutamine (200 mM) | Gibco | 25030081 | |
OKO full environmental control chamber (constant temperature, humidity and CO2) | OKO | ||
PBS, pH 7.4 | Gibco | 10010023 | |
Penicillin-Streptomycin (10,000 U/mL) | Gibco | 15140122 | |
Pierce Primary Cardiomyocyte Isolation Kit | Thermo Scientific | 88281 | |
Trypsin-EDTA (0.25%), phenol red | Gibco | 25200056 |